The spatially-resolved NUV color of local star-forming galaxies and clues for quenching
Abstract
Using a sample of 6,000 local face-on star-forming galaxies (SFGs), we examine the correlations between the NUV colors both inside and outside the half-light radius, stellar mass and Sérsic index in order to understand how the quenching of star formation is linked to galaxy structure. For these less dust-attenuated galaxies, NUV is found to be linearly correlated with , supporting that NUV is a good photometric indicator of stellar age (or specific star formation rate). We find that: (1) At , the central NUV is on average only 0.25 mag redder than the outer NUV. The intrinsic value would be even smaller after accounting for dust correction. However, the central NUV becomes systematically much redder than the outer NUV for more massive galaxies at . (2) The central NUV shows no dependence on Sérsic index at , while above this mass galaxies with a higher tend to be redder in the central NUV color. These results suggest that galaxies with exhibit similar star formation activity from the inner region to the region. In contrast, a considerable fraction of the galaxies, especially those with a high , have harbored a relatively inactive bulge component.
Subject headings:
galaxies: evolution – galaxies: star formation1. Introduction
The issue of how star formation gets shutdown in galaxies (quenching) remains less understood to date. From the theoretically perspective, several quenching mechanisms have been proposed, including the active galactic nucleus (AGN) feedback (Croton et al., 2006; Hopkins et al., 2006), halo shock-heating (Dekel& Birnboim, 2006; Cattaneo et al., 2006), morphological quenching (Martig et al., 2009) and the environmental effects (Gunn & Gott, 1972; Toomre& Toomre, 1972; Moore et al., 1996; Boselli & Gavazzi, 2006; Weinmann et al., 2009). However, observationally it is extremely difficult to identify the dominant working mechanism. For instance, massive galaxies preferentially reside in dense regions (Li et al., 2006), .i.e., the halo quenching and environmental effects are possibly both at work. In the meanwhile, they have a high probability of simultaneously hosting an AGN and a bulge component (Kauffmann et al., 2003a; Heckman et al., 2004; Schawinski et al., 2010), making it difficult to isolate the effect of AGN feedback from that of a central bulge. Such complexities have greatly hampered our knowledge of the detailed quenching picture.
In order to identify the dominant mechanism by which star formation shuts down in galaxies, much works explore the dependence of quiescence, or the quenched fraction upon a specific variable, while keeping other variables fixed (Peng et al., 2010; Bell et al., 2012; Cheung et al., 2012; Quadri et al., 2012; Woo et al., 2013; Kovač et al., 2014; Bluck et al., 2014; Lang et al., 2014; Omand et al., 2014; Knobel et al., 2015; Woo et al., 2015). For instance, Cheung et al. (2012) find that the color of a galaxy is mostly tightly linked to a dense galaxy inner structure. Similar results are reported by Lang et al. (2014) and Bluck et al. (2014), who further show that quenched fraction is most tightly linked to bulge mass. Given the tight correlation between bulge mass and black hole mass, the authors suggest that AGN feedback is most favored.
Note that the above methodology strongly relies on the tightness of the measured quiescence–variable relation. This can be misleading in some cases. As shown in observations and simulations, a fraction of the quenched galaxies will undergo dry merging (van Dokkum, 2005; Naab et al., 2007; Bundy et al., 2009; Kormendy et al., 2009; Tal et al., 2009; Hopkins et al., 2010), through which the properties of galaxies are reshaped and the clues of quenching are smeared out. As a consequence, some properties of the dry merging remnants may be well correlated with quiescence, however they are not directly pointing to the quenching processes. An example is the phenomenology of ”mass quenching” (Peng et al., 2010), that galaxies with high stellar mass () tend to have a high quenched fraction. There have been evidences showing that the properties of giant quenched galaxies (such as structure and Faber–Jackson relation) are more reasonably interpreted in a dry merging framework (Kormendy et al., 2009; Bernardi et al., 2011a, b; Kormendy& Bender, 2013).
Dry merging is obviously irrelevant to quenching. To avoid such a confusion, one could alternatively search for the clues at the epoch when a galaxy is not fully quenched yet. Such attempts have been carried out by studying the green valley galaxies (Mendez et al., 2011; Pan et al., 2013; Schawinski et al., 2014; Pan et al., 2014). To make a step further, it will be exiting to probe the onset of quenching in a star-forming galaxy (SFG). However, this is very challenging since it is difficult to determine which SFG is going to quench. A practicable way would be studying the star formation properties of individual SFGs to search for the early quenching signals. Ideally, a direct investigation of the specific star formation rate (sSFR) distribution of a SFG will be helpful in diagnosing whether quenching has occurred in that galaxy. Such studies require a data set which contains 2-dimensional information of individual galaxies, for example, the integral field spectroscopic (IFS) data. The IFS sample obtained in the early projects (such as SAURON (Bacon et al., 2001) and DiskMass (Bershady et al., 2010)) is proved to be powerful in studying galactic physics. However, the existed IFS sample is still relatively small. To collect a larger IFS sample, several large projects such as MaNGA (Bundy et al., 2015), CALIFA (Sánchez et al., 2012) and SAMI (Croom et al., 2012) are launched recently. Exploiting the early data products of these projects, some studies have begun to study the 2-dimensional star formation histories of a large local galaxy sample (Pérez et al., 2013; Cid Fernandes et al., 2013; González Delgado et al., 2014; Li et al., 2015; González Delgado et al., 2015).
To resolve the sSFR of a large galaxy sample, one can alternatively use the existed multi-band imaging data. The 2-dimensional properties of galaxies can also be studied by utilizing spatially-resolved multi-band photometry (de Jong, 1996; Kong et al., 2000; Muñoz-Mateos et al., 2007; Suh et al., 2010; Lin et al., 2013). In this paper, we use the (Martin et al., 2005) and SDSS (York et al., 2000) data to resolve the star formation properties inside/outside the half light radius of a large local SFG sample. Throughout this paper, we assume a concordance CDM cosmology with , , Mpc-1, and a Kroupa (2001) IMF.
2. Method and data used
This work makes use of the UV–optical multi-band data, which are drawn from the SDSS and survey. With these data, it is still challenging to directly measure of the sSFR distribution of galaxies. To be simplified, in this work we will use NUV color as the representative of sSFR. Since UV luminosity is an SFR indicator (e.g., Kennicutt, 1998), NUV is thus a proxy of SFR/, where is the -band luminosity. In this sense, NUV is a luminosity weighted sSFR. Salim et al. (2005) first establish that the star formation history of a galaxy can be well constrained on the basis of its NUV color. In a recent paper, Salim (2014) further shows that NUV is more tightly correlated with sSFR than and , especially in the low sSFR regime.
The imaging has a relatively low resolution (The GALEX NUV image has a resolution of 1 pixel=15 and a point spread function (PSF) with full width at half-maximum (FWHM)=53), which hampers a high-resolution study for a large SFG sample. To investigate a large sample, in this work we only resolve the NUV color of galaxies in two regions, .i.e, a central region and an outer region. We refer the central region to be , where is the radius enclosing 50% of the SDSS -band petrosian flux. By doing this, one can simply perform aperture photometry to obtain NUV for a galaxy sample which with a similar angular size.
Based on the UV–optical raw imaging data, we have generated a multi-band photometric catalog following the pipeline of Wang et al. (2010). Here we give a brief review of the data processing. As the first step, we cross-matched the SDSS Data Release 8 spectroscopic sample (Aihara et al., 2011) with the DR6 frames and downloaded their UV+opical images. For the FUV and UV bands, only those with an exposure time greater than 1000 seconds are finally used. We register every image to the frame geometry of the NUV band. The images of each galaxies are then sheared into stamps. Since the SDSS image has a higher resolution than the UV image, we degrade the former by convolving a NUV PSF kernel so that the UV and optical images are finally spatially matched. The PSF kernel is generated by stacking the star images in that frame. For the PSF-matched galaxies, we then measure their magnitudes over 5 apertures, with [15, 30, 60, 90, 120] by running the software SExtractor (Bertin& Arnouts, 1996). SExtractor also measures the total magnitude of a galaxy (). Finally, we correct the magnitudes for galactic extinction using the galactic dust map of Schlegel, Finkbeiner & Davis (1998).
Some publicly available data are also utilized. The structure parameter catalog used in the following is from Simard et al. (2011). Simard et al. (2011) perform a bulge+disk structure decomposition to the SDSS spectroscopic galaxies with the software GIM2D. The global galaxy Sérsic index used in this work is from the -band modeling, through which is allowed to vary from 0.5 to 8. Both stellar mass () and the 4000 Å break strength () are from the MPA/JHU database111http://www.mpa-garching.mpg.de/SDSS/DR7. is derived following Kauffmann et al. (2003b), with a typical uncertainty of =0.07 dex.
3. Sample selection
Our UV-optical matched catalog contains 222,065 galaxies. To ensure that the measured central NUV color is not significantly affected by the relatively poor resolution of the GALEX images, we limit the sample galaxies to have , which is approximately 2 times the PSF size. With this size limit, we can simply take the NUV measured inside the =60 aperture as a proxy of NUV. In the following, NUV refers to NUV if not specifically stated. The detailed sample selection criteria are as follows:
(1) , where is the SDSS spectroscopic redshift. 88,465 out of the 222,065 galaxies are within this redshift range.
(2) minormajor axis ratio . NUV color is very sensitive to dust attenuation. Removing the edge on objects can greatly alleviate the dust reddening effect on the color measurement. Besides dust effect, the central region of an edge-on galaxy is a superposition of its disk and bulge component, making it difficult to derive its true central color. Thus we remove the edge on galaxies from further analysis. This criterion keeps 59,177 out of the 88,465 ones that pass (1).
(3) 40¡¡80, to ensure that the aperture encloses % of the total flux of a galaxy. This criterion is quite strict and only 9,391 out of the 59,177 galaxies are passed.
(4) We restrict the galaxies to be brighter than 23.0 mag in the NUV band, to ensure the accuracy of the color measurement. In fact, as shown bellow, our selected SFGs mostly have ¡20.0 mag. Of the 9,391 galaxies, 8,980 were kept.
(5) stellar mass .
Criteria of (1)(5) finally yield a sample of 8,200 galaxies. We note that this sample is not volume-completed and our conclusions do not rely on the selection completeness in the volume.
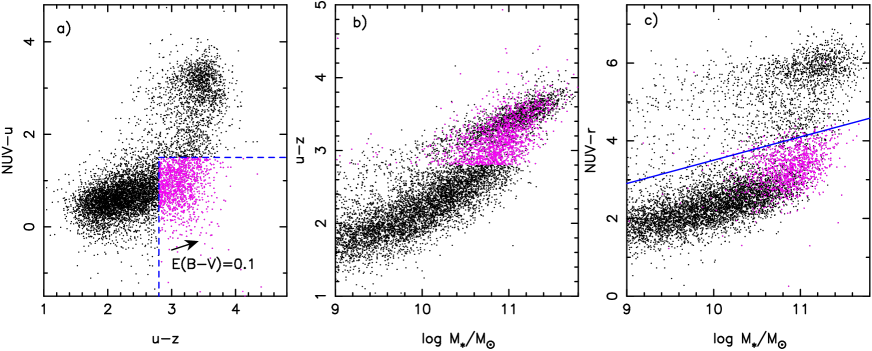
The observed colors of galaxies are more or less reddened by their dust contents. To separate the dust-reddened SFGs from truely passive galaxies, a color–color diagram is commonly adopted in the literature (Williams et al., 2009; Bell et al., 2012; Chang et al., 2015). In panel a) of Figure 1, we plot the selected 8,200 galaxies on the versus color–color diagram. One can find that a significant fraction of the galaxies have colors that are as red as those of the passive galaxies, whereas lie on the star-forming sequence, i.e., they are still SFGs. In panel b), it is clear many optically red SFGs will be misclassified as passive galaxies when using the optical color–mass diagram. Note that most of these galaxies have log()¿10.4. Panel c) shows the NUV versus diagram. On this diagram, one can see that the optically red SFGs still lie on the star forming sequence. Our final SFG selection criterion is defined as NUV=0.6log–2.5, which is shown in the blue line of panel c). This criterion is approximately equivalent to the color–color selection and will not miss the dusty SFGs. The final SFG sample contains 6,324 galaxies.
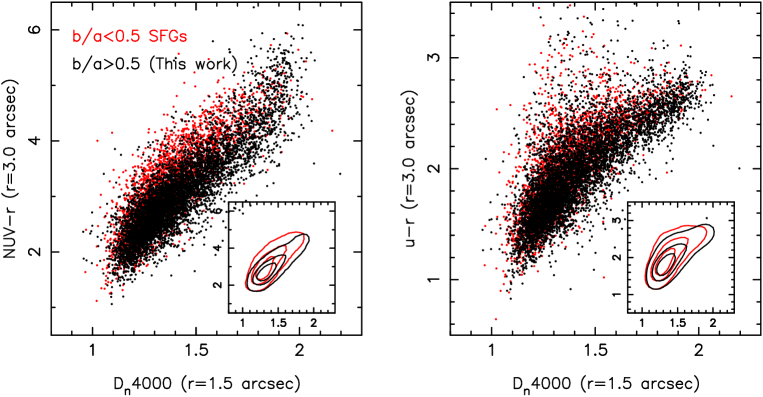
Although the good correlation between NUV and sSFR has been established in Salim (2014), at this point it is still necessary to investigate to what extend NUV can trace sSFR for our sample. We explore the relation between NUV and the 4000 Å break strength (4000). 4000 is in good correlation with sSFR and usually taken as a mean stellar age indicator (Brinchmann et al., 2004). More importantly, 4000 is dust-free. In Figure 2, we compare the NUV measured in a central aperture with 4000 2224000 is measured from the SDSS fiber spectra.. We use NUV due to the resolution of imaging. For comparison, we also plot the SFGs that with on this diagram. As shown in the figure, NUV and 4000 form a linear correlation. After excluding the edge on galaxies, the tightness of this correlation is significantly improved. In the right panel, we show the correlation between and 4000. It is clear that is less sensitive to 4000 when 4000¿1.6, because optical colors are insensitive to low level sSFR.
Note that in Figure 2, NUV and 4000 are measured over different apertures. If 4000 exhibits a non-zero gradient within the aperture, then it will bring some scatters into this relation. Li et al. (2015) show that centrally quenched galaxies usually exhibit significantly negative gradient over , where is the effective radius. In contrast, centrally star-forming ones do not have obvious gradient. One can find that the correlation seems shift rightward at 4000¿1.6 than the outward extrapolation of the 4000¡1.5 data points, which is expected according to the findings of Li et al. (2015). Once NUV and 4000 are taken from the same region, the correlation between them should be even better than that shown in panel a). In general, Figure 2 supports that for the face-on objects, NUV is a good photometric sSFR (or stellar age) indicator.
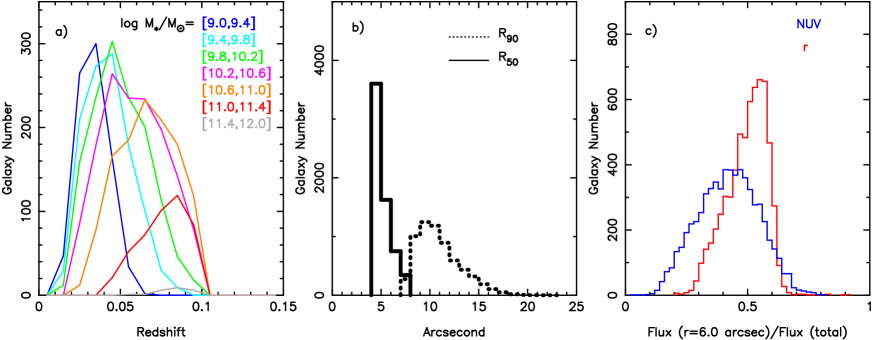
In panel a) of Figure 3, we show the redshift distribution of the 6,324 SFG sample. As can be seen, for galaxies of fixed , only those within a certain redshift interval are finally selected. This is due to the combination of the underlying –size relation and criterion (3). Panel b) shows the and distributions for our sample. Both and are shown in angular size but not in physical size. We expect the SFGs to have a distribution which peaks at 60, so that the aperture can well corresponds to the half light radius of this sample. From panel b) one finds that most of the SFGs have an angular size of . Panel d) shows the central flux fraction () distribution. Here the total flux is converted from . One can see that the central flux fraction peaks at in the band, which is slightly higher than our expectation. This is due to the relatively low distribution of this sample. However, the distribution is quite narrow, which mainly spans from 0.4 to 0.6. Thus in the following analysis one can still treat roughly as .
4. The uncertainty of NUV
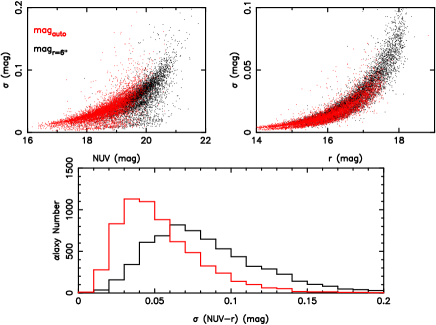
In the next section we will carry out an analysis on NUV and NUV. Before doing this it is important to assess the accuracy of our color measurement. Figure 4 presents the output magnitude uncertainty measured by SExtractor for our SFGs. Measurements of the aperture and the total galaxies are shown in black and red symbols, respectively. In general, fainter objects have greater magnitude uncertainties. One can see that most SFGs have ¡20.0 mag in the NUV band, which is 3.0 mag brighter than the NUV limiting magnitude. The color uncertainty distributions are shown in the bottom panel. In this panel one can see that the uncertainties of the NUV and NUV are 0.08 mag and 0.04 mag, respectively. Assuming that the color uncertainty of NUV is of a similar order to that of NUV, the uncertainty of the color discrepancy between the two probed sub-regions, [(NUV)–(NUV)], is 0.15 mag.
5. result
5.1. The dependence of NUV and NUV on
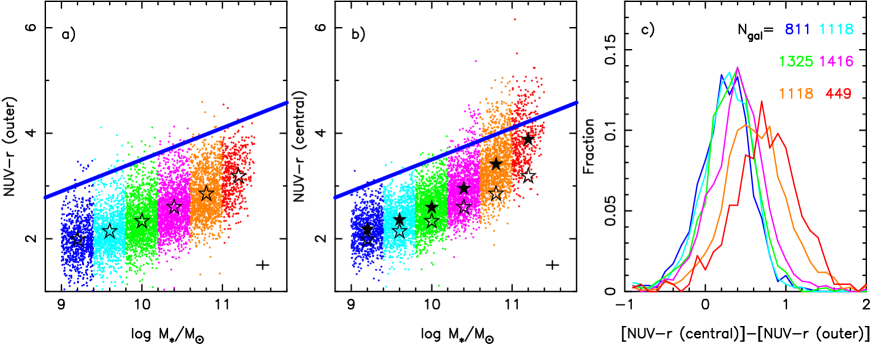
Panel a) of Figure 5 explores the relation between NUV and . The SFGs are divided into 6 mass bins, with a bin size of =0.4 dex. As one can see, NUV becomes redder when increasing . Panel b) shows the (NUV)– relation. For comparison, we overplot the (NUV)– relation as well. It is clear that NUV is only slightly redder than NUV at log()¡10.2. Above log()=10.2, the discrepancy between the two colors becomes larger towards higher .
Panel c) shows the (NUV)–(NUV) distributions. Note that we do not apply any internal extinction correction to both NUV and NUV. If there were no dust, (NUV)–(NUV) is a direct tracer of the sSFR discrepancy of the two regions. However, SFGs contain dust and dust attenuation has been shown to be a strong function of (Reddy et al., 2010; Whitaker et al., 2012, 2014). For this work, understanding the dust maps of galaxies will be helpful in interpreting the presented results. González Delgado et al. (2015) explore the 2-dimensional properties of 300 galaxies using the CALIFA IFS data. They find that the stacked profile shows a significant negative gradient in the innermost regions of galaxies. Beyond , the profile becomes flat. Nelson et al. (2015b) use the 3D-HST grism data to investigate the dust maps of SFGs at 1.4. They find that low mass SFGs have little dust attenuations at all radii. Above log()10.0, the dust attenuation has a significant negative gradient in the inner 1.0 kpc region. Beyond kpc, dust attenuation does not vary much. The findings of González Delgado et al. (2015) and Nelson et al. (2015b) indicate that in the galaxy scale, the dust attenuation is not a strong function of radius. A similar conclusion is also reached by Iglesias-Páramo et al. (2013). Given this, NUV might be only slightly dust-reddened than NUV.
An interesting feature presented in panel c) is that (NUV)–(NUV) all peaks at 0.25 mag for the log()¡10.2 SFGs. After accounting for dust correction, the intrinsic color discrepancy should be even smaller. This indicates that the central regions of low mass SFGs are still actively forming new stars. Above log()=10.2, the peaks of the distributions shift redward and show a dependence on . Since we have excluded the edge on SFGs to minimize dust effects on colors, a red central color strongly indicates an old bulge stellar population. Our result is broadly consistent with Nelson et al. (2015a), who find that the stacked sSFR profile of the SFGs is quite flat at log()10.0, whereas it exhibit a remarkable negative gradient for more massive galaxies (see their Figure 12). If the presence of old bulge components in massive SFGs is confirmed, it naturally explains the flattening of the SFR– relation of SFGs seen at the massive end towards low (Whitaker et al., 2014; Schreiber et al., 2015; Lee et al., 2015; Gavazzi et al., 2015). Our finding also provides a window to interpret the intrinsic scatter of the star formation main sequence (MS) of local SFGs. Recently, Guo et al. (2013) and Guo et al. (2015) find that the intrinsic scatter of the low-z MS increases with , which is not reported in other similar studies (e.g., Whitaker et al., 2012). In the context of this work, Guo et al’s findings seem to be more reasonable since many massive SFGs have been partly quenched (see Figure 5).
5.2. The dependence of NUV and NUV upon galaxy structure
Recent processes show that quiescence is well correlated with the presence of a dense galaxy inner structure (Bell et al., 2012; Cheung et al., 2012; Fang et al., 2013; Woo et al., 2015). Given this, it will be interesting to explore whether bulgy SFGs have already shown some signs of early quenching. Galaxy structure can be parameterized by the bulge-to-total ratio (), or Sérsic index . The petrosian concentration index, parameterized by , is also prevalently adopted in the early SDSS studies (Strateva et al., 2001; Kauffmann et al., 2003b; Brinchmann et al., 2004; Li et al., 2006). In the present work we do not attempt to investigate the dependence of our measured NUV color on all the mentioned structural parameters. We have assessed which structure parameter is best tracing the early quenching of SFGs. Assuming that the quenching processes of massive galaxies start from their central regions, we select a massive SFGs sample (which with log()¿10.5) to investigate the dependence of their inner stellar age indicator (.i.e., the central ) upon , and . We found that the central is most strongly dependent on (Pan et al. in prep). Thus in this section we only explore the dependence of NUV upon Sérsic index .
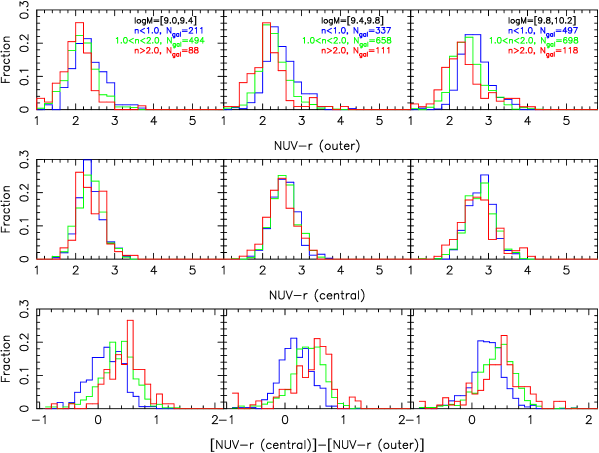
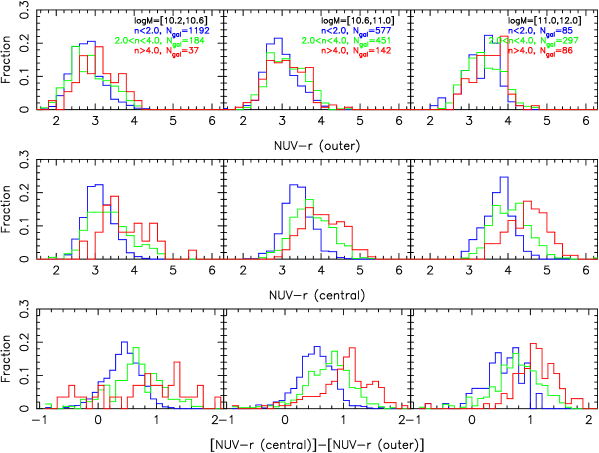
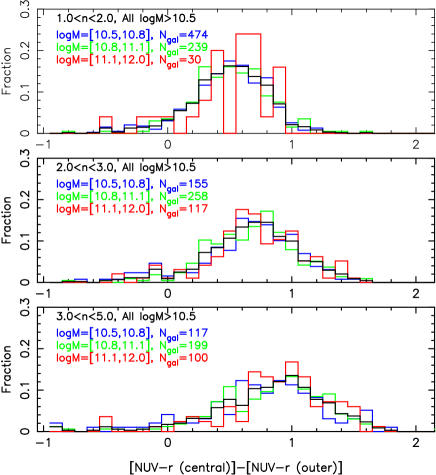
In Figure 6 and Figure 7, we show how NUV and NUV, as well as (NUV)–(NUV) depend on . Figure 6 shows the results for the log()¡10.2 SFGs. Galaxies are binned according to . In the mass regime of log()¡10.2, one can see that NUV is somewhat bluer for the high galaxies. In the middle panels, it is interesting that NUV seems largely independent of . Figure 7 shows the results of the log()¿10.2 galaxies. As can be seen, NUV is not strongly dependent on . However, NUV shows a strong dependence on , in the sense that the high galaxies have redder central colors.
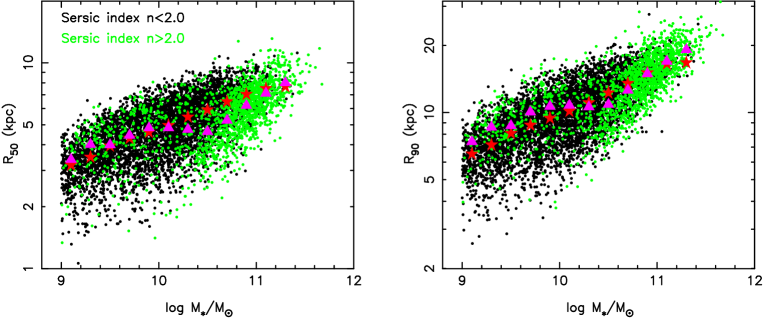
Understanding the meaning of is important in interpreting the results presented in Figure 6 and Figure 7. The Sérsic index describes the light/mass profile of a galaxy. Normally a high indicates a large . However, in a bulge+disk system, the best-fit will increase either by placing more light to the bulge, or by growing the disk extent at a fixed bulge size (see Lang et al. (2014) for a detailed discussion). In the former case, a high indicates a large bulge, while in the latter it indicates a very extended disk component. To distinguish between these two cases, we have investigated the – and – relations of the SFGs. The results are shown in Figure 8. We find that at log()¡10.2, those galaxies with ¿2.0 tend to have larger but similar compared to those with ¡2.0, i.e., the low mass, high SFGs tend to have a very extended disk component (at least for our sample). For SFGs with log()¿10.2, we find that the ¿2.0 galaxies tend to have smaller but similar than those with ¡2.0. This supports that massive high galaxies tend to contain a prominent bulge component.
Wang et al. (2011) find that a H i rich galaxy tend to have a larger and bluer outer disk than the mean. According to Figure 8 and Wang et al. (2011), it is not surprising to see that the low mass, high galaxies have relatively bluer NUV. In a recent work, Erfanianfar et al. (2016) also find that the low mass, high SFGs have higher SFR than the mean (see their Figure 9), for which they have gave no explanation. At the massive end, they also found a dependence of SFR on similar to ours. Whitaker et al. (2015) also suggest that the massive, high SFGs give rise to the flattened slope of the star formation main sequence at . In this work, our spatially-resolved NUV color enables a direct interpretation of the connections between star formation and in different mass regimes.
6. Discussion
6.1. Is the red NUV due to heavily dust obscuration?
The NUV color is a good proxy of sSFR. However, all color indices are more or less affected by the metallicity and dust of that galaxy. It is thus necessary to assess the impacts of metallicity and dust on our results. In Figure 5, we draw that nearly all galaxies have their NUV and NUV bellow 5.0. Over this range, NUV is mainly determined by sSFR (or stellar age), rather than metallicity (Kaviraj et al., 2007a, b). Thus metallicity should has a minor effect on our results. However, dust attenuation is known to be more serious towards the massive end. Are the results of Figure 5 and Figure 7 caused by heavily dust attenuation of massive SFGs?
To access the role of dust on our results, we explore the (NUV)–(NUV) distributions as a function of within the range of log()=. The results are presented in three fixed bins, as shown in Figure 9. It can be seen that when keeping fixed, the color discrepancy distribution shows a weak dependence on . However, when comparing the results between different bins, we find that these distributions show a clear dependence on , in the sense that high SFGs tend to have red (NUV)–(NUV) distributions. The insensitivity of (NUV)–(NUV) on is not expected if dust produces the results of Figure 5.
An additional supporting evidence comes from the uniformity of the (NUV)–(NUV) distributions bellow log()=10.2. Previous works support that the dust attenuation of SFGs (traced by ) has significantly increased from log()=9.0 to log()=10.2 (Whitaker et al., 2012; Guo et al., 2013; Whitaker et al., 2014). However, one draw from Figure 5 that the (NUV)–(NUV) distributions all peak around 0.25 and with a similar scatter for the log()¡10.2 SFGs, indicating that the (NUV)–(NUV) distribution is insensitive to the dust amount of SFGs. To conclude, we suggest that the red NUV colors of massive SFGs are owing to old bulge stellar populations, although the dust effect can not be fully ruled out. Future studies based on large IFS samples will shed more light on this topic.
6.2. bulge growth and star formation quenching
AGN feedback has long been served as a candidate mechanism of ceasing star formation in models (e.g., Croton et al., 2006; Hopkins et al., 2006; Somerville et al., 2008). Observationally, there have been growing evidences supporting this scenario (Schawinski et al., 2006; Page et al., 2012; Fabian, 2012; Maiolino et al., 2012; Barger et al., 2015). Recent progresses have confirmed the tight correlation between quiescence and the presence of a dense galaxy inner structure, whatever parameterized by (Bell et al., 2004; Driver et al., 2006; Bell et al., 2012; Cheung et al., 2012), by the inner 1 kpc stellar mass density (Cheung et al., 2012; Fang et al., 2013; Woo et al., 2015) or by bulge mass (Bluck et al., 2014; Lang et al., 2014). Given the tight correlations between black hole mass, bulge mass and , this observation supports the AGN feedback paradigm at a qualitative level. Figure 7 shows that massive, high SFGs indeed have relatively red NUV distributions, supporting that the star formation of bulge is at least partly controlled by the bulge-related process. However, this trend does not hold for the less massive galaxies (see Figure 6). Figure 6 thus suggests that the quenching picture of low mass SFGs is not the same as that of the massive ones. As already established, low mass galaxies are mainly quenched through environmental effects (Peng et al., 2010). In a dense environment, gas stripping will cause quenching first on galactic outskirts, especially for the low mass systems (Boselli & Gavazzi, 2014). The ”outside-in” quench mode of low mass galaxies has been recently confirmed by Pan et al. (2015).
Martig et al. (2009) propose the build up of a central bulge is sufficient to stabilize the surrounding gas disk from collapsing and forming new stars, which can cause quenching in a SFG without expelling/depleting its gas. In a recent work, Guo et al. (2015) find that the high SFGs have a larger intrinsic scatter in their disk sSFR, based on which they argued that the presence of a central bulge has a dramatically impact on the galaxy scale star formation. In this work, we show that the NUV of massive SFGs strongly depends on , whereas NUV does not (see Figure 7). This indicates that the disk star formation of a SFG is less affected by its inner structure. The ”morphological quenching” scenario is thus not supported by our data.
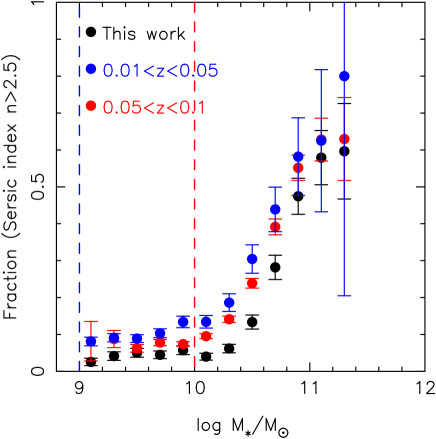
Recently, Abramson et al. (2014) suggest that a key part of ”mass quenching” is the build up of an inactive bulge component. This is supported by Figure 7 of this work. Given that many massive, bulgy SFGs have been partly quenched, it is important to investigate the contribution of the ”bulgy galaxies” to the whole SFG population. Figure 10 shows the fractions of ”bulgy SFGs” (with ¿2.5) as a function of . For our sample, one can see that the this fraction is around 10% at , while it rapidly increases to 60%– 70% at . A similar trend can be found in Fisher& Drory (2011) and Erfanianfar et al. (2016).
For comparison, we overplot the results of two SFGs samples drawn from and . We use similar SFG selection criteria but do not apply any cut to the comparison samples. It can be seen that the results of the two comparison samples are well consistent with each other. One can also see that the fractions derived from the SFGs sample of this work are obviously lower than those of the comparison samples, especially at the mass range of log()=[10.0,11.0]. We have checked the distributions of SFGs and confirmed that at fixed and , SFGs in the highest quartile have a smaller distribution than the mean, especially for the massive ones, i.e., our cut is biased against high SFGs. Accounting for the sample selection bias, the intrinsic (NUV)–(NUV) distributions should be even redder than those presented in Figure 5 at the massive end.
7. Summary
Aiming to resolve the sSFR of individual galaxies and to better understand how quenching process at its early phase, we measure the NUV colors both inside and outside the half-light radius for a sample of 6,324 face-on local SFGs. A very tight linear correlation is found between NUV and , supporting that NUV is a good photometric stellar age (or specific star formation rate) indicator, at least for these face-on SFGs. We investigate how these two colors depend on stellar mass and galaxy structure. Our findings are the following:
1. Bellow , the central NUV is on average only 0.25 mag redder than the outer NUV. The intrinsic value would be even smaller after accounting for dust correction; above , the central NUV becomes systematically much redder than the outer NUV for more massive galaxies.
2. Bellow , the central NUV shows no dependence on Sérsic index . However, above this mass, galaxies with a higher tend to be redder in the central NUV color. Our analysis suggests that the red central color presented in massive galaxies is owing to their old bulge stellar population.
Our findings thus suggest that the central regions of less massive SFGs are comparably active to the outer regions. In contrast, the bulge of a portion of massive galaxies, especially for those with a high , has been quenched. The presence of old bulges in massive galaxies naturally explains the flattened slope of the SFR– relation seen at the massive end. Our findings also provide a direct interpretation of the intrinsic scatter of the star formation main sequence.
References
- Abramson et al. (2014) Abramson K., et al., 2014, ApJ, 785L, 36A
- Aihara et al. (2011) Aihara, H., Allende Prieto, C., An, D., et al. 2011, ApJS, 193, 29
- Bacon et al. (2001) Bacon, R., Copin, Y., Monnet, G., et al. 2001, MNRAS, 326, 23
- Barger et al. (2015) Barger, A. J., Cowie, L. L., Owen, F. N., et al. 2015, ApJ, 801, 87
- Bell et al. (2004) Bell, E. F., McIntosh, D. H., Barden, M., et al. 2004, ApJ, 600, L11
- Bell et al. (2012) Bell, E. F., van der Wel, A., Papovich, C., et al. 2012, ApJ, 753, 167
- Bershady et al. (2010) Bershady, M. A., Verheijen, M. A. W., Swaters, R. A., et al. 2010, ApJ, 716, 198
- Bertin& Arnouts (1996) Bertin, E., & Arnouts, S. 1996, A&AS, 117, 393
- Bernardi et al. (2011a) Bernardi, M., Roche, N., Shankar, F., & Sheth, R. K. 2011, MNRAS, 412, L6
- Bernardi et al. (2011b) Bernardi, M., Roche, N., Shankar, F., & Sheth, R. K. 2011, MNRAS, 412, 684
- Boselli & Gavazzi (2006) Boselli, A., & Gavazzi, G. 2006, PASP, 118, 517
- Bluck et al. (2014) Bluck, A. F. L., Mendel, J. T., Ellison, S. L., et al. 2014, MNRAS, 441, 599
- Brinchmann et al. (2004) Brinchmann, J., Charlot, S., White, S. D. M., et al. 2004, MNRAS, 351, 1151
- Bundy et al. (2009) Bundy, K., Fukugita, M., Ellis, R. S., et al. 2009, ApJ, 697, 1369
- Bundy et al. (2015) Bundy, K., Bershady, M. A., Law, D. R., et al. 2015, ApJ, 798, 7
- Boselli & Gavazzi (2014) Boselli, A., & Gavazzi, G. 2014, A&A Rev., 22, 74
- Cattaneo et al. (2006) Cattaneo, A., Dekel, A., Devriendt, J., Guiderdoni, B., & Blaizot, J. 2006, MNRAS, 370, 1651
- Chang et al. (2015) Chang, Y.-Y., van der Wel, A., da Cunha, E., & Rix, H.-W. 2015, ApJS, 219, 8
- Cardelli, Clayton & Mathis (1989) Cardelli, J. A., Clayton, G. C., Mathis, J, S., 1989, ApJ, 345, 245
- Cheung et al. (2012) Cheung, E, Faber, S., Koo, D., et al. 2012, ApJ, 760, 131
- Cid Fernandes et al. (2013) Cid Fernandes, R., Pérez, E., García Benito, R., et al. 2013, A&A, 557, 86
- Croom et al. (2012) Croom, S. M., Lawrence, J. S., Bland-Hawthorn, J., et al. 2012, MNRAS, 421, 872
- Croton et al. (2006) Croton, D. J., Springel, V., White, S. D. M., et al. 2006, MNRAS, 365, 11
- Dekel& Birnboim (2006) Dekel, A., & Birnboim, Y. 2006, MNRAS, 368, 2
- de Jong (1996) de Jong, R. S. 1996, A&A, 313, 377
- Driver et al. (2006) Driver, S. P., Allen, P. D., Graham, A. W., et al. 2006, MNRAS, 368, 414
- Erfanianfar et al. (2016) Erfanianfar, G., Popesso, P., Finoguenov, A., et al. 2016, MNRAS, 455, 2839
- Fang et al. (2013) Fang, J. J., Faber, S. M., Koo, D. C., & Dekel, A. 2013, ApJ, 776, 63
- Fabian (2012) Fabian, A. C. 2012, ARA&A, 50, 455
- Fisher& Drory (2011) Fisher, D. B., & Drory, N. 2011, ApJ, 733, L47
- Gavazzi et al. (2015) Gavazzi, G., Consolandi, G., Dotti, M., et al. 2015, A&A, 580, A116
- González Delgado et al. (2015) González Delgado, R. M., García-Benito, R., Pérez, E., et al. 2015, A&A, 581, A103
- González Delgado et al. (2014) González Delgado, R. M., Pérez, E., Cid Fernandes, R., et al. 2014, A&A, 562, A47
- Gunn & Gott (1972) Gunn, J. E., & Gott, J. R., III 1972, ApJ, 176, 1
- Guo et al. (2013) Guo, K., Zheng, X. Z., & Fu, H. 2013, ApJ, 778, 23
- Guo et al. (2015) Guo, K., Zheng, X. Z., Wang, T., & Fu, H. 2015, ApJ, 808, L49
- Hopkins et al. (2006) Hopkins, P. F., Hernquist, L., Cox, T. J., et al. 2006, ApJS, 163, 1
- Hopkins et al. (2010) Hopkins, P. F., Bundy, K., Hernquist, L., Wuyts, S., & Cox, T. J. 2010, MNRAS, 401, 1099
- Heckman et al. (2004) Heckman, T. M., Kauffmann, G., Brinchmann, J., et al. 2004, ApJ, 613, 109
- Iglesias-Páramo et al. (2013) Iglesias-Páramo, J., Vílchez, J. M., Galbany, L., et al. 2013, A&A, 553, L7
- Kaviraj et al. (2007a) Kaviraj, S., Rey, S.-C., Rich, R. M., Yoon, S.-J., & Yi, S. K. 2007a, MNRAS, 381, L74
- Kaviraj et al. (2007b) Kaviraj, S., Schawinski, K., Devriendt, J. E. G., et al. 2007b, ApJS, 173, 619
- Karim et al. (2011) Karim, A., Schinnerer, E., Martínez-Sansigre, A., et al. 2011, ApJ, 730, 61
- Kauffmann et al. (2003a) Kauffmann G., White S. D. M., Heckman T. M. et al., 2003a, MNRAS, 341, 54
- Kauffmann et al. (2003b) Kauffmann, G., Heckman, T. M., White, S. D. M., et al. 2003b, MNRAS, 341, 33
- Kennicutt (1998) Kennicutt, R. C., Jr. 1998, ARA&A, 36, 189
- Knobel et al. (2015) Knobel, C., Lilly, S. J., Woo, J., & Kovač, K. 2015, ApJ, 800, 24
- Kroupa (2001) Kroupa, P. 2001, MNRAS, 322, 231
- Kormendy et al. (2009) Kormendy, J., Fisher, D. B., Cornell, M. E., & Bender, R. 2009, ApJS, 182, 216
- Kormendy& Bender (2013) Kormendy, J., & Bender, R. 2013, ApJ, 769, L5
- Lang et al. (2014) Lang, P., Wuyts, S., Somerville, R. S., et al. 2014, ApJ, 788, 11
- Lee et al. (2015) Lee, N., Sanders, D. B., Casey, C. M., et al. 2015, ApJ, 801, 80
- Li et al. (2006) Li, C., Kauffmann, G., Jing, Y. P., et al. 2006, MNRAS, 368, 21
- Li et al. (2015) Li, C., Wang, E., Lin, L., et al. 2015, ApJ, 804, 125
- Lin et al. (2013) Lin, L., Zou, H., Kong, X., et al. 2013, ApJ, 769, 127
- Kong et al. (2000) Kong, X., Zhou, X., Chen, J., et al. 2000, AJ, 119, 2745
- Kovač et al. (2014) Kovač, K., Lilly, S. J., Knobel, C., et al. 2014, MNRAS, 438, 717
- Maiolino et al. (2012) Maiolino, R., Gallerani, S., Neri, R., et al. 2012, MNRAS, 425, L66
- Martin et al. (2005) Martin, D. C., Fanson, J., Schiminovich, D., et al. 2005, ApJ, 619, L1
- Martig et al. (2009) Martig, M., Bournaud, F., Teyssier, R., & Dekel, A. 2009, ApJ, 707, 250
- Mendez et al. (2011) Mendez, A. J., Coil, A. L., Lotz, J., et al. 2011, ApJ, 736, 110
- Moore et al. (1996) Moore, B., Katz, N., Lake, G., Dressler, A., & Oemler, A. 1996, Nature, 379, 613
- Muñoz-Mateos et al. (2007) Muñoz-Mateos, J. C., Gil de Paz, A., Boissier, S., et al. 2007, ApJ, 658, 1006
- Naab et al. (2007) Naab, T., Johansson, P. H., Ostriker, J. P., & Efstathiou, G. 2007, ApJ, 658, 710
- Nelson et al. (2015a) Nelson, E. J., van Dokkum, P. G., Förster Schreiber, N. M., et al. 2015a, arXiv:1507.03999
- Nelson et al. (2015b) Nelson, E. J., van Dokkum, P. G., Momcheva, I. G., et al. 2015b, arXiv:1511.04443
- Omand et al. (2014) Omand, C. M. B., Balogh, M. L., & Poggianti, B. M. 2014, MNRAS, 440, 843
- Page et al. (2012) Page, M. J., Symeonidis, M., Vieira, J. D., et al. 2012, Nature, 485, 213
- Pan et al. (2013) Pan, Z. Z.,Kong, X & Fan, L , 2013, ApJ, 776, 14
- Pan et al. (2014) Pan, Z., Li, J., Lin, W., Wang, J., & Kong, X. 2014, ApJ, 792, L4
- Pan et al. (2015) Pan, Z., Li, J., Lin, W., et al. 2015, ApJ, 804, L42
- Peng et al. (2010) Peng Y. J., et al., 2010, ApJ, 721, 193
- Pérez et al. (2013) Pérez, E., Cid Fernandes, R., González Delgado, R. M., et al. 2013, ApJ, 764, L1
- Quadri et al. (2012) Quadri, R. F., Williams, R. J., Franx, M., & Hildebrandt, H. 2012, ApJ, 744, 88
- Reddy et al. (2010) Reddy, N. A., Erb, D. K., Pettini, M., Steidel, C. C., & Shapley, A. E. 2010, ApJ, 712, 1070
- Salim et al. (2005) Salim, S., Charlot, S., Rich, R. M., et al. 2005, ApJ, 619, L39
- Salim (2014) Salim, S. 2014, Serbian Astronomical Journal, 189, 1
- Sánchez et al. (2012) Sánchez, S. F., Kennicutt, R. C., Gil de Paz, A., et al. 2012, A&A, 538, 8
- Schlegel, Finkbeiner & Davis (1998) Schlegel, D. J., Finkbeiner, D. P., & Davis, M., 1998, ApJ, 500, 525S
- Schawinski et al. (2006) Schawinski, K., Khochfar, S., Kaviraj, S., et al. 2006, Nature, 442, 888
- Schawinski et al. (2010) Schawinski, K., Urry, C. M., Virani, S., et al. 2010, ApJ, 711, 284
- Schawinski et al. (2014) Schawinski, K., Urry, C. M., Simmons, B. D., et al. 2014, MNRAS, 440, 889
- Schreiber et al. (2015) Schreiber, C., Pannella, M., Elbaz, D., et al. 2015, A&A, 575, A74
- Simard et al. (2011) Simard, L., Mendel, J. T., Patton, D. R., Ellison, S. L., & McConnachie, A. W. 2011, ApJS, 196, 11
- Somerville et al. (2008) Somerville, R. S., Hopkins, P. F., Cox, T. J., Robertson, B. E., & Hernquist, L. 2008, MNRAS, 391, 481
- Strateva et al. (2001) Strateva, I., Ivezić, Ž., Knapp, G. R., et al. 2001, AJ, 122, 1861
- Suh et al. (2010) Suh, H., Jeong, H., Oh, K., et al. 2010, ApJS, 187, 374
- Tal et al. (2009) Tal, T., van Dokkum, P. G., Nelan, J., & Bezanson, R. 2009, AJ, 138, 1417
- Toomre& Toomre (1972) Toomre, A., & Toomre, J. 1972, ApJ, 178, 623
- van Dokkum (2005) van Dokkum, P. G. 2005, AJ, 130, 2647
- Wang et al. (2010) Wang, J., Overzier, R., Kauffmann, G., von der Linden, A., & Kong, X. 2010, MNRAS, 401, 433
- Wang et al. (2011) Wang, J., Kauffmann, G., Overzier, R., et al. 2011, MNRAS, 412, 1081
- Weinmann et al. (2009) Weinmann, S. M., Kauffmann, G., van den Bosch, F. C., et al. 2009, MNRAS, 394, 1213
- Williams et al. (2009) Williams, R. J., Quadri, R. F., Franx, M., van Dokkum, P., & Labbé, I. 2009, ApJ, 691, 1879
- Whitaker et al. (2012) Whitaker, K. E., van Dokkum, P. G., Brammer, G., & Franx, M. 2012, ApJ, 754, L29
- Whitaker et al. (2014) Whitaker, K. E., Franx, M., Leja, J., et al. 2014, ApJ, 795, 104
- Whitaker et al. (2015) Whitaker, K. E., Franx, M., Bezanson, R., et al. 2015, ApJ, 811, L12
- Woo et al. (2013) Woo, J., Dekel, A., Faber, S. M., et al. 2013, MNRAS, 428, 3306
- Woo et al. (2015) Woo, J., Dekel, A., Faber, S. M., & Koo, D. C. 2015, MNRAS, 448, 237
- York et al. (2000) York D. G, et al., 2000, AJ, 120, 1579