SMA Observations of the Extended 12CO(J=6–5) Emission in the Starburst Galaxy NGC 253
Abstract
We present observations of the 12CO(J=6–5) line and 686 GHz continuum emission in NGC 253 with the Submillimeter Array at an angular resolution of 4′′. The 12CO(J=6–5) emission is clearly detected along the disk and follows the distribution of the lower 12CO line transitions with little variations of the line ratios. A large-velocity gradient analysis suggests a two-temperature model of the molecular gas in the disk, likely dominated by a combination of low-velocity shocks and the disk wide PDRs. Only marginal 12CO(J=6–5) emission is detected in the vicinity of the expanding shells at the eastern and western edges of the disk. While the eastern shell contains gas even warmer (T300 K) than the hot gas component (Tkin=300 K) of the disk, the western shell is surrounded by gas much cooler (Tkin=60 K) than the eastern shell but somewhat hotter than the cold gas component of the disk (for similar H2 and CO column densities), indicative of different (or differently efficient) heating mechansisms. The continuum emission at 686 GHz in the disk agrees well in shape and size with that at lower (sub-)millimeter frequencies, exhibiting a spectral index consistent with thermal dust emission. We find dust temperatures of 10-30 K and largely optically thin emission. However, our fits suggest a second (more optically thick) dust component at higher temperatures (T K), similar to the molecular gas. We estimate a global dust mass of 106 M⊙ for the disk translating into a gas-to-dust mass ratio of a few hundred consistent with other nearby active galaxies.
Subject headings:
galaxies: individual(NGC 253) – Galaxies: active – galaxies: ISM – galaxies: starburst – submillimeter: galaxies – galaxies: emission lines2
| Line | Frequency | Date | rmsa | v | Beamb | Typec | Refd |
|---|---|---|---|---|---|---|---|
| (GHz) | (mm/yyyy) | (mJy) | (km s-1) | () | |||
| 12CO(J=6–5) | 691.473 (USB) | 09/2007 | 7000 | 12 | 4221 | M | (1) |
| 12CO(J=3–2)e | 345.796 (LSB) | 09/2007 | 100 | 12 | 5845 | M | (1) |
| 12CO(J=3–2)e | 345.796 (LSB) | 09/2004 | 130 | 12 | 3919 | M | (2) |
| 12CO(J=2–1)f | 230.538 (LSB,USB) | 2003-2005 | 30 | 12 | 1715 | SF | (2) |
| 12CO(J=1–0) | 115.271 (USB) | 2011 | 4 | 12 | 3727 | M | (3) |
1. Introduction
Submillimeter interferometric observations at frequencies above 400 GHz are technically difficult and rely on very dry atmospheric conditions. The reduced transmissivity of the atmosphere at submm wavelengths necessitates observing from a vantage point at high elevation (4000 m above sea level). Before the advent of the Atacama Large Millimeter Array (ALMA), the only interferometer in the world offering the capability of observations at frequencies above 400 GHz was the Submillimeter Array (SMA) located at 4000 m altitude on Mauna Kea in Hawaii, USA. Equipped with 8 antennas of 6 m diameter and 690 GHz receivers, the SMA provides a window on warm and hot molecular gas and dust through the 12CO(J=6–5) line and submillimeter continuum emission with high angular resolution. The analysis of spatially resolved warm molecular gas provides essential information to understand the complexity of the excitation conditions, chemistry and dynamics of the molecular gas in various environments, including star-forming regions, active galactic nuclei (AGN) and quiescent regions (e.g., Aladro et al., 2011; Krips et al., 2011, 2008; Martín et al., 2006). Moreover, given the explosion of detections of molecular gas at high redshifts in the past decade, mostly through high rotational levels of CO, it is essential to have a robust understanding of the physics behind the CO ladder as a function of the energetic environments in which they are detected (e.g., Rosenberg et al., 2014; Papadopoulos et al., 2010, 2007; Weiß et al., 2005; Carilli et al., 2002). To date, only a handful of journal publications exist based on 690 GHz interferometric observations, most of which study galactic sources (e.g. Zapata et al., 2013; Rolffs et al., 2011; Matsushita et al., 2009; Nakashima et al., 2007; Qi et al., 2006; Beuther et al., 2006). Matsushita et al. (2009) present the first 690 GHz interferometric study of 12CO(J=6–5) emission in a nearby extragalactic source, the ultra-luminous infrared galaxy Arp 220. Since then, mostly thanks to ALMA but also the SMA, a couple of interferometric observations of the 12CO(J=6–5) emission in nearby galaxies have been very recently published (e.g., García-Burillo et al., 2014; Xu et al., 2014; Sliwa et al., 2013). In this paper, we present the first mosaic observations at 690 GHz of the nearby starburst galaxy NGC 253, made using the SMA.
NGC 253 is one of the best studied nearby (3.5 Mpc, where 1′′=17 pc; Rekola et al., 2005; Mouhcine et al., 2005) infrared bright starburst galaxies (31010L⊙; Telesco & Harper, 1980). It is thus an ideal prototype to study the effects of a central starburst (2-4M⊙ yr-1; Minh et al., 2007; Ott et al., 2005; Bendo et al., 2015) on the dynamics (NGC 253 is a edge-on galaxy), excitation conditions and chemistry of the surrounding molecular gas (e.g., Leroy et al., 2015; Meier et al., 2015; Bolatto et al., 2013; Sakamoto et al., 2011, 2006; Knudsen et al., 2007; Martín et al., 2006; Bradford et al., 2003). As a consequence of the starburst in the center of NGC 253, a high rate of supernova explosions (0.2 yr-1) has been observed (see Rampadarath et al., 2014; Paglione & Abrahams, 2012). These are most likely responsible for a kiloparsec-scale outflow perpendicular to the disk (e.g., Fabbiano & Trinchierie, 1984; Heckman et al., 1990). In addition to this outflow, Sakamoto et al. (2006) report on at least two expanding shells, or superbubbles, at the edges of the disk (named SB1 for the south-western shell and SB2 for the north-eastern one) that might be either caused by winds from and/or supernovae in a super star cluster or a hypernova(e); the possibility of a third shell, a bit more southern to SB2, was discussed as well. The authors further find a strongly disturbed molecular gas disk associated with young stellar clusters and stellar explosions as well as the large-scale super-wind. Their follow-up observations at 1 resolutions confirmed the SB2 (and the third shell) but SB1 was reported to be more complicated than appeared in previous lower-resolution data Sakamoto et al. (2011). They noted that it may be a shell in a complicated shape or other gas kinematical feature that looks like a shell at low resolution. With very recent ALMA observations of 12CO(J=1–0) at 3 resolution Bolatto et al. (2013) reported four shells in the central kpc of NGC 253. One is SB2 and three are clustered in/around the region of SB1. While SB2 can be connected to a compact stellar cluster, SB1 is found at the position of a compact radio continuum source that is associated with a supernova remnant (see Sakamoto et al., 2006; Bolatto et al., 2013). The nature of shells 2 and 4 remain unclear at this point, whether they are separate bubbles or connected to the stellar winds or other dynamical features.
A 2 mm line survey of NGC 253 done by Martín et al. (2006) reveals an impressive chemical richness and complexity in its center (see also Meier et al., 2015). NGC253 appears to resemble SgrB2, the region of molecular cloud complexes in the Galactic center, more than the evolved starburst galaxy M82 (see also Aladro et al., 2011) despite the fact that our Milky Way is not a starburst galaxy at all. Moreover, Sakamoto et al. (2011) find a striking resemblance between the molecular gas distribution of the Milky Way and that of NGC 253. The chemistry of the molecular gas in the central kpc of NGC 253 appears to be dominated by large-scale, low velocity shocks (e.g., Martín et al., 2006; García-Burillo et al., 2000). However, Martín et al. (2009) detect significant amounts of molecular tracers for photodissociation regions (PDRs) suggesting PDR chemistry also plays a significant role in this starburst galaxy. This is further supported by Rosenberg et al. (2012) and Rosenberg et al. (2014). The NIR H2 emission appears to be mostly fluorescently excited favoring PDRs as the dominant excitation mechanism in the nuclear region of NGC 253. The only exceptions seem to be three small isolated regions in which shocks may play the leading role. Rosenberg et al. (2012) estimate that at most 30% of the H2 emission is excited by shocks. Based on a 12CO and 13CO ladder analysis from Herschel and ground-based single-dish observations with a (normalised) beam of 32.5, Rosenberg et al. (2014) present even more evidence for the combined contribution of PDR and mechanical heating of the molecular gas in the central disk of NGC 253. They also argue that heating by cosmic rays can be mostly neglected; at most a few percent could be attributed to cosmic ray heating in their models.
2. Observations
First, we will present some general information on the SMA observations conducted for this paper. We will then briefly discuss previous 12CO(J=3–2) SMA observations that were eventually used to merge with the 12CO(J=3–2) observations carried out simultaneously with 12CO(J=6–5). We will give additional information on previous 12CO(J=2–1) SMA observations. These observations were taken from Sakamoto et al. (2011) and Sakamoto et al. (2006). New 12CO(J=1–0) ALMA observations of NGC 253 are also included in this study and are hence briefly presented as well. We will address the problem of missing short spacings and the significance of spatial filtering to our observations in Section 2.4. All data presented in this paper stem from mosaic observations (except the 12CO(J=2–1) data) and have hence been corrected for the respective primary beams.
| Line | max,a | FWHMmax,a | b | |
|---|---|---|---|---|
| 12CO | (Jy) | (km s-1) | (km s-1) | (Jy km s-1) |
| J=6–5 | 35015 | 03 | 1307 | (583)103 |
| J=3–2 | 3473 | 01 | 1407 | (752)103 |
| J=2–1 | 1112 | 01 | 1678 | (290.3)103 |
| J=1–0 | 301 | 01 | 1658 | (7.80.1)103 |
| Cont. | b | |||
| (Jy) | ||||
| 686 GHz | 321.4 | |||
| 350 GHz | 2.60.1 | |||
| 220 GHz | 0.670.05 | |||
| 115 GHz | 0.260.01 |
2.1. SMA observations of 12CO(J=6–5) and 12CO(J=3–2)
NGC 253 was observed using two receivers simultaneously to obtain 12CO(J=6–5), 12CO(J=3–2) and HCO+(J=4–3)111Further analysis of the HCO+(J=4–3) data may be presented separately, while this paper is concerned only with the 12CO transitions with the SMA. At the time of the observations, five of the eight SMA antennas were equipped with working 690 GHz receivers. All five antennas were placed in the inner ring of the array, known as the sub-compact configuration, with baselines ranging from a few (8 meters) up to 25 meters to allow for a good (u,v) coverage and reasonable angular resolution at 690 GHz. To cover most of the CO emission in NGC 253, a five-field mosaic (size50′′) along the plane of the disk was observed with a spacing of half the primary beam size (7.5′′) at 690 GHz between the pointing centers. The phase reference center of the central pointing was set to =00h47m33241 and =25∘17′1816. Considering the small primary beam of 15′′ at 690 GHz and thus the increased need for accurate pointing, regular pointing offset updates (i.e., every 3 h) were conducted on either 3C454.3 or 3C111 (using interferometry) or Jupiter (using single-dish measurements) throughout the night at 345 GHz. All spectral windows covered 2GHz in bandwidth, and the lower sideband (LSB) of the lower frequency was tuned to the 12CO(J=3–2) line so that the HCO+(J=4–3) line fell into the corresponding upper side band (USB), situated 10 GHz above the LSB. The USB of the 690 GHz receivers were tuned to the 12CO(J=6–5) line leaving the corresponding LSB for continuum measurements. The weather was excellent with a 225 GHz atmospheric opacity of 0.05-0.1 throughout the track. This corresponds to single sideband (SSB) system temperatures of Tsys(SSB)=5000-10000 K at 690 GHz and Tsys(SSB)=400-800 K at 345 GHz. We used the nearby (20∘ from NGC 253) planet Uranus as bandpass, gain and absolute flux calibrator. The calibration on Uranus was performed using a disk model to compensate for the fact that it was slightly resolved. The quality of the gain calibration was verified against a nearby quasar (J2348-1631) which was observed with the same cycle times as Uranus. It appears to be of symmetric Gaussian shape at both frequencies but slightly shifted (0.8′′) in Declination from its phase center at 690 GHz while being centered correctly at 345 GHz after applying the gain calibration. The spatial shift at 690 GHz indicates a problem with the phase transfer at 690 GHz, probably due to uncertainties in the measured baseline and/or larger distance of NGC 253 to the phase calibrator; the baseline error is around 0.3 at 690 GHz. We hence consider this effect as a systematic instrumental and calibrational artifact and correct the data for this 0.8′′ shift. A similar positional shift was found for the 690 GHz SMA observations of Arp 220 that was also attributed to baseline errors by Matsushita et al. (2009). The accuracy of the flux calibration is estimated to be within 30% at 690 GHz and 20% at 345 GHz.
Angular resolutions of 4221 at position angle PA=162∘ are obtained at 690 GHz and of 5842 at PA=173∘ at 345 GHz. We reach an rms noise level of 1=100 mJy beam-1 channel-1 at 345 GHz and of 1=7 Jy beam-1 channel-1 at 691 GHz per individual mosaic field and for a spectral resolution of 12 km s-1. Note that we used a Nyquist sampling to place the mosaic fields based on the 690 GHz field of view so that in the combined mosaic maps at 690 GHz the noise distribution is not homogeneous and will increase toward the edges and be a factor of smaller in the overlap regions; the mosaic fields at 345 GHz will, however, overlap by a much larger fraction so that the noise distribution is much more homogeneous there. The latter fact has been taken into account in our estimate of the 1 levels for each figure (see their captions). A log of the observations is given in Table 1.
We subtracted the strong continuum emission found in NGC253, averaged over all line-free channels in each sideband, from the original data cubes to generate pure line emission data.
2.2. Previous SMA observations of 12CO(J=3–2) and 12CO(J=2–1)
In order to enable a direct comparison between the 12CO(J=6–5) emission and the lower-J CO emission and reduce systematic biases such as resolution effects due to different synthesized beams and uv-coverages, we merged our 12CO(J=3–2) data with the high spectral resolution data at 345 GHz presented by Sakamoto et al. (2011). In the merged 12CO(J=3–2) data set we then reach an rms noise level of 1=80 mJy beam-1 channel-1 per mosaic field or 60 mJy beam-1 channel-1 in the center of the mosaic for a spectral resolution of 12 km s-1. We also included the 12CO(J=2–1) data by Sakamoto et al. (2011) and Sakamoto et al. (2006) which is already a combination of low and high spatial resolution observations; the rms is found to be 25 mJy beam-1 channel-1 (using only a single field) at a spectral resolution of 12 km s-1. In order to match the resolution of 12CO(J=3–2) and 12CO(J=2–1) to that of 12CO(J=6–5), we used a uv-taper, obtaining an angular resolution of 4221. We did not find significant differences with this method compared to matching222i.e., restricting the uv-coverages to the overlapping regions the uv-coverages of the 12CO(J=3–2) and 12CO(J=2–1) data to that of 12CO(J=6–5). In order to preserve the data in its entirety, we hence chose the first method.
2.3. ALMA observations of 12CO(J=1–0)
ALMA cycle 0 observations are available for the 12CO(J=1–0) line from the ALMA science archive, that were done in the compact configuration with up to 19 antennas (project id: 2011.0.00172.S; see also Bolatto et al. (2013)). The 12CO(J=1–0) line was tuned to the USB within a 2 GHz large spectral window using a spectral resolution of 488 kHz (1.3 km s-1). Uranus was used as absolute flux calibrator, J2333-237 as a bandpass calibrator and J0137-245 as phase and amplitude calibrator. Using the strong continuum emission, self-calibration was applied to the phases to improve the image quality of the continuum and line maps. Given the excellent uv-coverage, we used a slight uv-taper to smooth the initial spatial resolution to the angular resolution of our 12CO(J=6–5) observations. Data reduction was done using CASA but further image processing was done in GILDAS. As with the other datasets, the continuum was derived from the line free channels and then subsequently subtracted from the channels containing both line and continuum emission.
2.4. Effects of Spatial Filtering
In order to assess the lack of short spacings and hence missing flux, we have compared our observations with existing single dish observations. Bayet et al. (2004) have observed the 12CO(J=6–5) emission in NGC 253 using the Caltech Submillimeter Observatory (CSO). In the central 10.5′′, they obtain an integrated intensity of 1394279 K km s-1, which corresponds to (5500011000) Jy km s-1 assuming a conversion factor of S/T39 Jy/K. The SMA observations yield an integrated line intensity of 45000 Jy km s-1 in the central 10.5′′, a bit less than that from the single-dish observations but still within the large uncertainties (20-30%) in both measurements. For the 12CO(J=3–2) line emission, we find integrated line intensities of 45000 Jy km s-1 in the central 20′′ very similar to those obtained from the single-dish measurements in the same area discussed in Bayet et al. (2004). Hence, the SMA observations did not resolve out significant emission from the 12CO(J=3–2) and 12CO(J=6–5) lines (at least within the central 10-20′′)333Note that no single-dish observations exist to cover the entire area of the 5-point mosaic observations conducted for this paper. The estimates of resolution effects are hence only for the central disk not covering the two outer shells.
The 12CO(J=1–0) was observed by Houghton et al. (1997) using the SEST telescope. They derive an integrated intensity of 377 K km s-1 in the central 30′′ of NGC 253. Using a conversion factor of S/Tmb=19 Jy/K, this translates into 7100 Jy km s-1. We find 7000 Jy km s-1 in the central 30′′ as well, indicating that no flux has been resolved out with ALMA, at least in the center of NGC 253.
3. Results & Discussion
3.1. Continuum Emission
| ID | 686 GHza | 350 GHza | 220 GHza | 115 GHza |
|---|---|---|---|---|
| (mJy b-1) | (mJy b-1) | (mJy b-1) | (mJy b-1) | |
| L2 | 1700400 | 1146 | 332 | 30.15 |
| L4 | 4000400 | 3266 | 1152 | 280.15 |
| L5 | 5800400 | 4746 | 1662 | 810.15 |
| L6 | 5900400 | 4566 | 1212 | 400.15 |
| L7 | 2900400 | 3306 | 0762 | 140.15 |
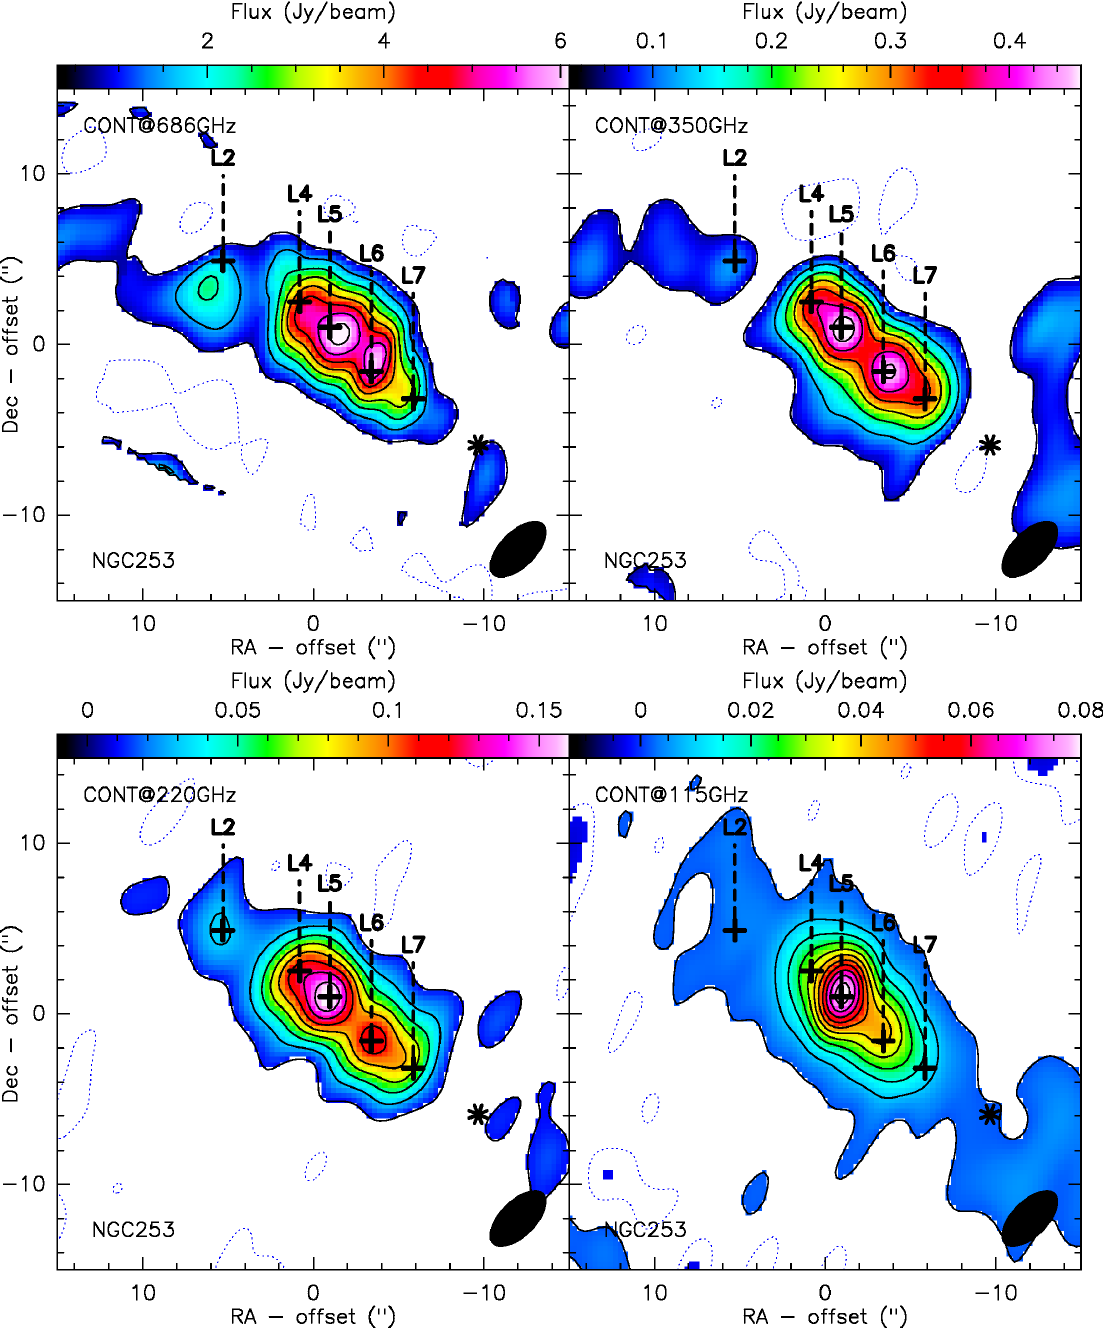
In our new SMA observations, continuum emission has been detected at 345 GHz (LSB), 355 GHz (USB), 681 GHz (LSB) and 691 GHz (USB) and is consistent between the two sidebands acounting for the frequency difference of 10 GHz between the sidebands. The upper left panel of Fig. 1 shows the sideband-averaged continuum emission at 686 GHz, the upper right panel shows 350 GHz (merged with the data from Sakamoto et al. (2011)), the lower left panel that of 220 GHz and the lower right panel that of 115 GHz. As mentioned before, all four continuum images were made with the same angular resolution. The distribution of the continuum emission is fairly similar amongst the four frequencies. The 686 GHz emission shows the same peaks as previously identified by Sakamoto et al. (2011) at higher angular resolution, marked with black crosses in Fig. 1. We labelled them L2 to L7 in this paper to facilitate a comparison to the line emission as the continuum peaks agree well in position with the corresponding line peaks (see definitions in Fig. 4). L5 and L6 appear to be slightly closer together at 686 GHz than at the lower frequencies and L2 is somewhat offset in Declination, i.e., 2′′ (half the synthesized beam), at 686GHz than at the lower frequencies. This discrepancy is larger than the uncertainties in the absolute and relative positions of the peaks and might suggest a region of warmer dust close to L2. Indeed, Bradford et al. (2003) identified an overabundance of 12CO(J=7–6) in the same region as well. The brightnesses of the different peaks, and their respective ratios to each other are very similar along the five continuum peaks, with L5 being the strongest, followed by L6, L4, L7 and L2.
| Bluest Gaussian Line | Central Gaussian Line | Reddest Gaussian Line | |||||||||||
|---|---|---|---|---|---|---|---|---|---|---|---|---|---|
| ID | S | I | v | S | I | v | S | I | v | (I) | |||
| (1) | (2) | (3) | (4) | (5) | (6) | (7) | (8) | (9) | (10) | (11) | (12) | (13) | (14) |
| 12CO(J=6–5) | |||||||||||||
| L0 | – | – | – | – | 5.0 | 426 | -97 | 80 | 12.3 2.8 | 1699 406 | -26 | 130 | 1699 406 |
| L1 | – | – | – | – | 6.1 2.3 | 846 324 | -102 | 130 | 26.6 2.6 | 2860 398 | -40 | 101 | 3706 513 |
| L2 | 5.00 | 346 | -152 | 65 | 35.2 1.8 | 3937 424 | -64 | 105 | 15.7 1.9 | 1402 240 | 38 | 84 | 5339 487 |
| L3 | 5.00 | 378 | -129 | 71 | 27.5 2.7 | 4218 511 | -50 | 144 | 5.0 2.6 | 663 350 | 32 | 124 | 4881 619 |
| L4 | 5.00 | 266 | -110 | 50 | 32.0 2.5 | 4767 509 | -52 | 140 | 22.9 2.4 | 2684 376 | 40 | 110 | 7451 633 |
| L5 | 5.00 | 266 | -120 | 50 | 15.8 2.6 | 1377 283 | -81 | 82 | 41.7 1.7 | 5327 496 | 22 | 120 | 6704 571 |
| L6 | 5.00 | 160 | -91 | 30 | 48.2 2.4 | 4618 564 | 6 | 90 | 14.6 2.7 | 1165 264 | 95 | 75 | 5783 623 |
| L7 | – | – | – | – | 25.6 2.2 | 2450 342 | 12 | 90 | 5.0 | 426 | 112 | 80 | 2450 342 |
| L8 | 5.00 | 378 | -26 | 71 | 5.4 2.0 | 420 166 | 50 | 73 | 5.0 | 415 | 126 | 78 | 420 166 |
| 12CO(J=3–2) | |||||||||||||
| L0 | – | – | – | – | 2.9 0.2 | 249 37 | -97 | 80 | 3.0 0.2 | 408 40 | -26 | 130 | 657 54 |
| L1 | – | – | – | – | 1.5 0.2 | 207 39 | -102 | 130 | 15.4 0.3 | 1654 167 | -40 | 101 | 1861 171 |
| L2 | 2.45 0.2 | 169 31 | -152 | 65 | 13.9 0.2 | 1559 150 | -64 | 105 | 7.1 0.2 | 635 78 | 38 | 84 | 2363 172 |
| L3 | 1.96 0.4 | 148 34 | -129 | 71 | 11.8 0.3 | 1811 135 | -50 | 144 | 2.9 0.3 | 386 51 | 32 | 124 | 2345 148 |
| L4 | 3.81 0.4 | 203 47 | -110 | 50 | 13.0 0.3 | 1938 145 | -52 | 140 | 4.5 0.3 | 525 59 | 40 | 110 | 2666 163 |
| L5 | 1.45 0.4 | 77 25 | -120 | 50 | 9.3 0.3 | 815 103 | -81 | 82 | 16.4 0.2 | 2092 176 | 22 | 120 | 2984 205 |
| L6 | 2.44 0.6 | 78 32 | -91 | 30 | 21.3 0.3 | 2042 229 | 6 | 90 | 8.9 0.4 | 714 100 | 95 | 75 | 2834 252 |
| L7 | – | – | – | – | 16.5 0.2 | 1583 177 | 12 | 90 | 5.4 0.2 | 457 59 | 112 | 80 | 2040 187 |
| L8 | 1.50 0.2 | 113 20 | -26 | 71 | 8.7 0.2 | 678 94 | 50 | 73 | 2.7 0.2 | 222 31 | 126 | 78 | 1013 101 |
| 12CO(J=2–1) | |||||||||||||
| L0 | – | – | – | – | 4.2 0.1 | 360 46 | -97 | 80 | 2.1 0.1 | 291 24 | -26 | 130 | 651 52 |
| L1 | – | – | – | – | 2.8 0.1 | 383 34 | -102 | 130 | 12.6 0.1 | 1357 135 | -40 | 101 | 1740 139 |
| L2 | 4.08 0.1 | 282 44 | -152 | 65 | 12.2 0.1 | 1362 130 | -64 | 105 | 5.6 0.1 | 496 60 | 38 | 84 | 2140 150 |
| L3 | 4.10 0.2 | 310 46 | -129 | 71 | 8.3 0.2 | 1279 92 | -50 | 144 | 3.6 0.2 | 479 44 | 32 | 124 | 2068 112 |
| L4 | 4.27 0.2 | 227 47 | -110 | 50 | 9.1 0.2 | 1353 99 | -52 | 140 | 6.2 0.2 | 725 68 | 40 | 110 | 2305 129 |
| L5 | 3.85 0.2 | 205 43 | -120 | 50 | 5.2 0.2 | 454 58 | -81 | 82 | 13.2 0.1 | 1688 142 | 22 | 120 | 2347 159 |
| L6 | 1.19 0.1 | 38 13 | -91 | 30 | 17.7 0.1 | 1696 189 | 6 | 90 | 6.9 0.1 | 550 74 | 95 | 75 | 2284 203 |
| L7 | – | – | – | – | 14.2 0.2 | 1360 152 | 12 | 90 | 4.0 0.2 | 344 45 | 112 | 80 | 1704 159 |
| L8 | 1.25 0.1 | 95 15 | -26 | 71 | 9.3 0.1 | 720 99 | 50 | 73 | 2.6 0.1 | 219 29 | 126 | 78 | 1034 104 |
| 12CO(J=1–0) | |||||||||||||
| L0 | – – | – | – | – | 0.300.01 | 25 3 | -97 | 80 | 0.030.01 | 5 2 | -26 | 130 | 30 4 |
| L1 | – – | – | – | – | 0.160.02 | 22 3 | -102 | 130 | 1.840.02 | 197 20 | -40 | 101 | 219 20 |
| L2 | 0.340.04 | 23 4 | -152 | 65 | 1.660.03 | 185 18 | -64 | 105 | 0.440.03 | 40 6 | 38 | 84 | 248 19 |
| L3 | 0.420.04 | 32 5 | -129 | 71 | 1.110.03 | 171 13 | -50 | 144 | 0.170.03 | 22 4 | 32 | 124 | 225 14 |
| L4 | 0.630.06 | 34 8 | -110 | 50 | 1.450.04 | 216 17 | -52 | 140 | 0.580.04 | 68 8 | 40 | 110 | 318 20 |
| L5 | 0.430.05 | 23 5 | -120 | 50 | 0.770.04 | 67 9 | -81 | 82 | 1.670.03 | 213 18 | 22 | 120 | 303 21 |
| L6 | 0.060.04 | 2 1 | -91 | 30 | 2.570.04 | 246 28 | 6 | 90 | 0.950.04 | 76 11 | 95 | 75 | 322 30 |
| L7 | – – | – | – | – | 1.960.03 | 188 21 | 12 | 90 | 0.510.03 | 43 6 | 112 | 80 | 231 22 |
| L8 | 0.080.01 | 6 1 | -26 | 71 | 1.200.01 | 93 13 | 50 | 73 | 0.310.01 | 26 4 | 126 | 78 | 125 14 |
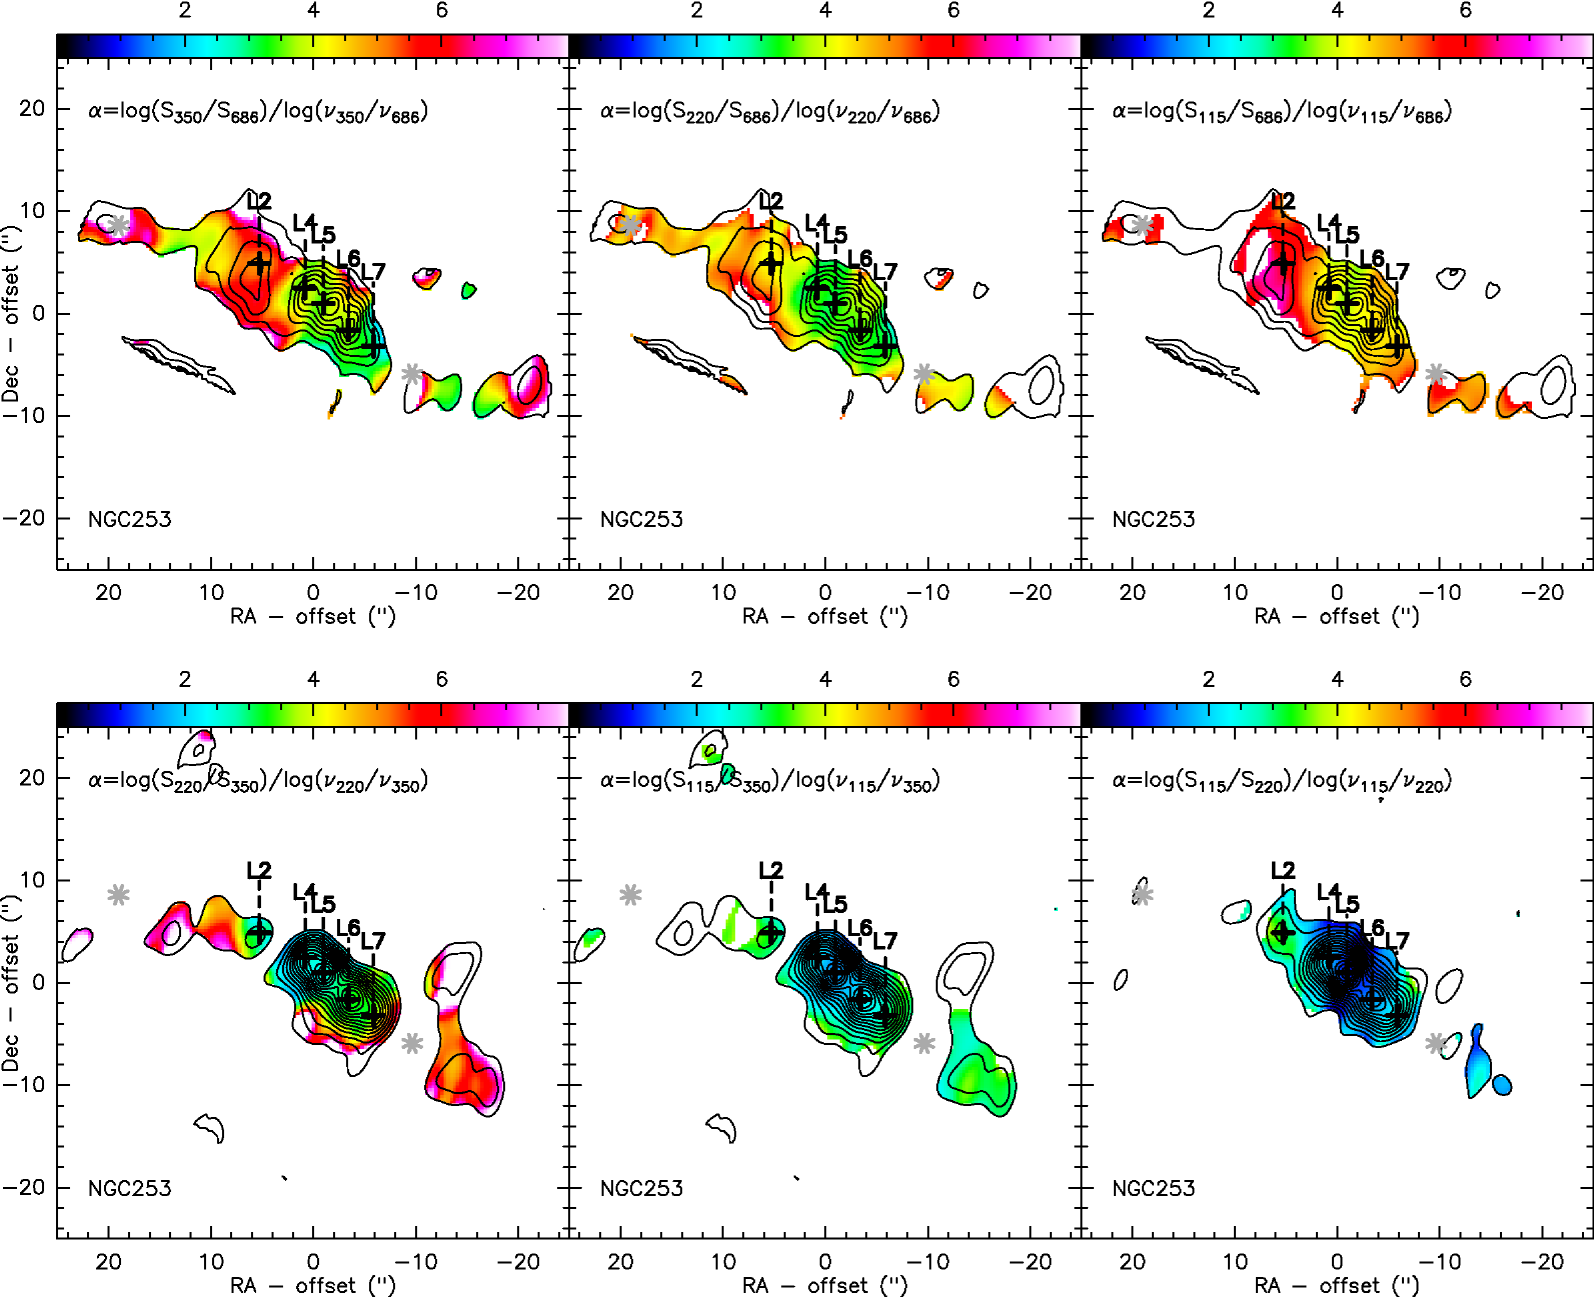
Table 2 lists the total continuum fluxes for all four frequencies and Table 3 the individual fluxes per beam for each continuum peak. Assuming no significant resolution effects, the different fluxes indicate a total spectral index of 3 (for ), see also Fig. 2. This is consistent with the spectral index found between the 1.3 mm and 0.87 mm continuum emission by Sakamoto et al. (2011) and between the 2.6 mm and 1.3 mm continuum by Sakamoto et al. (2006). This strongly indicates that the emission at 115 GHz is largely dominated by thermal dust emission. Our new 690 GHz data, along with the ALMA 115 GHz data, now reveal differences in continuum intensity ratios among the continuum peaks (see Fig. 2 and Fig. 3); Fig. 2 shows the spectral emissitivity index maps between the different frequencies and Fig. 3 plots the continuum SED for each of the continuum peaks normalized to the peak flux at 220 GHz for each component. While it is true that along L4-L7 the ratios do not change too much, yielding still an index around 3, at least for the higher frequencies, it increases to 4-5 at L2 (see Fig. 2). This appears to be consistent with the overabundance of 12CO(J=7–6) found by Bradford et al. (2003) suggesting a warmer dust component in this region. The latter would add to a higher flux of the 690 GHz continuum emission assuming a two temperature phase of the dust here. Also, we see a slight drop of the spectral index with respect to the 2.6 mm continuum which most likely indicates the increasing role of non-thermal synchrotron and thermal free-free continuum emission towards longer wavelengths (see Fig. 3); Heesen et al. (2011) and Ulvestad & Antonucci (1997) find a probably equal contribution between non-thermal synchrotron radio emission presumably from supernova remnants and thermal free-free radio emission from HII regions, i.e., star formation. Heesen et al. (2011) derive a spectral index of for the radio continuum emission at cm wavelengths in the center which steepens to toward the outer parts and filaments. Judging from Figure 9 in Heesen et al. (2011), L5 and L6 show a spectral index of around 0.5, while L2, L4 and L7 increase to around 1, explaining the differences in the deviations of the 115 GHz continuum from the thermal (sub)mm (modified black body) slope for the different components. Depending on the component and assumed spectral index, the synchrotron/free-free emission contributes between 15% and 80% to the 115 GHz continuum emission, with L2 having the least (15%) and L5 and L7 (80%) having the most contribution from these radio (cm/mm) processes to their 2.6 mm continuum emission. However, if the synchrotron/free-free spectral indices are somewhat flatter or steeper, the fraction of this emission to the total continuum emission will change accordingly (being higher or lower, respectively). Given that generally (but not exclusively) the radio spectra of non-thermal synchrotron continuum emission is steeper (i.e., to ) than that of the thermal free-free continuum emission, it might be likely that the continuum emission at 2.6 mm has a larger contribution of thermal free-free emission (see also Peel et al., 2011). However, this might change from clump to clump within the disk and we have no actual way to distinguish between non-thermal synchrotron and thermal free-free emission from our continuum observations other than the spectral radio index (which might be misleading). Therefore, we will not further stress a differentiation between the two processes.
3.1.1 Temperature, opacity and mass of the dust
While fitting a simple power law to the (sub-)millimeter dust emission is a reasonable first-order approach, we can actually do better and determine the temperature, opacity and dust mass from our observations, using standard equations (for a comparison on similar observations and sources see also the recent work on 690 GHz ALMA data for Arp220 by Wilson et al., 2014; Scoville et al., 2015). By using flux ratios, we can eliminate some assumptions such as on the dust emissivity, in particular to derive the dust opacities and dust temperatures (but see also further below for the dust mass for which this approach does not work). This gives the following equation (see also Wilson et al., 2014):
| (1) |
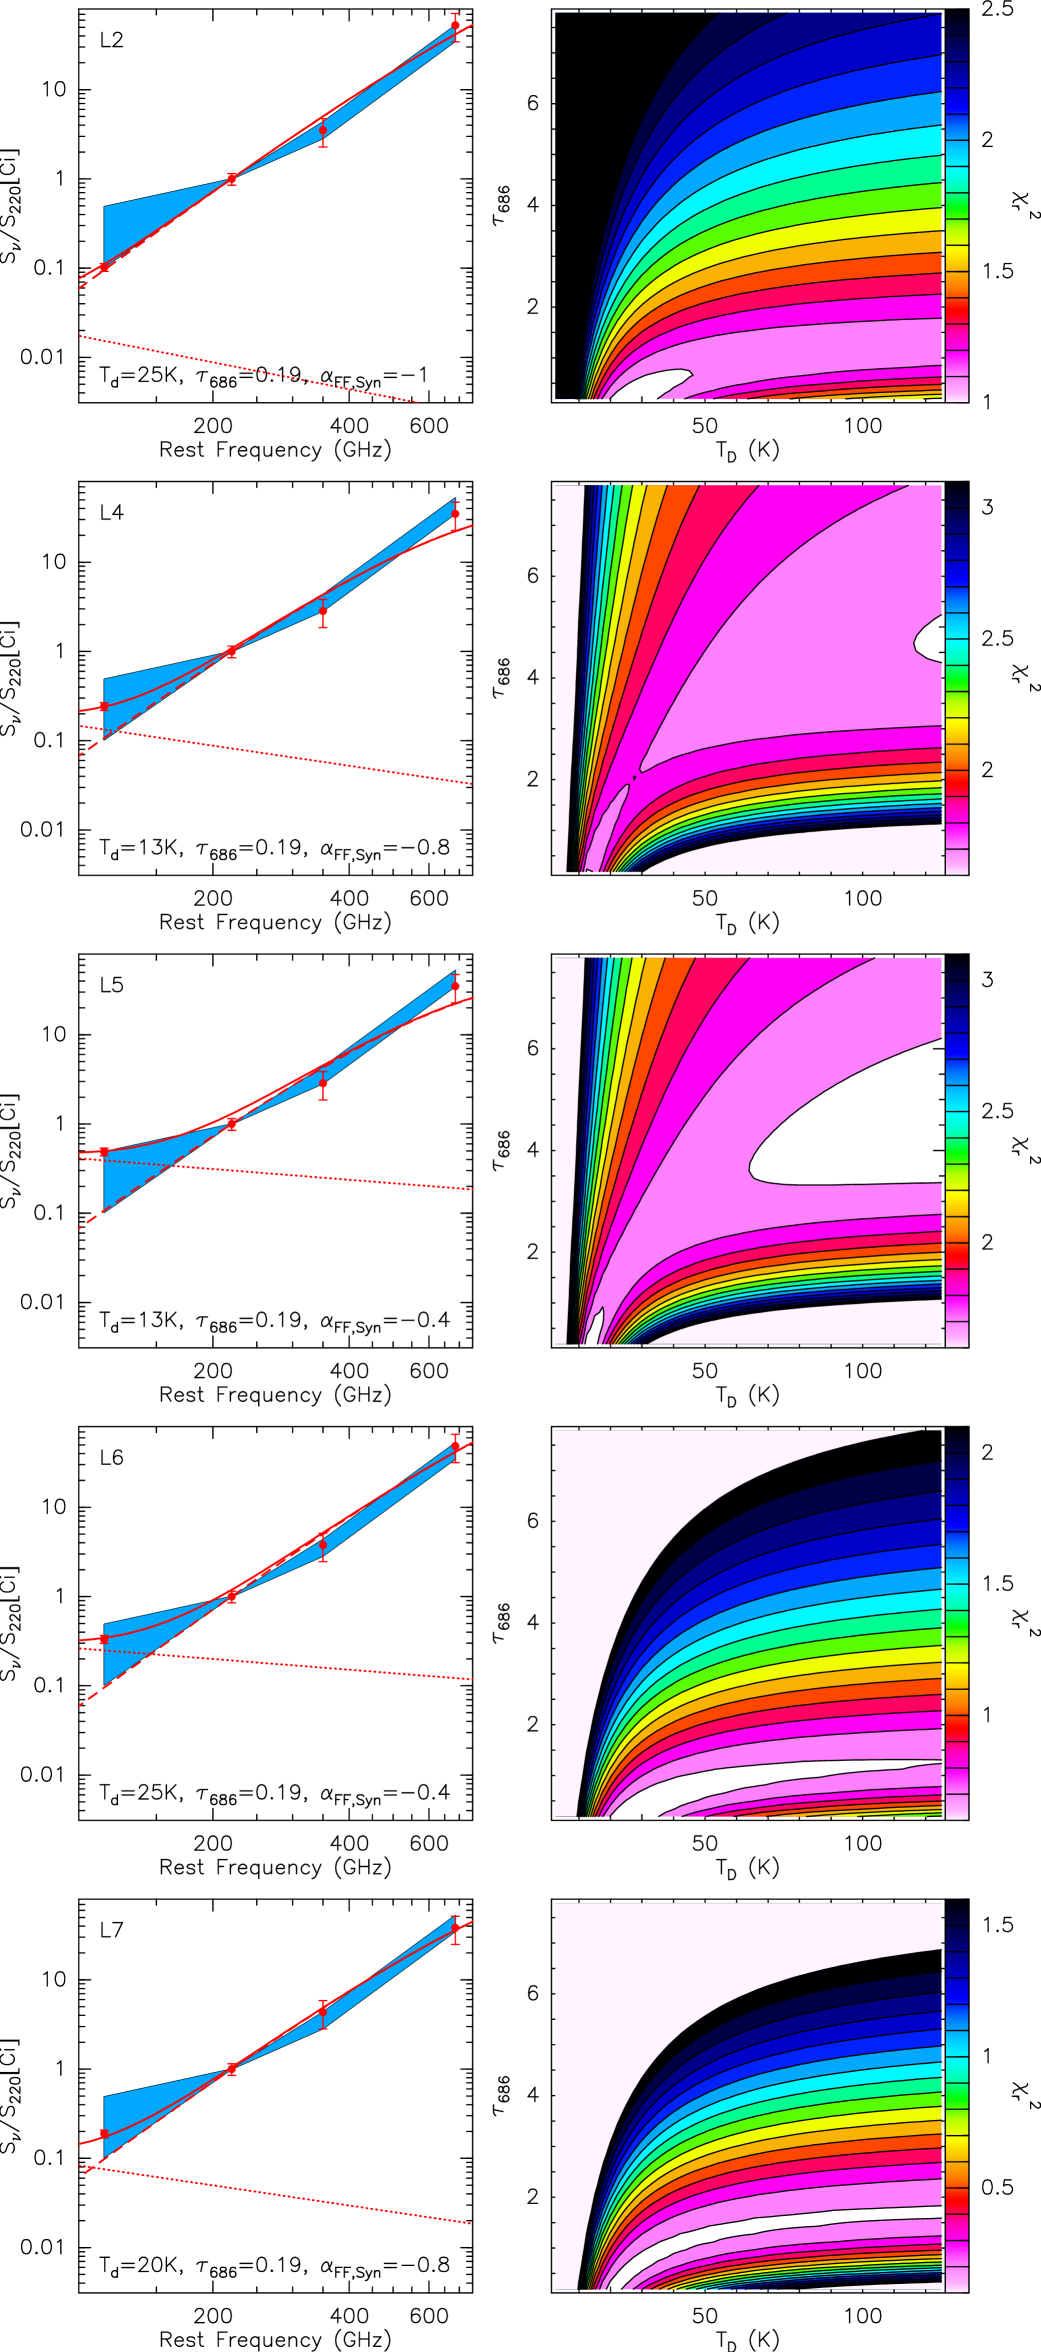
Using the flux densities of the emission at 220 GHz444Contributions from the free-free/synchrotron emission can be neglected here as they are less than 5% being hence smaller than the uncertainties and leaving unchanged the final best fit solutions., 350 GHz and 686 GHz, this allows us to derive the opacities and dust temperatures in the different peaks, as shown in Fig.3 along with the -fits. We assumed a spectral index of the dust emissivity555We fitted equally for a spectral index of 1.5 and 2.1 as used in previous publications for NGC 253 (e.g., Peel et al., 2011), but the best fit solutions were found for a value of 1.8 of 1.8 (see Wilson et al., 2014, and references therein) and varied the dust temperatures in the range of 2.5 K up to 150 K and opacities at 220 GHz between 0.02 and 1 (corresponding to opacities at 686 GHz of , i.e., 0.15 to 8). The best-fit solutions suggest dust temperatures of 10-30 K at low opacities of =0.19 for all five peaks, with L2 having the highest Td of 25 K. However, L4 and L5 have almost equally low- solutions at higher T and much higher opacities of =4 while the opacities of L2 stay consistently below 1. The two-temperature best-fit ranges are in good agreement with what is found for the molecular gas that can only be well fit with a two-phase temperature gas model (see next Sections). As dust and molecular gas are intimately bound, one would expect a two-temperature phase as well in the dust. The higher Td of the inner disk are similar to the values found for the eastern nucleus in Arp 220 which was fitted to 80 K but at higher opacities that are closer to the values found in the western nucleus of Arp 220 Wilson et al. (2014).
To calculate the dust mass Mdust at a given frequency
for each peak, we use the following standard equation:
| (2) |
with Sν being the flux observed at frequency , D the distance (=3.5 Mpc), the mass absorption coefficient with being the spectral index of the dust emissivity, and B(,Td) the Planck function. Assuming =1.8 and 0.6-3 m2/g at a frequency of =1.9 THz (158) depending on the dust properties (see Hirashita et al., 2014; Dayal et al., 2010; Zubko et al., 1996, 2004; Draine & Lee, 1984), we estimate dust masses of 104-105-M⊙ per dust peak, i.e. with an uncertainty of a factor of 5-10. The biggest uncertainty comes from the range of that depends on which type or combination of dust grains dominates (i.e., graphite, silicate, amorphous carbon, etc., see for a summary Hirashita et al., 2014). Comparing the dust masses to the molecular gas masses derived from optically thin molecular tracers (such as 13CO) of a few 107 M⊙ (see for instance Leroy et al., 2015), we derive a gas-to-dust mass ratio of 100-1000 for the different peaks and the range in . Doing the same exercise on the global flux of the entire disk, we find a dust mass of about a few 106M⊙ for a dust temperature of Td=25 K. The gas mass of the disk in NGC253 is about a few 108-109 M⊙ in the area of the detected continuum emission, resulting in a global gas-to-dust mass ratio of a few hundred. The gas-to-dust mass ratios are consistent with the values (100-1000) usually found in active galaxies with metallicities around solar (see for instance Remy-Ruyer et al., 2014).
The global (and individual) dust temperatures found here are in good agreement with previous works on NGC 253 (see for instance Peel et al., 2011). The global dust mass of NGC 253 is similar to that found in nearby active galaxies (see for instance Remy-Ruyer et al., 2014) but one to two orders of magnitude smaller than that found for nearby (ultra-)luminous-infrared galaxies (=(U)LIRGs) such as Arp 220, NGC 6240 or NGC 1614 (see for instance Scoville et al., 2015; Xu et al., 2015). Arp 220 and NGC 6240 show dust masses around a few 109M⊙ and NGC 1614 has a dust mass around 107-108M⊙. This is not surprising as especially the nuclei in Arp 220 are known to be highly obscured exhibiting a starburst much stronger than that in the disk of NGC 253 while NGC 1614 is likely more comparable to NGC 253 than Arp 220.
3.2. Line Emission
3.2.1 General Properties
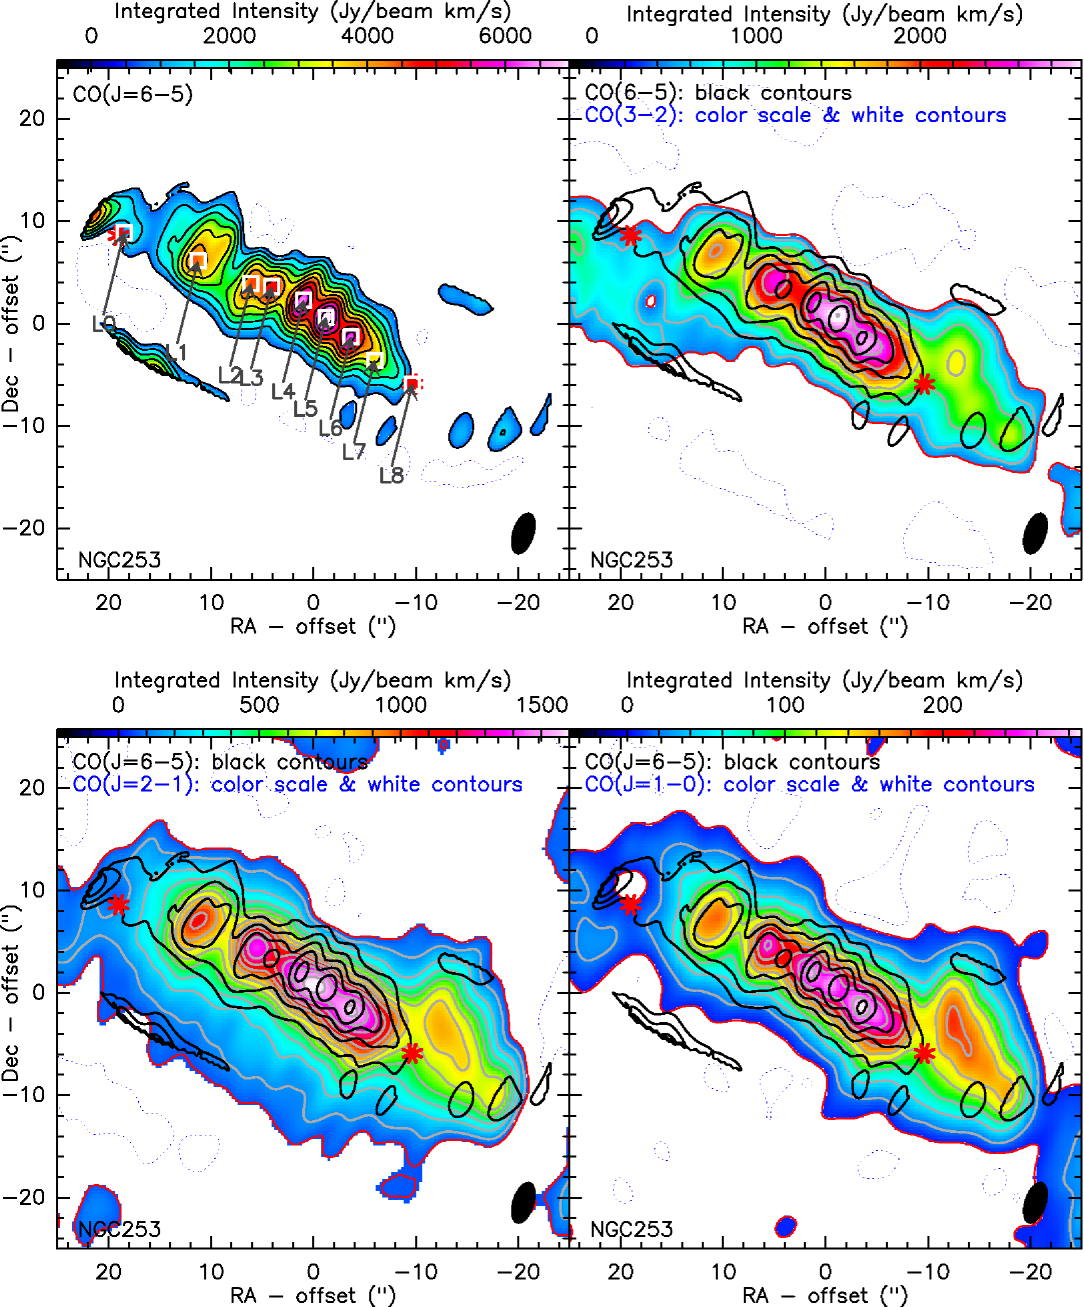
We clearly detect emission from 12CO(J=6–5) (Fig. 4). The distribution of the spectrally integrated 12CO(J=6–5) line emission closely follows that of 12CO(J=3–2), 12CO(J=2–1) and 12CO(J=1–0) (see Fig. 4). We identify at least seven different peaks in the integrated 12CO(J=6–5) emission, labeled L1 to L7 in Fig. 4, plus the location of the two shells labeled L0 (for SB2) and L8 (for SB1). L4 to L6 appear to be the most dominant ones in all four 12CO transitions. L5 is spatially coincident with the dynamical center of NGC 253 (see Rosenberg et al., 2012; Müller-Sánchez et al., 2010). Most of these line peaks in the disk, with the exceptions of L1 and L3 which have no correspondence in the continuum emission, spatially coincide with the continuum peaks at 2.6 mm, 1.3 mm, 0.87 mm and 0.43 mm identified in Sakamoto et al. (2011) and this work (see also Section 3.1). Line peaks L4 and L5 appear merged for the 12CO(J=3–2) and 12CO(J=2–1) emission at the angular resolution used in this paper while they are clearly separated for the 12CO(J=6–5) emission. However, at the higher angular resolution used in Sakamoto et al. (2011), the peak positions match well those seen for 12CO(J=6–5), with the exception of L3, which does not have an obvious counterpart in the lower transitions. This merging of the peaks is probably due to extended emission in the lower 12CO transitions as 12CO(J=6–5) most likely traces denser (and/or hotter) gas. L5 appears to be the strongest peak for all lines except 12CO(J=1–0), where L6 seems to dominate. Interestingly, L4 appears to be somewhat brighter in 12CO(J=6–5), 12CO(J=2–1) and 12CO(J=1–0) than in 12CO(J=3–2), an effect that is already seen for the 13CO(J=2–1), C18O(J=2–1) and HCN(J=4–3) emission by Sakamoto et al. (2011).
We only detect marginal 12CO(J=6–5) emission around the western and eastern shells (SB1=L08 and SB2=L01) described in Sakamoto et al. (2006) and marked with stars and squares in Fig. 4. While the eastern shell is only partially covered with our five-point mosaic of the 12CO(J=6–5) emission, the western shell is (almost) completely covered. However, the western shell is already significantly weaker in the lower 12CO transitions, so that we might still simply lack adequate sensitivity in our observations for a clear detection.
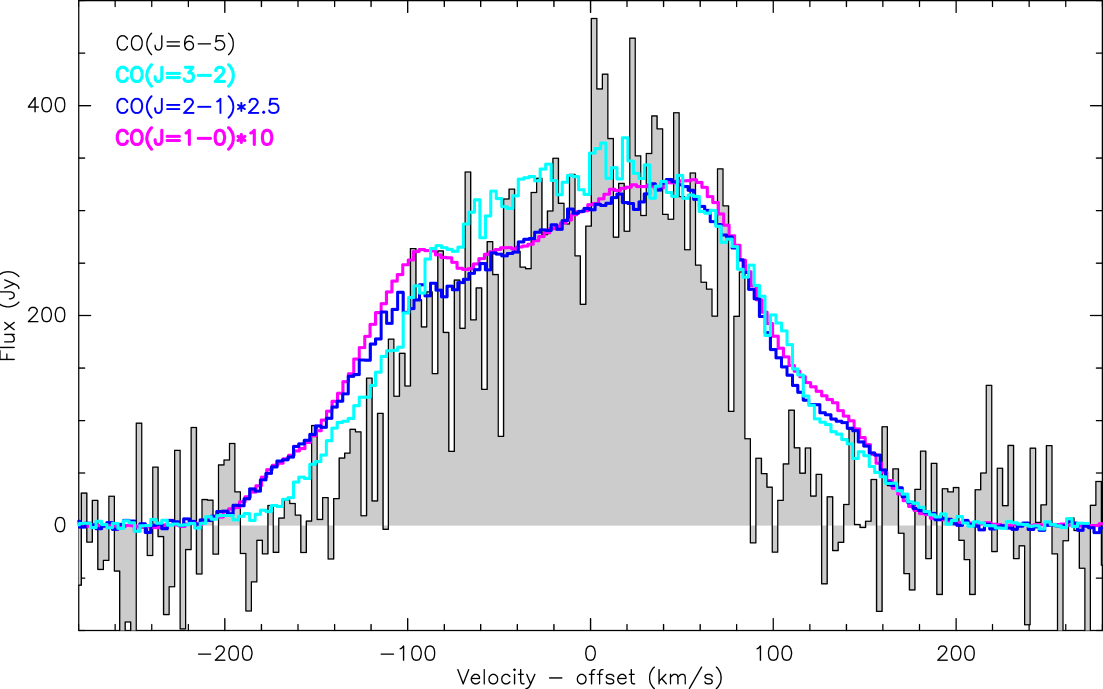
The line profiles of the 12CO(J=6–5), 12CO(J=3–2), 12CO(J=2–1) and 12CO(J=1–0) emission, shown in Fig. 5, were spatially integrated over the entire emission area for each transition respectively. Multiple-component (up to three) Gaussian fits were carried out on the line profiles and the results are given in Table 2. As can be seen, while overall the line profiles agree well with each other, part of the redshifted and blueshifted wing of the 12CO(J=3–2), 12CO(J=2–1) and 12CO(J=1–0) line emission is apparently missing in the 12CO(J=6–5) line emission. These “wing”-components are most likely associated with the western (redshifted velocities) and eastern (blueshifted velocities) shells (see Sakamoto et al., 2006). While the eastern part could easily still be hidden in the noise, one gets the impression that the redshifted 12CO(J=6–5) emission is indeed not present and that this is more likely due to excitation effects than to insufficient sensitivity as also shown by the individual spectra at the peaks (see Fig. 7).
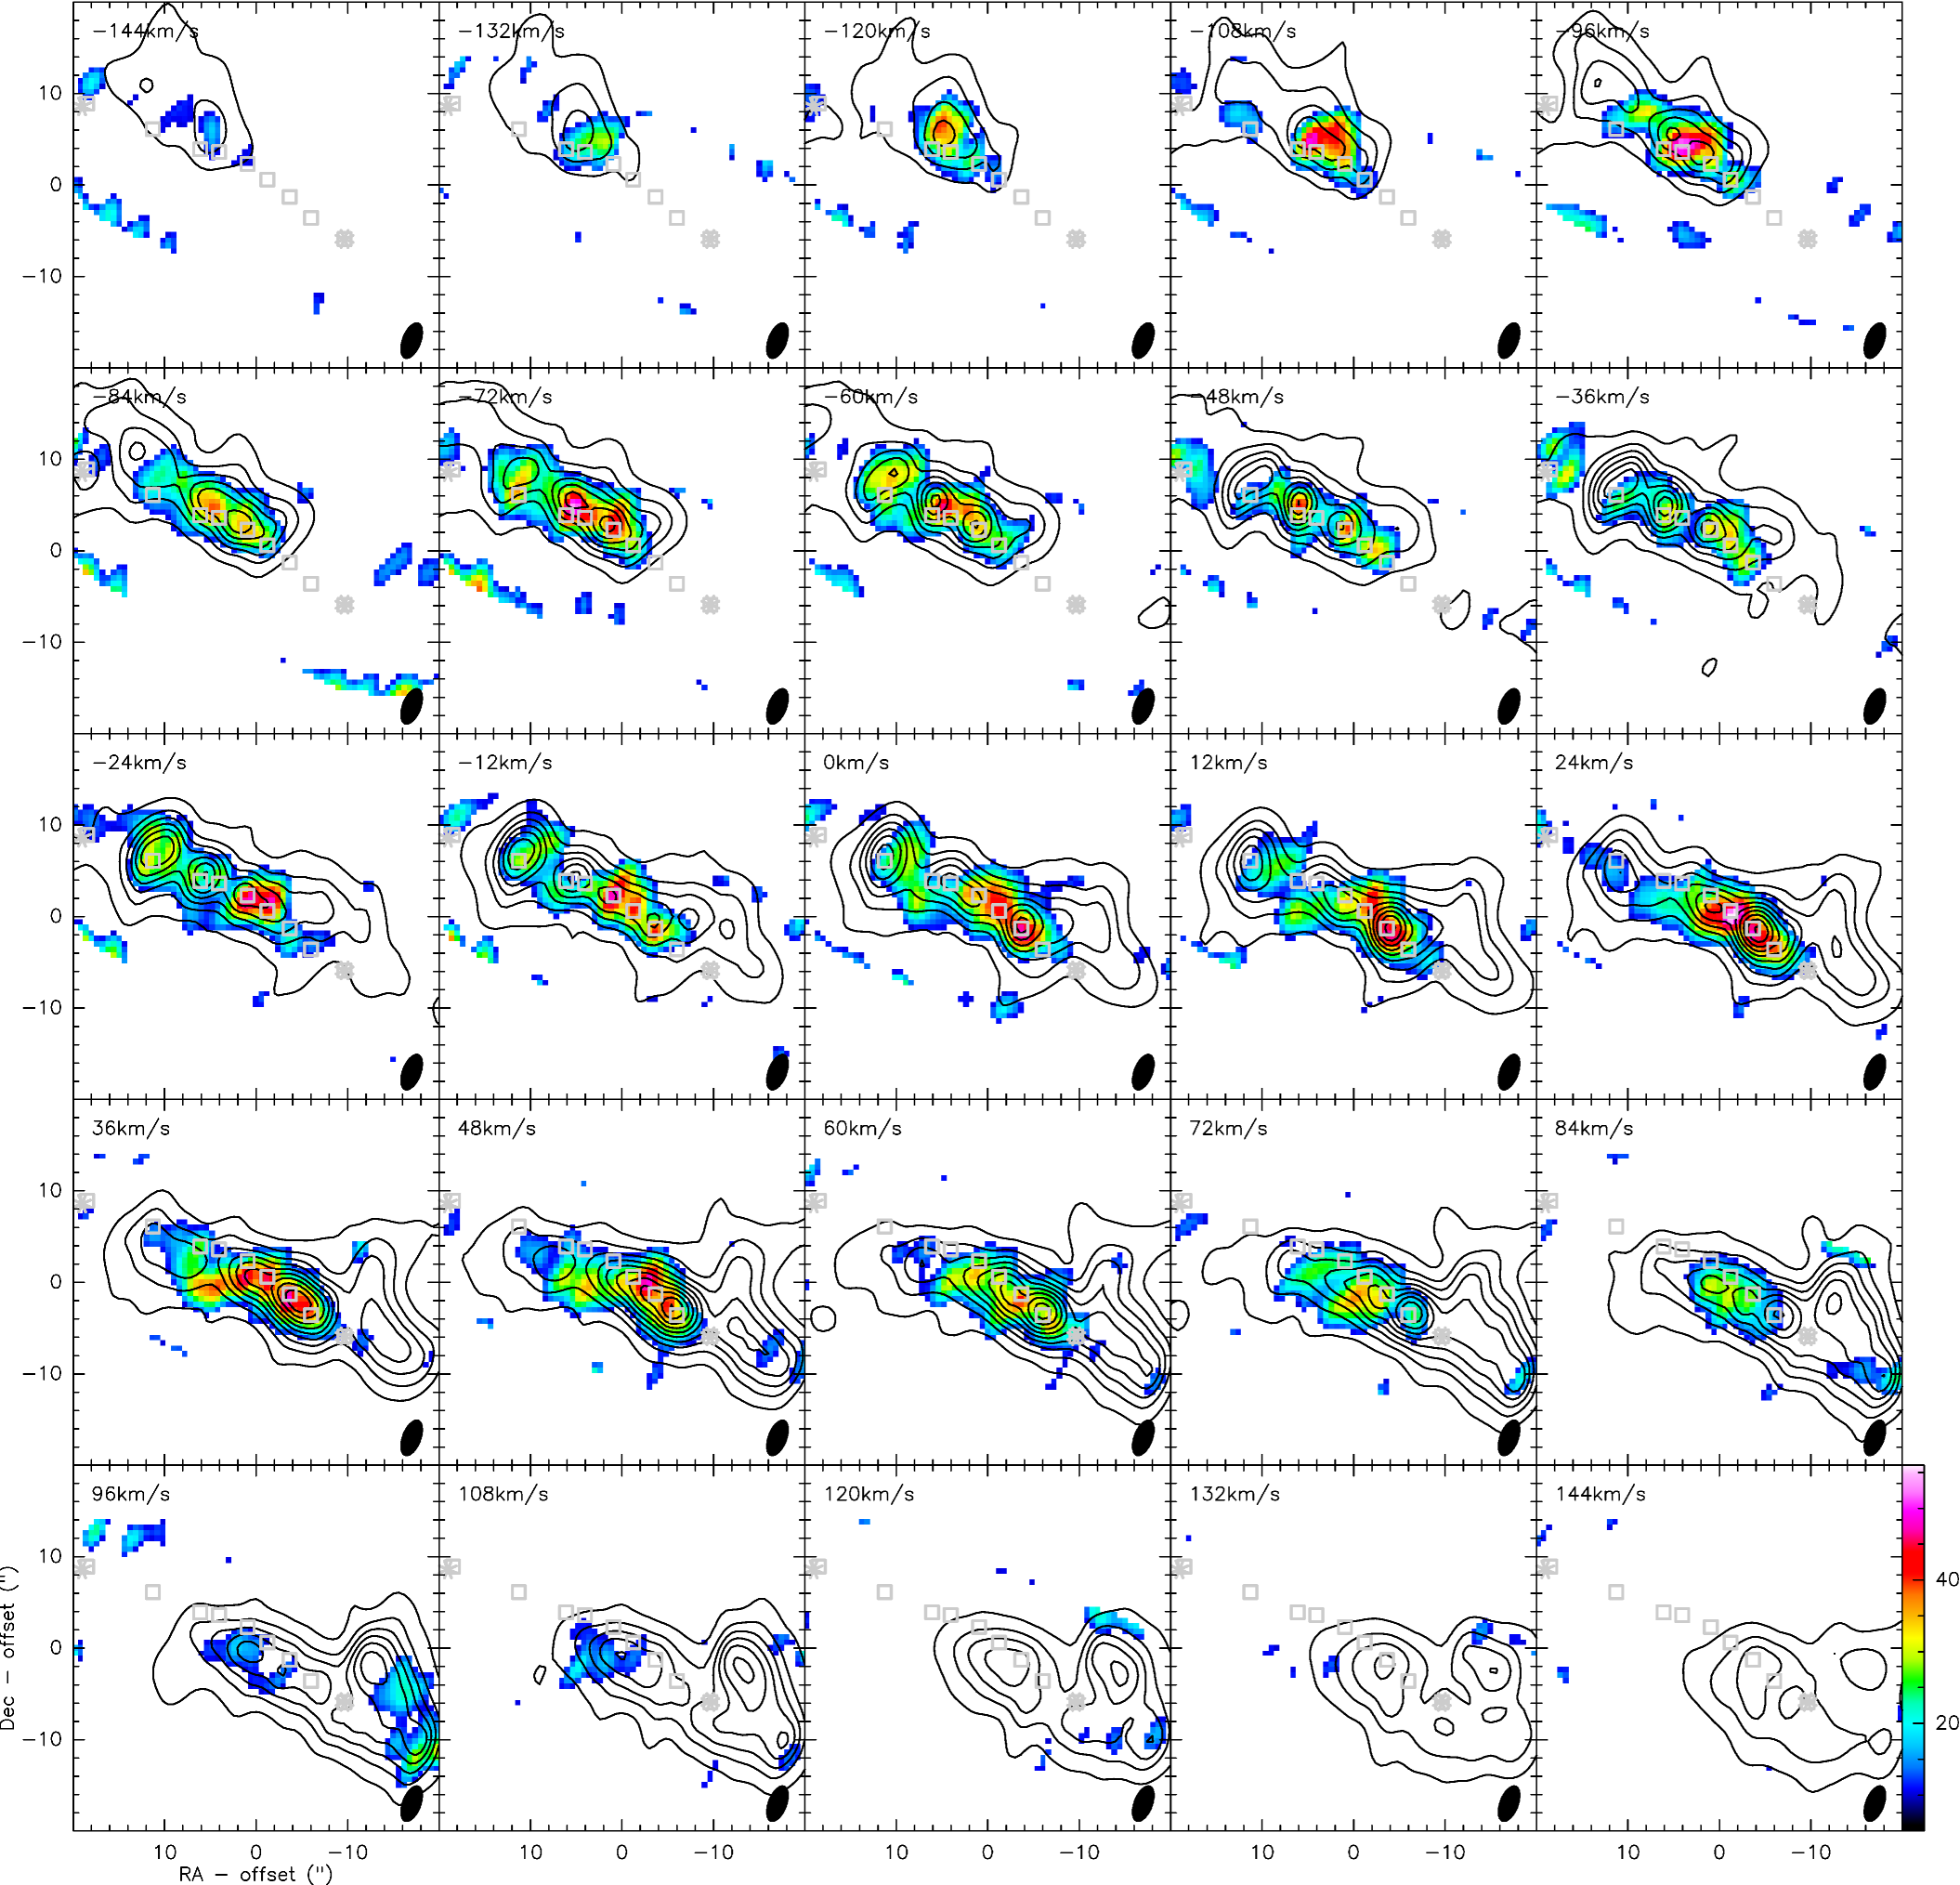
Looking at the velocity channel maps in Fig. 6, in which the 12CO(J=6–5) emission is exemplary plotted in contours over the 12CO(J=1–0) emission in color scale, we find again that all four transitions strongly resemble each other for most velocities; especially the three lowest transitions are almost indistinguishable from each other (see also Fig. 5 & 7). Although it is difficult to clearly identify the line peaks (Fig. 4) of the 12CO(J=6–5) emission in the velocity resolved channels due to the lower signal-to-noise ratios and because each of these peaks represent an ensemble of giant molecular cloud complexes (GMCs), one can still see some trends. L6 clearly is the dominant and brightest peak for the 12CO(J=3–2), 12CO(J=2–1) and 12CO(J=1–0) emission between velocities 24 km s-1 and 60 km s-1 with L4 and L5 being significantly weaker as opposed to the spectrally integrated maps in Fig. 4. At these velocities, both L5 and L6 appear almost equally bright in the 12CO(J=6–5) emission. L3 and L4 also look equally strong in 12CO(J=6–5) for velocities around 80 km s-1and 48 km s-1, while L3 seems to be brighter for the lower transitions. The lack of significant 12CO(J=6–5) emission at the higher velocities (100 km s-1and 100 km s-1) with respect to the lower three transitions is again striking.
| Ratio | L0 | L1 | L2 | L3 | L4 | L5 | L6 | L7 | L8 |
|---|---|---|---|---|---|---|---|---|---|
| (1) | (2) | (3) | (4) | (5) | (6) | (7) | (8) | (9) | (10) |
| Bluest Gaussian Line | |||||||||
| R | – | – | 2.00 | 1.60 | 3.10 | 1.20 | 1.90 | – | 1.20 |
| R | – | – | 7.30 | 7.40 | 7.70 | 6.90 | 2.10 | – | 2.30 |
| R | – | – | 2.40 | 3.00 | 4.60 | 3.10 | 0.4 | – | 0.60 |
| R | – | – | 3.800.90 | 4.701.30 | 2.500.80 | 6.002.30 | 1.100.60 | – | 1.900.40 |
| R | – | – | 1.200.30 | 1.900.50 | 1.500.50 | 2.701.10 | 0.200.10 | – | 0.500.10 |
| R | – | – | 0.330.08 | 0.410.09 | 0.600.19 | 0.450.14 | 0.210.13 | – | 0.250.06 |
| – | – | – | – | – | – | – | – | – | |
| – | – | – | – | – | – | – | – | – | |
| – | – | – | – | – | – | – | – | – | |
| – | – | 1.50.6 | 1.90.8 | 1.0 | 2.41.2 | 0.40.2 | – | 0.80.3 | |
| – | – | 0.80.3 | 1.30.6 | 1.0 | 1.80.9 | 0.20.1 | – | 0.30.1 | |
| – | – | 0.50.2 | 0.70.3 | 1.0 | 0.70.3 | 0.40.3 | – | 0.40.2 | |
| Central Gaussian Line | |||||||||
| R | 2.30 | 1.000.40 | 1.600.20 | 1.700.20 | 1.600.20 | 2.400.60 | 1.800.30 | 2.600.50 | 6.502.70 |
| R | 7.60 | 4.101.60 | 3.100.40 | 2.700.40 | 2.600.30 | 3.000.70 | 3.300.50 | 5.000.90 | 15.406.50 |
| R | 2.10 | 0.900.40 | 1.700.20 | 1.500.20 | 1.600.20 | 1.800.40 | 1.900.30 | 2.800.50 | 8.003.30 |
| R | 3.300.60 | 4.200.90 | 2.000.30 | 1.600.20 | 1.600.20 | 1.300.20 | 1.900.30 | 1.900.30 | 2.400.50 |
| R | 0.700.10 | 1.000.20 | 1.100.10 | 0.800.10 | 1.000.10 | 0.700.10 | 1.100.20 | 1.100.20 | 1.200.20 |
| R | 0.200.04 | 0.230.04 | 0.540.07 | 0.530.06 | 0.640.07 | 0.590.11 | 0.580.09 | 0.550.09 | 0.520.10 |
| 1.4 | 0.60.3 | 1.00.2 | 1.10.2 | 1.0 | 1.50.4 | 1.10.2 | 1.60.4 | 4.01.8 | |
| 3.0 | 1.60.7 | 1.20.2 | 1.10.2 | 1.0 | 1.20.3 | 1.30.3 | 2.00.4 | 6.02.6 | |
| 1.3 | – | 1.00.2 | 0.90.2 | 1.0 | 1.10.3 | 1.20.3 | 1.70.4 | 4.92.2 | |
| 2.10.5 | 2.70.6 | 1.30.2 | 1.00.1 | 1.0 | 0.80.2 | 1.20.2 | 1.20.2 | 1.50.3 | |
| 0.60.1 | 1.00.3 | 1.10.2 | 0.80.1 | 1.0 | 0.70.1 | 1.10.2 | 1.10.2 | 1.20.3 | |
| 0.30.1 | 0.40.1 | 0.90.2 | 0.80.1 | 1.0 | 0.90.2 | 0.90.2 | 0.90.2 | 0.80.2 | |
| Reddest Gaussian Line | |||||||||
| R | 1.000.20 | 2.300.40 | 1.800.40 | 2.301.30 | 0.800.10 | 1.600.20 | 2.500.70 | 4.30 | 2.10 |
| R | 1.500.40 | 4.300.70 | 3.200.70 | 6.503.50 | 2.400.40 | 2.900.40 | 4.201.10 | 7.30 | 4.70 |
| R | 0.110.05 | 2.500.40 | 1.000.20 | 1.200.70 | 0.900.20 | 1.400.20 | 2.300.60 | 3.60 | 2.30 |
| R | 1.600.20 | 1.800.30 | 1.800.30 | 2.800.40 | 3.100.50 | 1.800.20 | 1.700.30 | 1.700.30 | 2.200.40 |
| R | 0.110.04 | 1.100.20 | 0.600.10 | 0.500.10 | 1.200.20 | 0.900.10 | 1.000.20 | 0.800.20 | 1.100.20 |
| R | 0.070.03 | 0.580.08 | 0.320.06 | 0.180.04 | 0.380.06 | 0.500.06 | 0.550.11 | 0.500.10 | 0.470.10 |
| 1.20.40 | 3.00.7 | 2.30.6 | 3.01.7 | 1.0 | 2.00.4 | 3.11.0 | 5.5 | 2.7 | |
| 0.60.20 | 1.80.4 | 1.30.3 | 2.71.5 | 1.0 | 1.20.3 | 1.70.5 | 3.0 | 2.0 | |
| 0.10.05 | 2.70.7 | 1.10.3 | 1.30.8 | 1.0 | 1.60.4 | 2.60.8 | 4.0 | 2.5 | |
| 0.50.10 | 0.60.1 | 0.60.1 | 0.90.2 | 1.0 | 0.60.1 | 0.60.1 | 0.50.1 | 0.70.2 | |
| 0.10.04 | 0.90.2 | 0.50.1 | 0.40.1 | 1.0 | 0.80.2 | 0.80.2 | 0.70.2 | 0.90.2 | |
| 0.20.09 | 1.50.3 | 0.90.2 | 0.50.1 | 1.0 | 1.30.2 | 1.50.4 | 1.30.3 | 1.30.3 | |
| Ratio | L0 | L1 | L2 | L3 | L4 | L5 | L6 | L7 | L8 |
|---|---|---|---|---|---|---|---|---|---|
| (1) | (2) | (3) | (4) | (5) | (6) | (7) | (8) | (9) | (10) |
| R | 1.500.40 | 2.000.30 | 1.800.20 | 1.900.30 | 1.400.10 | 1.800.20 | 2.000.30 | 3.300.60 | 9.603.90 |
| R | 3.400.90 | 4.200.70 | 3.600.40 | 3.800.50 | 2.800.30 | 3.100.30 | 3.600.50 | 6.301.10 | 22.109.00 |
| R | 0.600.20 | 2.100.40 | 1.700.20 | 1.700.20 | 1.500.20 | 1.600.20 | 2.200.30 | 3.400.60 | 10.704.40 |
| R | 2.200.30 | 2.100.30 | 2.000.20 | 2.000.20 | 1.900.20 | 1.800.20 | 1.800.20 | 1.900.20 | 2.300.30 |
| R | 0.400.10 | 1.100.10 | 0.900.10 | 0.900.10 | 1.100.10 | 0.900.10 | 1.100.10 | 1.000.10 | 1.100.20 |
| R | 0.180.03 | 0.500.06 | 0.460.05 | 0.440.04 | 0.550.05 | 0.520.05 | 0.620.08 | 0.540.07 | 0.480.07 |
| 1.10.3 | 1.40.3 | 1.20.2 | 1.30.2 | 1.0 | 1.20.2 | 1.40.2 | 2.30.5 | 6.72.8 | |
| 1.20.3 | 1.50.3 | 1.30.2 | 1.40.2 | 1.0 | 1.10.2 | 1.30.2 | 2.20.4 | 8.03.4 | |
| 0.40.1 | 1.40.3 | 1.10.2 | 1.10.2 | 1.0 | 1.10.2 | 1.40.2 | 2.20.4 | 7.03.0 | |
| 1.10.2 | 1.10.2 | 1.00.1 | 1.00.1 | 1.0 | 0.90.1 | 0.90.1 | 1.00.2 | 1.20.2 | |
| 0.40.1 | 1.00.2 | 0.90.1 | 0.80.1 | 1.0 | 0.90.1 | 1.00.2 | 0.90.1 | 1.00.2 | |
| 0.30.1 | 0.90.1 | 0.80.1 | 0.80.1 | 1.0 | 0.90.1 | 1.10.2 | 1.00.2 | 0.90.2 |
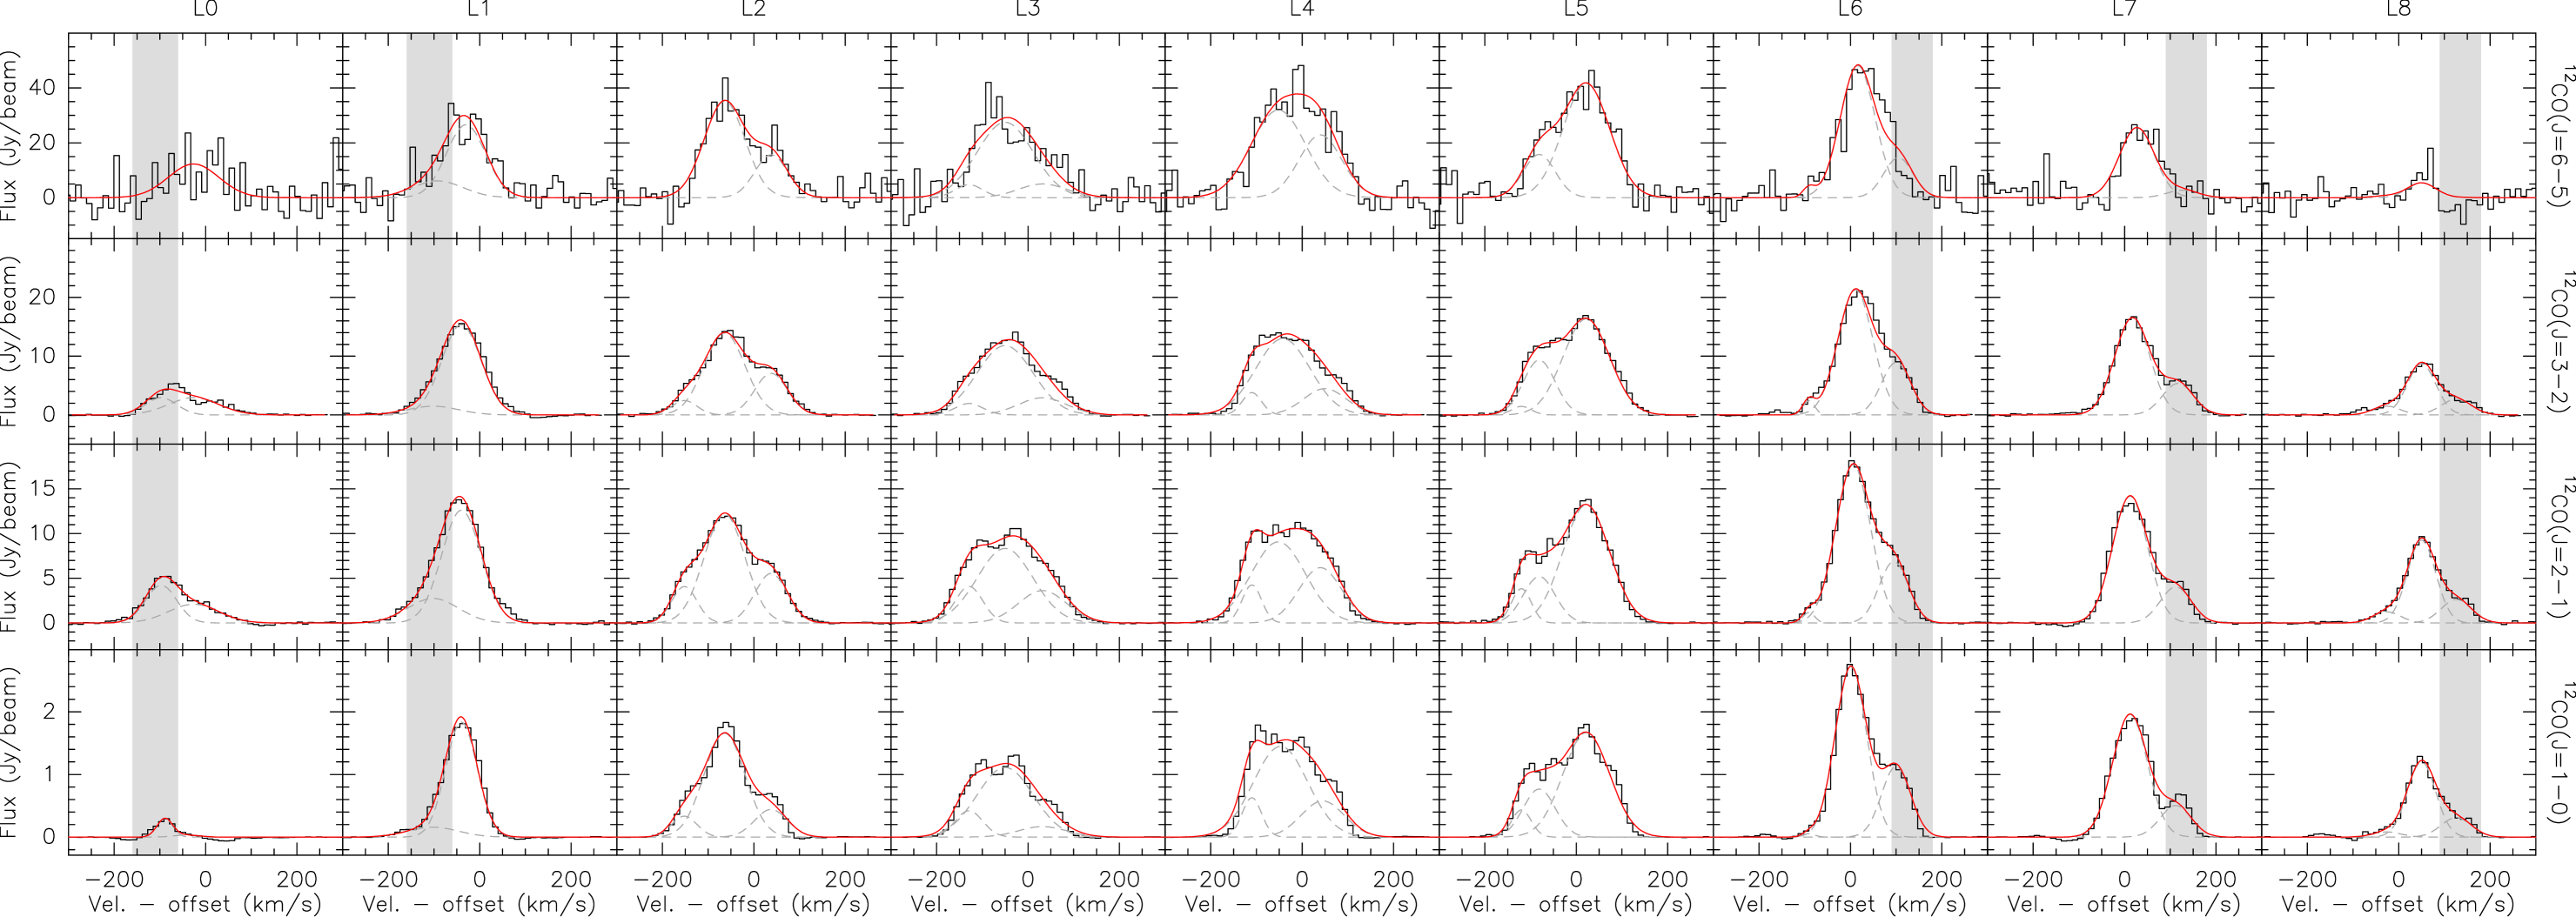
Figure 7 shows the line spectra taken at the position of each line peak for the four different 12CO transitions. Again, the similar shape of the profiles amongst all four transitions for each peak is striking. This is strong evidence that all four transitions trace the same molecular gas, i.e., the same molecular clumps along the disk of NGC 253. We fitted a multiple-component (up to three) Gaussian to all line profiles. The results of these fits are given in Table 4. To reduce the parameter space for the fit and to rest consistent between the fits for each transition, we fixed the line centers of the three different line components by choosing the best compromise for the line centers between the three lowest transition after an initial fit to them with the line center as free parameter. In Figure 7 it becomes clear why L6 appears stronger in the velocity channel maps compared to L5 in the spectrally integrated map: L5 is weaker but with a much broader line profile than L6. Judging also from these complex line profiles with multiple Gaussian components and given the high inclination of the disk in NGC 253, it is very likely that each of these peaks is an ensemble of GMCs at different velocities and merged along the line-of-sight. Based on recent ALMA observations of multiple lines in the 3 mm band, Leroy et al. (2015) find in total 10 different cloud components in their data, as based on dense gas tracers such as HCN and HCO⁺, which appear to be fitted as well with up to three Gaussian components similar to our work. Their main components along the disk are in good agreement with those used in this study.
As a note, given the complexity of the peaks, we tried to run a clump finder program on our data cubes (e.g., GAUSSCLUMP from Stutzki & Guesten, 1990), but we did not manage to obtain meaningful results due to the added complexity of an (almost) edge-on galaxy for the dynamics as well as the lack of angular resolution. Too many clumps are still merged together in space and velocity so that a clear separation and identification of GMCs remains very difficult at this point.
3.2.2 Line ratios
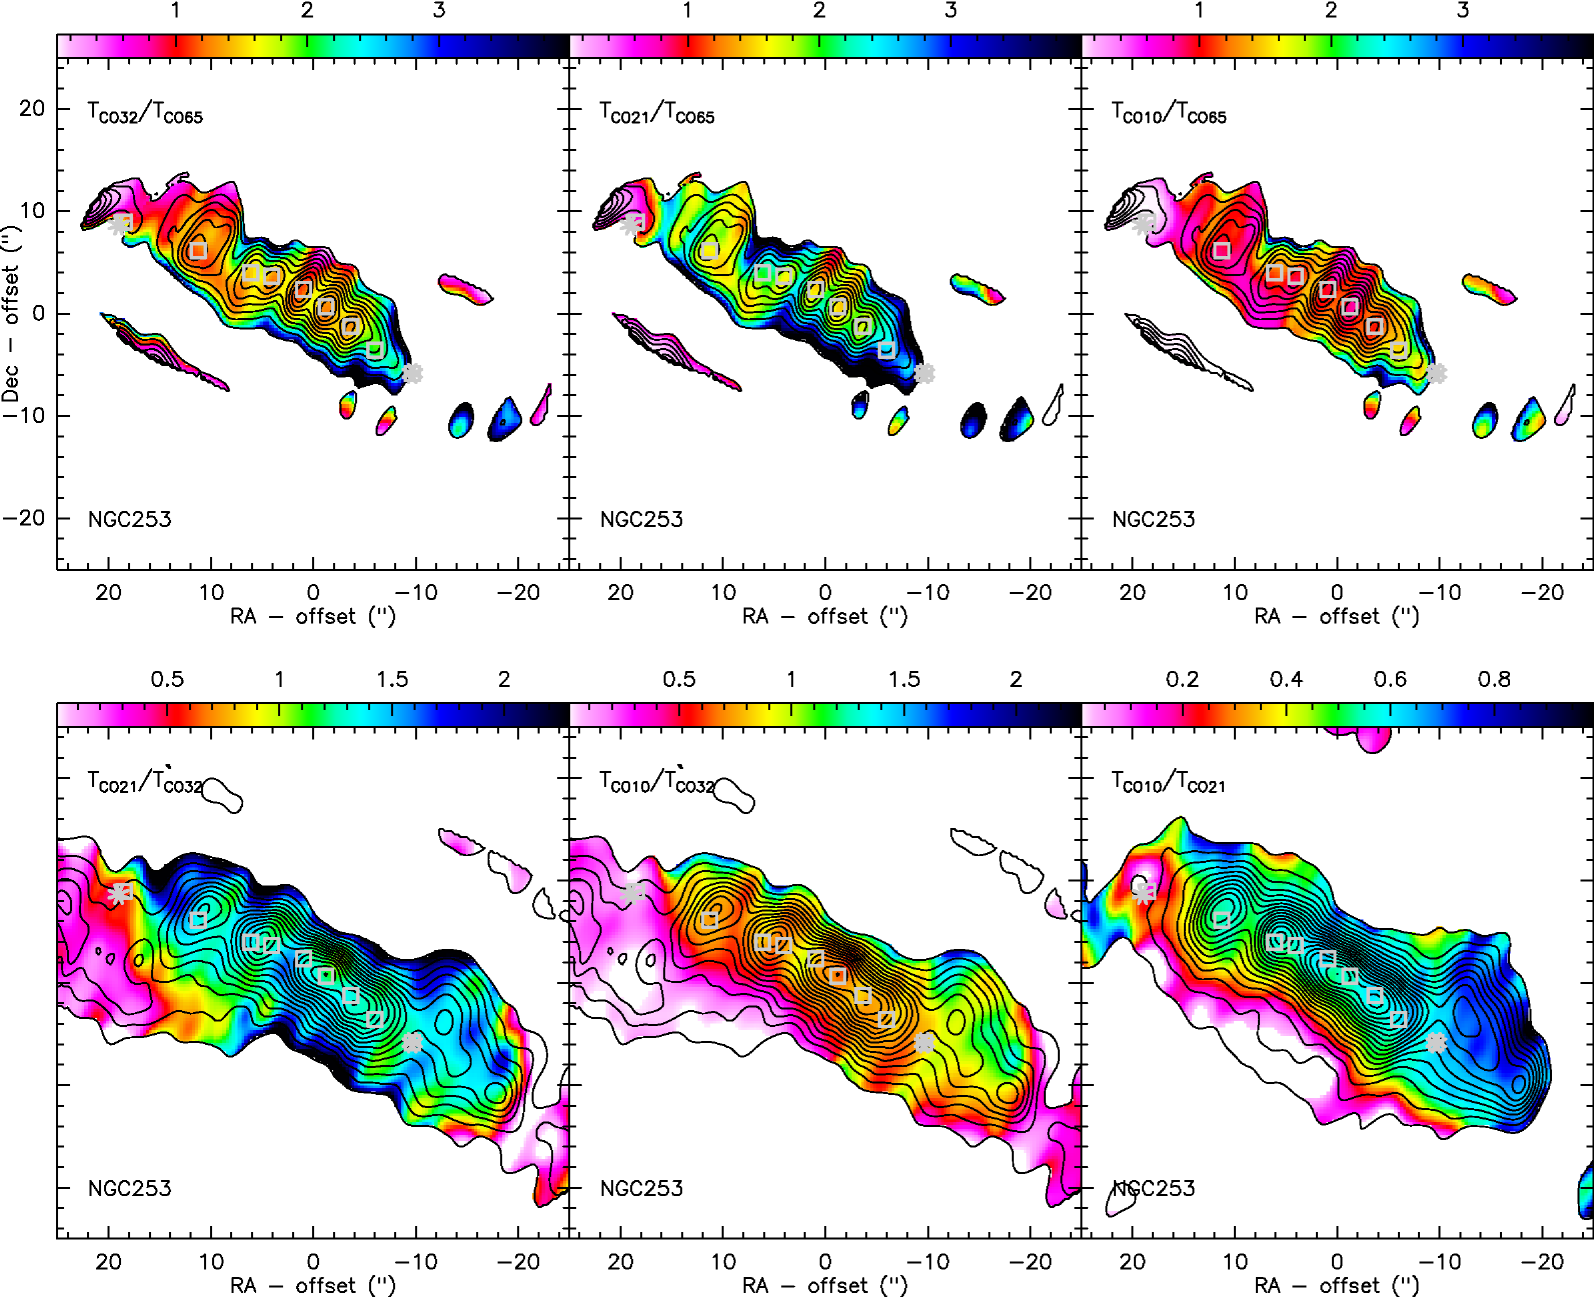
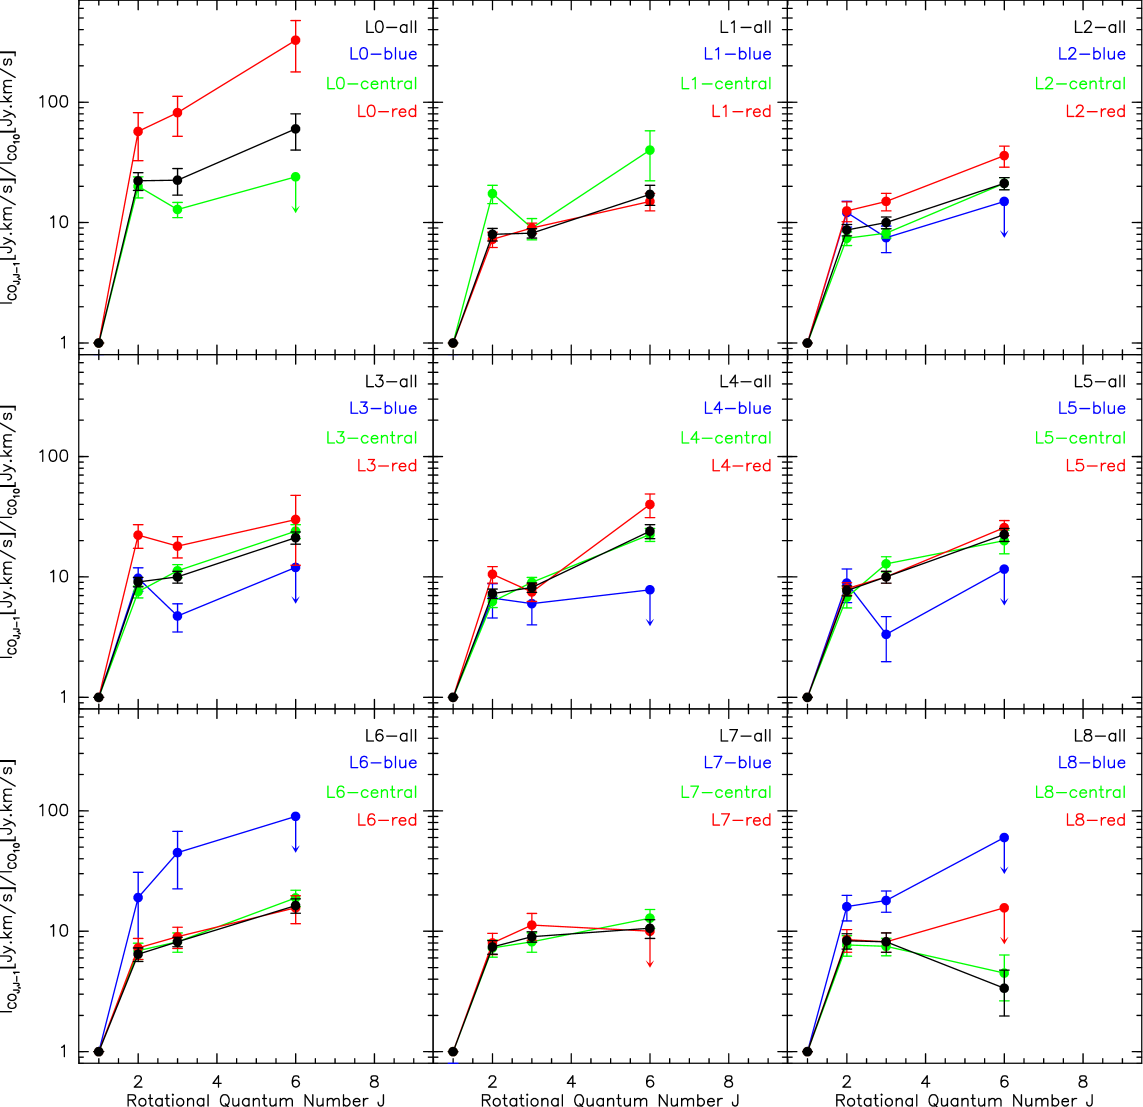
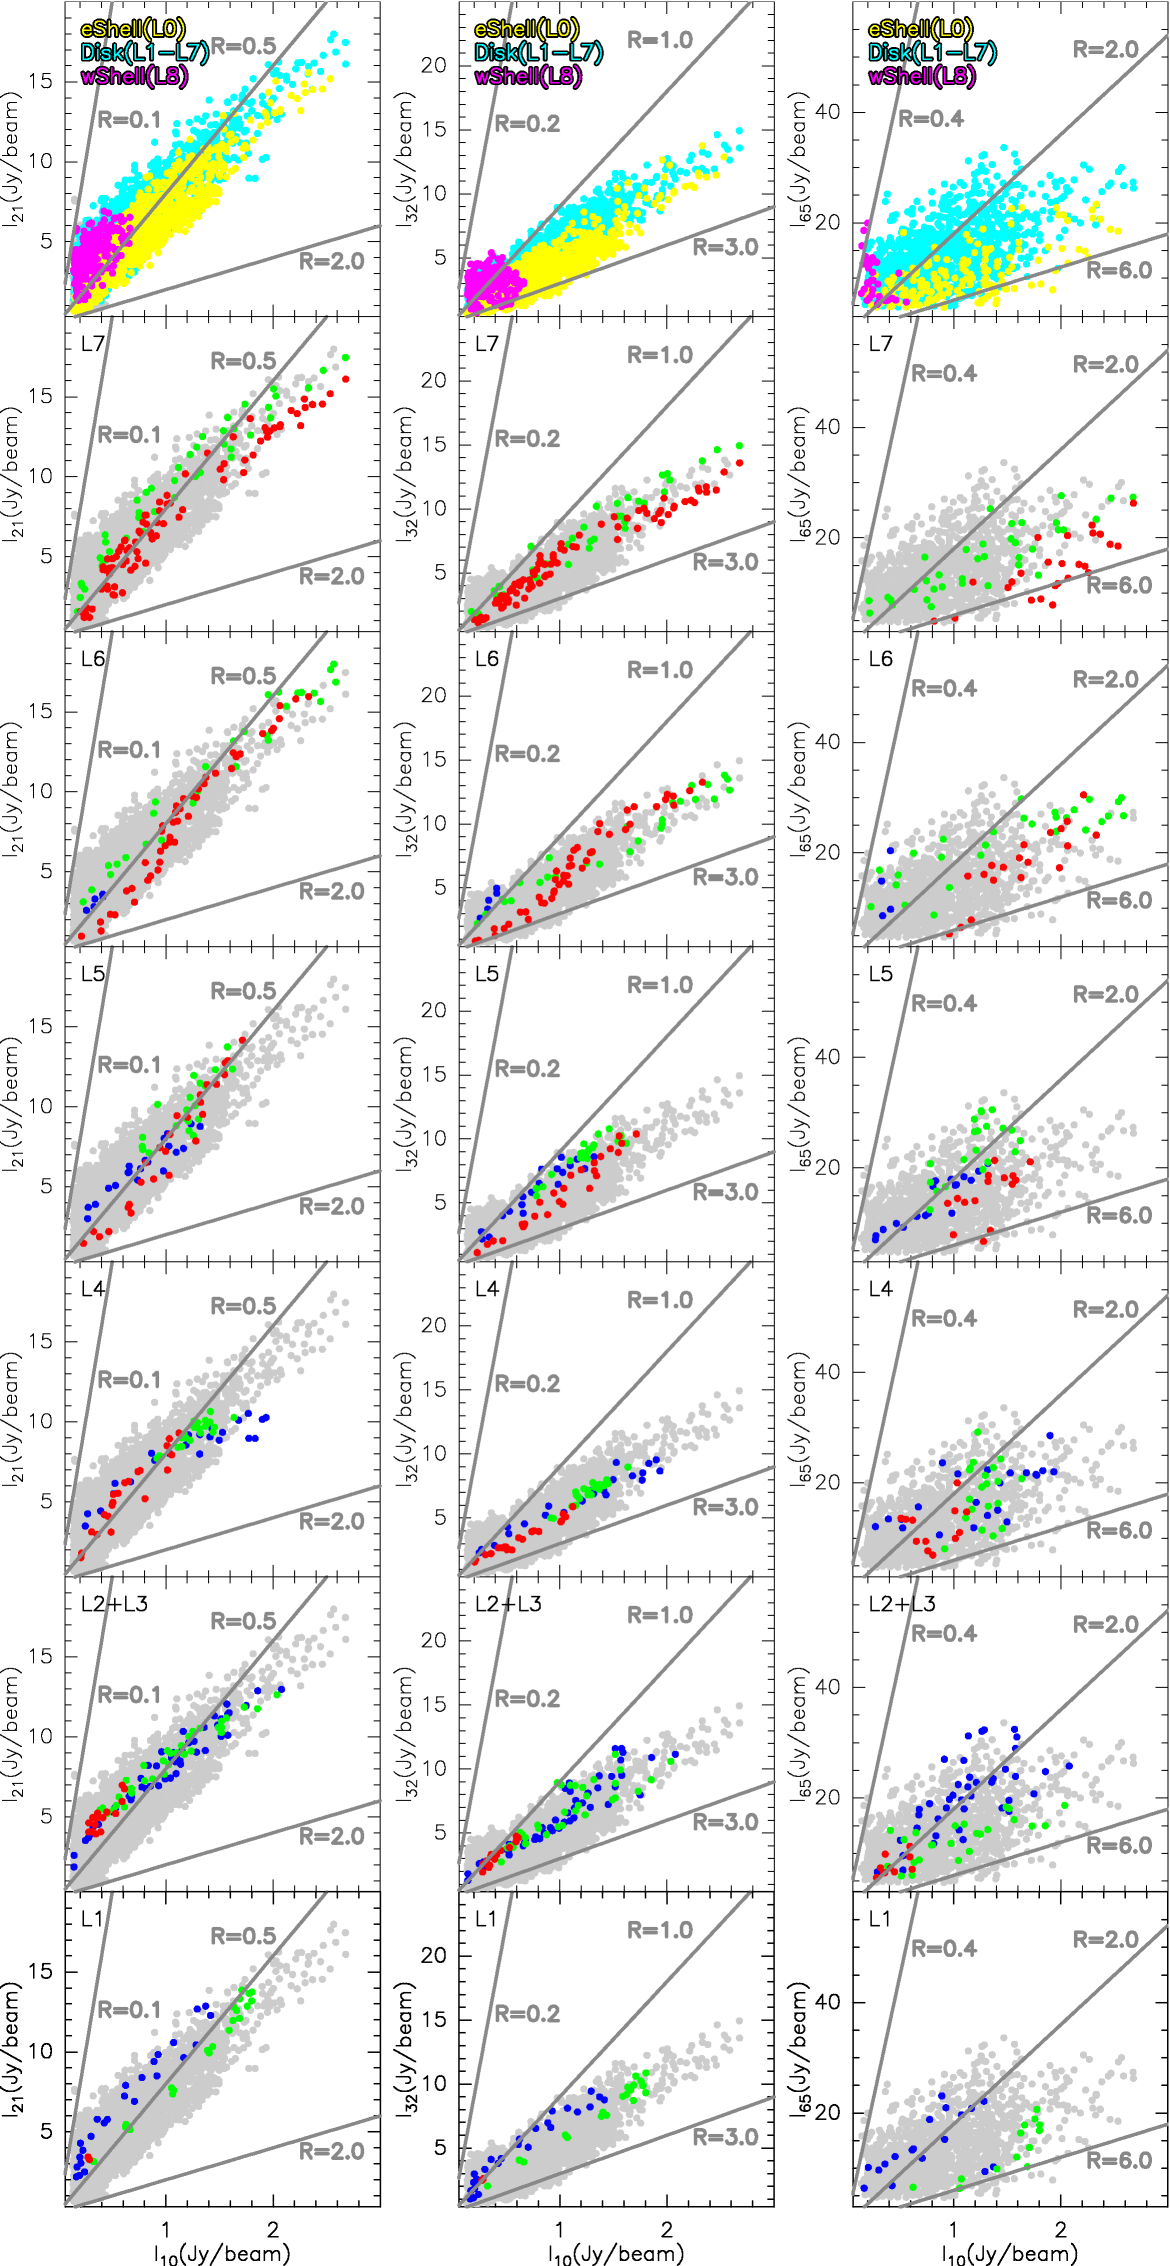
We calculated the brightness temperature ratios between 12CO(J=6–5), 12CO(J=3–2), 12CO(J=2–1) and 12CO(J=1–0), using different methods, first converting the intensities from Jansky to Kelvin. Fig. 8 shows the ratios between the spectrally integrated intensity maps from Fig. 4, while Table 5 lists the ratios determined from the line profiles shown in Fig. 7. We plot the individual line SEDs for each component and Gaussian component in Fig. 9. We also compare the line intensities sampled in bins of 1′′ and 12 km s-1 in Fig. 10 by using a mask for the different regions (being roughly twice the synthesized beam size); for components L1 to L7 we plot the different velocities in different colors to explore a possible dependence on velocity.
Along the disk, the spectrally integrated ratios (Fig.8) show values of: R1-2, R2-3, R0.5-1.5, R1-1.5, R0.5-1.5 and R0.3-0.7, the range of which is lower than the values determined directly from the line components (Table 5). As Fig. 9 and Fig. 10 clearly indicate, there are indeed differences between the three different line components for each peak that appear to be identical in the different line transitions. This highlights the fact that at each position we probably see an ensemble of different GMCs which likely exhibit slightly different excitation conditions (see also Table 6). However, the differences are not very large so probably all of these GMCs are exposed to the same major heating source, the starburst and its winds/shocks.
While we cannot identify any significant difference in the ratios between the peaks along the disk (see also Columns 3-9 in Table 5 & 6, as well as Fig. 9), the temperature ratios are significantly lower close to the eastern shell SB2 indicating much warmer (and/or denser) material there (similar to the continuum emission) and slightly higher ratios toward the western shell SB1 indicating less warm (or less dense) gas there (see Figs. 8, 9 and 10). This difference in gas excitation between the two shells is quite surprising if one assumes a similar nature/origin of the two. However, there are some indications that the two shells are probably caused by different mechanisms: SB2 is associated with winds from a stellar cluster while SB1 is associated with a supernova remnant666Although one single supernova remnant is probably not enough to create SB1 alone.. The energetic output of a supernova is probably quite different from the stellar winds from star-formation/star-bursts in a stellar cluster so that a different feedback to the surrounding molecular gas is to be expected (see also Section 3.2.4). Another explanation could be that these shells are at different evolutionary stages, although they appear to exhibit a similar extent and expansion velocities (see Sakamoto et al., 2006; Bolatto et al., 2013) if one believes that SB1 is an expanding superbubble. As Sakamoto et al. (2011) expressed doubts about SB1 being a superbubble as opposed to SB2, SB1 might have a much different origin hence naturally explaining the different ratios and subsequently different excitation conditions in these two regions.
However, we have to apply some caution in interpreting these ratios as we do not have exactly the same uv-coverages in the different 12CO transitions, with 12CO(J=6–5) probably being the least well sampled and the least sensitive. We already discussed the effect of spatial filtering flux in a previous section and found that resolution effects are possibly minor along the disk but could be more important in the region of the shells. Therefore, we think that the ratios along the disk are likely very representative while for the shells we probably need more sensitive observations of a larger field with better uv coverage, as is becoming possible with ALMA.
3.2.3 LVG Analysis
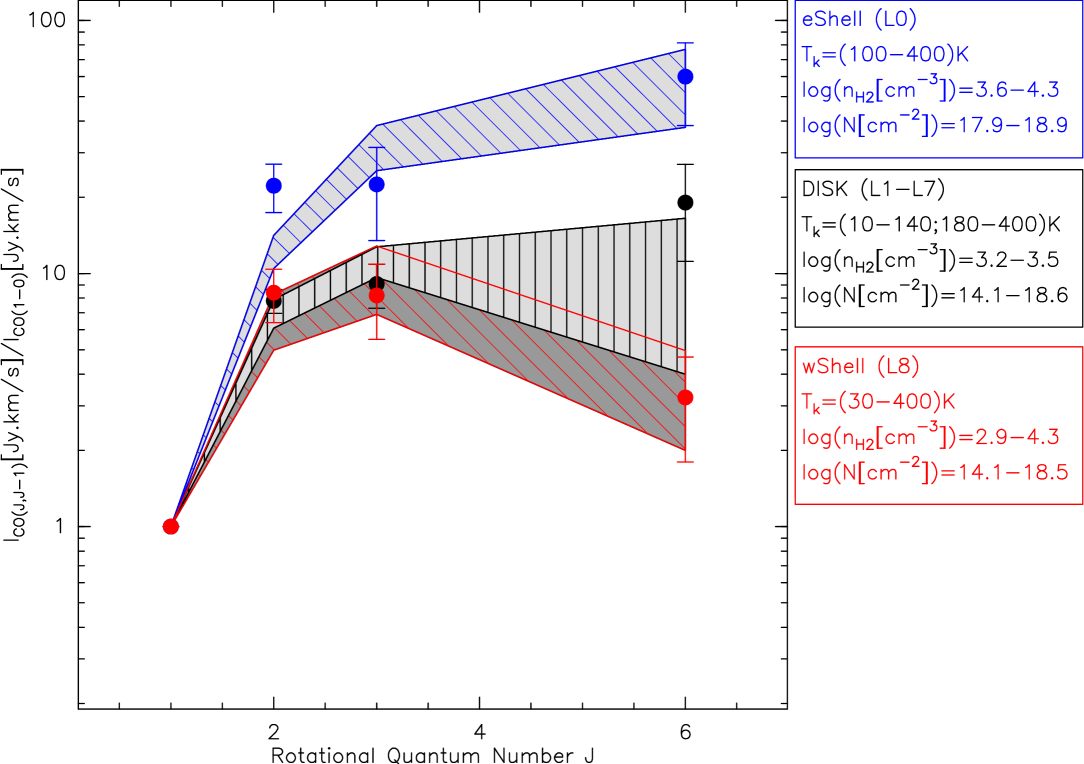
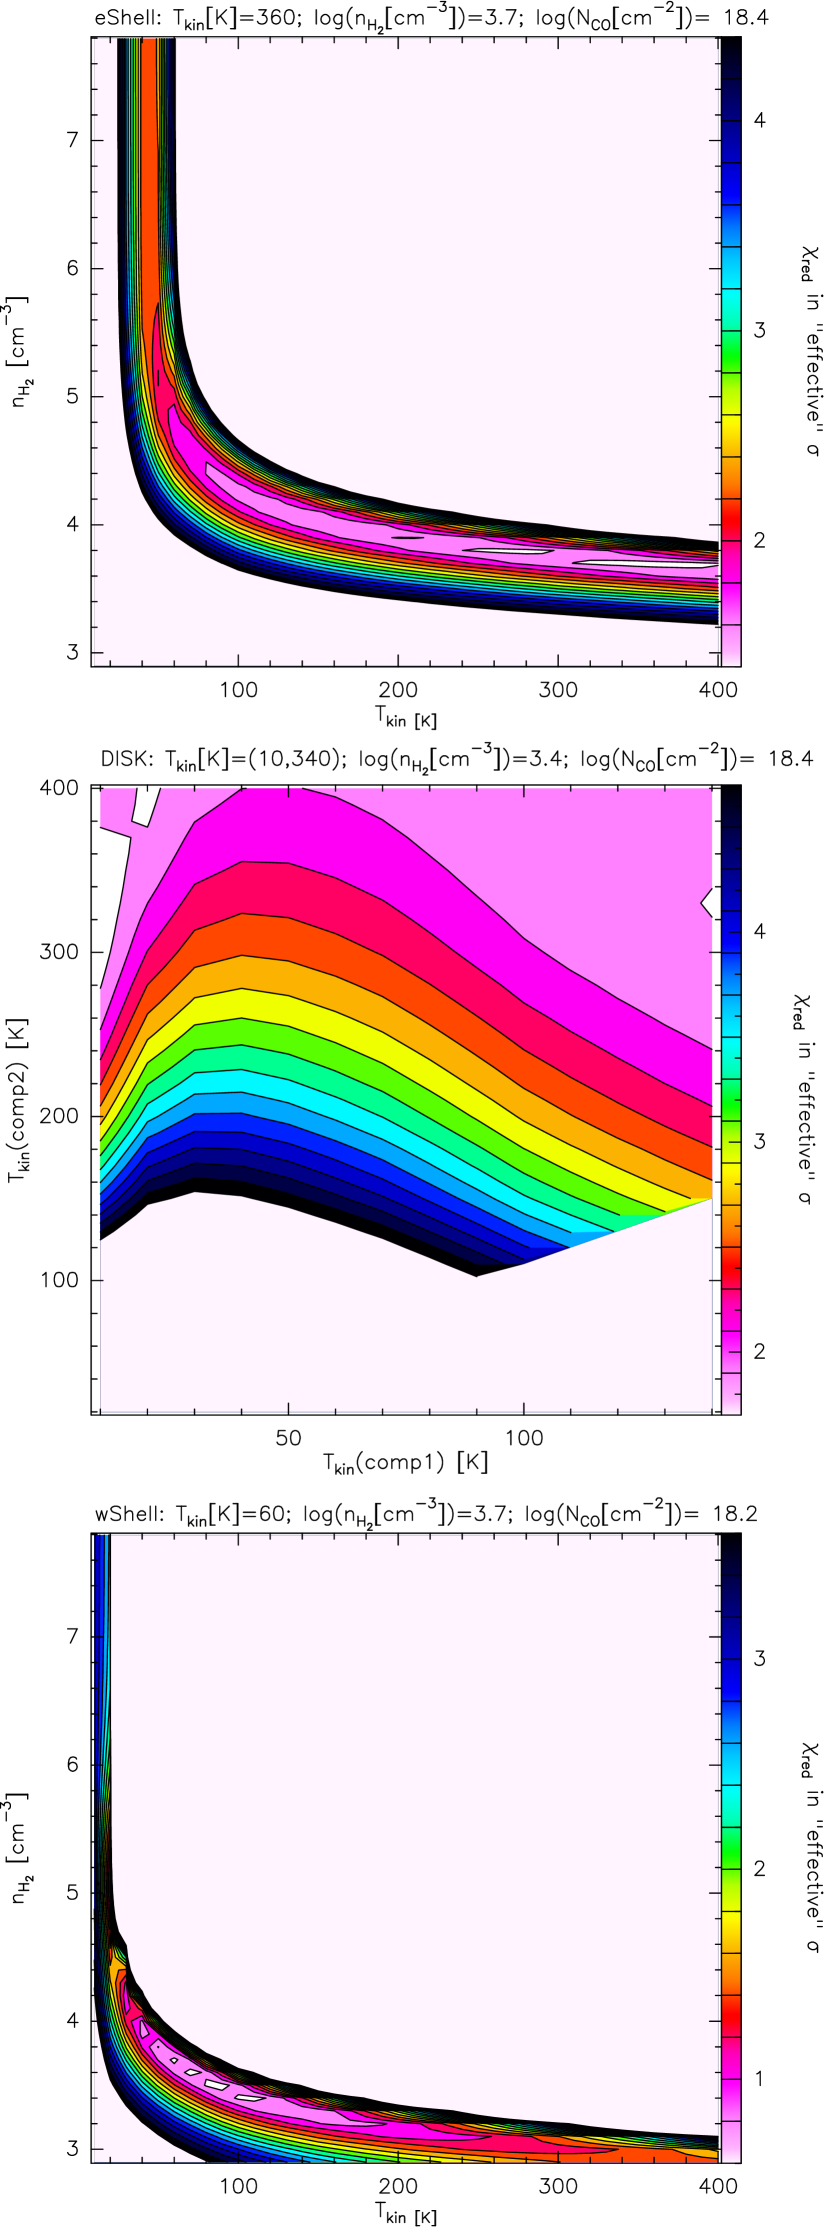
We conducted an LVG analysis with the RADEX code (see van der Tak et al., 2007) applying a reduced minimization method to fit the basic excitation conditions of the molecular gas in the western and eastern shells and the (averaged) disk. We first considered a one phase gas model, i.e., gas at one kinetic temperature, one H2 density and one CO column density. We thereby varied the temperatures by T10-400 K, the densities by n103-108 cm-3 and the column densities by N1014-1019 cm-2 for a line width of dv=100 km s-1 (see also Leroy et al., 2015) and a uniform sphere, linearly splitting up the parameter space in 41 “bins” with steps of 10 K for Tkin and 0.1 dex for n and NCO. All reduced results for which the modelled line ratios are within at least 1-1.5 of the observed line ratios (i.e., ) were considered as acceptable solutions. With these criteria we could fit the western and eastern shell quite reasonably, while we did not find any solution for the disk that could reproduce the high 12CO(J=6–5)-to-12CO(J=1–0) ratio. This is in agreement with previous findings on the CO line SED of NGC 253 by different groups based on single-dish and/or satellite (Herschel) observations (e.g., Rosenberg et al., 2014; Hailey-Dunsheath et al., 2008). One approach is to allow for a two phase gas model by assuming two different kinetic temperatures with a upper limit of the “cold” component at around Tkin,cold=150 K and TTkin,cold. The range of solutions found for the excitation conditions in the three different regions of NGC 253 are shown in Fig. 11. The respective range in kinetic temperatures for the two component model (middle panel) for a given volume and column density as well as the kinetic temperatures and column densities for the one component models for a given density (upper and lower panel) are plotted in Fig. 12.
Disk: As mentioned just before, a one temperature phase model largely underestimates the 12CO(J=6–5) emission similar to previous findings (e.g., Rosenberg et al., 2014; Hailey-Dunsheath et al., 2008). Our best fit model suggests a very cold gas component at around 10 K and a very warm one at around 340 K with H2 gas densities for both of n=103-104 cm-3 and CO column densities of N1018cm-2 (see Fig. 12). However, as can be seen in Fig. 11 and is indicated by the mediocre values in Fig. 12, we find a large range of excitation conditions with similarly “good” values as the best-fit model, certainly due to the fact that four observed lines are not sufficient to constrain well the parameter space with four free variables. Furthermore, although the best-fit models fit reasonably well the observed data, the modeled line ratios are only within 1.5-2 of the observed ones indicating that a two temperature phase gas model is still insufficient to reproduce the data and the assumption of equal gas and column densities of the two gas phases is too simplistic. However, leaving those as free parameters as well between the two gas phases enforces more observational constraints, i.e., more line transitions and different molecular tracers need to be observed which is out of the scope of this paper.
Rosenberg et al. (2014) indeed argue that they need a three-temperature phase gas model to explain their 12CO ladder, of which the phase-1 low temperature component is heated through PDRs. The phase-2 and 3 components are more likely heated mechanically while heating through cosmic rays seems to be rather negligible based on their models (see next Section but also Paglione & Abrahams, 2012). The mechanical heating through low-velocity shocks or turbulence is needed to produce the high temperatures throughout the surrounding clouds. PDRs affect only a thin layer of the surrounding molecular clouds and would potentially start to dissociate the CO molecules due to the strong UV-radiation fields (see also: Rosenberg et al., 2014; Goicoechea et al., 2013; Kaufmann & Neufeld, 1996).
Western Shell (L8): Our best-fit solutions suggest for the western shell two main scenarios due to the Tkin-n degeneracy of 12CO in the excitation: either the molecular gas is at 1.) rather high kinetic temperatures around 300 K but low H2 gas densities around 103 cm-3, or 2.) at lower kinetic temperatures around 60 K but high H2 gas densities around 5103 cm-3 (see Fig. 11 and Fig. 12). Only in the low-Tkin/high-n(H2) case, the CO column density can be well constrained and show values of about 10¹8 cm-2, similar to the disk and the eastern shell (see Fig. 12), while the high-Tkin/low-n(H2) case leaves open almost the entire range of column densities sampled here. The HCN emission has been found to be stronger (by a factor of 3 in integrated fluxes) in the western shell compared to the eastern shell by Leroy et al. (2015). This is likely incompatible with the case in which the gas in the western shell is significantly less dense than in the eastern shell, favoring hence the low-Tkin/high-n(H2) case. The kinetic temperature in this case of 60 K is in between the cold (T10 K) and hot (T340 K) gas component found for the disk but much lower than found for the eastern shell (see next paragraph).
Eastern Shell (L0): The best fit solution for the eastern shell suggests higher kinetic temperatures (Tkin=360 K) than the disk and the western shell but at similar H2 densities (n cm-3) and CO column densities (N1018 cm-2). However, it seems that the best fit model slightly underestimates the 12CO(J=2–1) emission as indicated by the lowest of 1.2 which means that not all modelled line ratios lie within 1 of the observed ones. We also ran a two-temperature phase gas model for the eastern shell similar to the disk but we did not find a solution in which the 12CO(J=2–1) emission was correctly reproduced. The best fit solutions of the two-temperature phase models largely resembled the one-temperature phase models so that we hence decided to keep the one-temperature phase model for the eastern shell for simplicity reasons. Either we are seeing (part of) the warm component from the disk only here or additional excitation mechanisms have to be considered.
3.2.4 Comparison to other multi-transition CO studies
Studies of spatially resolved, multi-transition () 12CO
emission in galaxies are still very rare. Most of them are conducted
with single dish telescopes that provide sufficient angular resolution
to resolve GMC scales (50-100pc) only in the most nearby
galaxies or our own galaxy, if at all. We picked several 12CO
ladder studies in order to compare them to the results obtained on
NGC 253
Topal et al. (2014); Meijerink et al. (2013); Goicoechea et al. (2013); Danielson et al. (2011); van der Werf et al. (2010); Riechers et al. (2010); Carilli et al. (2010); Emprechtinger et al. (2009). The
studied objects span from GMCs in the galactic center, over nearby
starburst and/or AGN galaxies such as NGC6946, M82 and NGC 1068 to
ULIRGs like Arp 220 and Mrk 231 and
high-redshift galaxies.
Disk: Interestingly, all studies, i.e., for all (active)
environments in our vicinity up to the high-redshift universe, seem to
need a multi-phase gas model (with at least a high and lower
temperature gas component) to be able to reproduce the observed
multi-transition CO emission
(e.g., Topal et al., 2014; Goicoechea et al., 2013; Danielson et al., 2011; van der Werf et al., 2010; Riechers et al., 2010; Carilli et al., 2010; Emprechtinger et al., 2009; Weiß et al., 2005),
similar to the central disk in NGC 253. Also, most of them find that
besides photoelectric heating from UV radiation in PDRs also
mechanical heating through low-velocity shocks have to be considered
as almost equally dominant mechanism to heat the molecular gas
(see also García-Burillo et al., 2014; Krips et al., 2011; García-Burillo et al., 2010). In all these regions,
cosmic rays do not seem to contribute significantly to the heating of
the warm molecular gas component, agreeing with the findings by
Rosenberg et al. (2014) (see also Meijerink et al., 2011). On the other hand, NGC 253
has known supernova explosions at a rate of 0.2 yr-1
(see Rampadarath et al., 2014; Paglione & Abrahams, 2012) and, more importantly, a median cosmic
ray ionisation rate of 6 Paglione & Abrahams (2012). This is a factor of 100-1000
higher than found in the vicinity of Sgr A⋆ Goto et al. (2008)
and of the order of the X-ray(/cosmic ray) ionisation rates of
10-13s-1 found in the (U)LIRGs Arp 220 and NGC 4418
González-Alfonso et al. (2013). Goicoechea et al. (2013) mention that already a cosmic ray
ionisation rate of can heat
the gas up to 10 K and Paglione & Abrahams (2012) conclude that “cosmic ray
penetration and heating is an important contributor to warm
temperatures observed in starburst galaxies”. Although the
simulations conducted by Rosenberg et al. (2014) favor a minor role of cosmic ray
heating, it probably cannot be completely excluded at this
point. Moreover, in the case of the ULIRG Mrk 231, van der Werf et al. (2010) find
indications that, besides PDR heating, X-ray(/cosmic ray) heating is a
significant contributor in order to explain their two-temperature
phase model of the multi-transition CO emission although they do not
include shock models in their simulations. On the other hand,
Rangwala et al. (2011) find in the case of Arp 220 that mechanical heating
should be largely dominating over that by PDR, XDR and cosmic rays, at
least for the warm molecular gas. This result might be logical as
Arp 220 is a known major merger in an evolved merging stage so that
mechanical heating should be quite significant. Although in a slightly
earlier merger stage than Arp 220, Meijerink et al. (2013) argue for a (low
velocity, C-type) shock domination of the gas heating in NGC 6240 as
well, similar to Arp 220.
In contrast to NGC 1068, whose molecular gas in its central
200pc disk is most likely dominated by a combination of (low
velocity) shocks and a giant XDR (e.g., Krips et al., 2011; García-Burillo et al., 2014; Viti et al., 2015),
the line transition ratios in NGC 253 decrease (assuming CO(Jupper-Jlower)/CO(J=10); with J) while
those for NGC 1068 increase. This is in good agreement with
theoretical predictions of the 12CO line ratios for XDRs and PDRs
Meijerink et al. (2006), even in the case of a strong cosmic ray ionisation
field in addition to a PDR. Another interesting difference to note is
that NGC 1068 indeed shows variations of its line ratios the closer
one gets to the nucleus (central 50 pc or so) as revealed by recent
ALMA Observations (see García-Burillo et al., 2014; Viti et al., 2015) while the disk (central
500 pc) appears to be dominated by the same heating source. Hence, a
starburst influences its surrounding gas on a much larger scale than
an AGN seems to do.
Shells: Based on the discussion of the heating mechanisms
responsible for the CO ladder in diverse environments, one can draw
some first conclusions on the dominant heating mechanisms for the two
shells by simple comparison. As mentioned before, probably only
mechanical energy from shocks or turbulent gas can heat up the bulk of
molecular gas significantly above 50 K, while photo-electric (PDR)
and/or cosmic ray heating dominates the cold to warm gas
component. Our data quite clearly indicate that the eastern shell is
much warmer than the disk and the western shell while being at similar
gas and column densities. This could be hence an indication that
shocks might play a much more dominant role in the eastern shell,
associated with a compact stellar cluster, than in the PDR+shock
dominated disk and the western shell which might be connected to a
supernova remnant. It appears rather unlikely that a strong PDR (or
cosmic rays) also has to be considered for the eastern shell which
could explain the stronger emission in the higher-J transitions in it
compared to the disk; the higher-J CO transitions are more dominantly
excited than the lower-J CO transitions.
Our data suggest that the western shell is much colder than the eastern shell and the hot gas component of the disk but is still warmer than the cold gas component of the disk. One conclusion, although certainly quite speculative at this point, is that the cosmic rays from the supernova remnant dominate the gas excitation in the western shell and that the (low-velocity) shocks, if they exist, from the SN explosion have not yet or only very inefficiently heated the gas to the same high temperatures as found in the (warm component of the) disk or the eastern shell. However, given the similar extent of both shells, it is not intuitive why shocks play such a minor role in the western shell compared to the eastern shell and the disk. Also, while it is true that SN have been identified through radio observations in the western shell, the lack of radio detections in the eastern shell does not exclude SN in it. Further observations of either 12CO or other shock and cosmic ray tracers have to be conducted to unveil the heating mechanisms in these shells at a sufficient confidence level.
4. Summary
We presented new interferometric observations of the extended 12CO(J=6–5) line and 686 GHz continuum emission in NGC 253 carried out as a five point mosaic with the SMA. These data were then compared to three lower-J 12CO transitions (J=1–0, J=2–1, J=3–2) and continuum emission at lower frequencies at similar angular resolution of 4′′ observed with ALMA and the SMA.
Five of the eight 12CO line peaks find counterparts in the mm and submm continuum emission underlying the thermal nature of the continuum emission from dust as suggested by the spectral index of 3 determined from the different frequencies. The continuum emission at the lowest frequency of 115 GHz appears to exhibit already a significant contribution from non-thermal synchrotron and thermal free-free processes (between 15-80%) as supported by the spectral indices derived at cm wavelengths. We derive dust temperatures of 10-25 K for the different continuum peaks in the disk with low opacities of 0.2 at 686 GHz. However, we also find indications for a hotter dust component at least in the inner disk of NGC 253 with dust temperatures exceeding 60 K and at much larger opacities of around 4 at 686 GHz. The latter dust component approaches the values found for ULIRGs such as Arp 220. We estimate a total dust mass of a few 106 M⊙ for the entire disk, splitting up into 104-10 for the GMCs at the individual continuum peaks. Based on the gas masses of each of the peaks, we find a gas-to-dust mass ratio of the order of 100-1000.
The 12CO(J=6–5) emission follows nicely the distribution of the molecular gas seen in the lower-J transitions with roughly eight peaks along the disk. Only few 12CO(J=6–5) emission is detected close to the two shells emerging from the edges of the central disk. While the 12CO line transition ratios do not vary significantly along the disk, the two shells show quite different ratios not only compared to the disk but also to each other. The line ratios found along the disk seem to necessitate a two-phase gas model in agreement with previous studies on NGC 253 as well as multiple-12CO observations on other active galaxies. This two-phase gas model is mainly based on two temperatures, a cool gas component at around Tkin=10 K and hot gas component at around Tkin=300 K. Following a similar argumentation to previous publications, the lower temperature gas is probably dominated by the PDR while the higher temperature gas is a consequence of the shocks found throughout the disk (see also Rosenberg et al., 2012, 2014). However, a possible contribution from cosmic rays, given the high cosmic ray ionisation rate within the disk, cannot be completely excluded for either temperature phase at this point although some simulations indicate only a minor role of cosmic ray heating (e.g., Rosenberg et al., 2014). While the eastern shell exhibits even warmer gas (T300 K) with respect to the hot gas (T300 K) component of the disk, the western shell contains gas much cooler (T60 K) than the eastern shell but somewhere in between the two temperature gas components of the disk (T10 K and T300 K); the gas densities (n(H2)5103 cm-3) and column densities (N(CO)1018 cm-2) are very similar between the two shells and the disk. This reflects either a different evolutionary stage of the shells, an additional, different or more efficient heating mechanism in the eastern shell, a very different nature of these two structures, or a combination thereof. However, follow-up observations are mandatory to put our findings for the shells onto a more solid basis.
References
- Aladro et al. (2011) Aladro, R., Martín, S., Martín-Pintado, J., Mauersberger, R., Henkel, C., Ocaña Flaquer, B. & Amo-Baladrón, M. A., 2011, A&A, 535, 84
- Bayet et al. (2004) Bayet, E., Gerin, M., Phillips, T. G. & Contursi, A., 2004, A&A, 427, 45
- Bendo et al. (2015) Bendo, G. J.; Beswick, R. J.; D’Cruze, M. J.; Dickinson, C.; Fuller, G. A.; Muxlow, T. W. B., 2015, MNRAS, 450, 80
- Beuther et al. (2006) Beuther, H., Zhang, Q., Reid, M. J., et al, 2006, ApJ, 636, 323
- Bolatto et al. (2013) Bolatto, A., et al., Nature, 499, 450
- Bradford et al. (2003) Bradford, C. M., Nikola, T., Stacey, G. J., Bolatto, A. D., Jackson, J. M., Savage, M. L., Davidson, J. A. & Higdon, S. J., 2003, ApJ, 586, 891
- Carilli et al. (2010) Carilli, C. L., et al., 2010, ApJ, 714, 1407
- Carilli et al. (2002) Carilli, C. L., Kohno, K., Kawabe, R., Ohta, K., Henkel, C., Menten, K. M., Yun, M. S., et al., 2002, AJ, 123, 1838
- Danielson et al. (2011) Danielson, A.L.R., et al., 2011, MNRAS, 410, 1687
- Dayal et al. (2010) Dayal, P.; Hirashita, H.; Ferrara, A., 2010, MNRAS, 403, 620
- Draine & Lee (1984) Draine, B. T.; Lee, H. M., 1984, ApJ, 285, 89D
- Emprechtinger et al. (2009) Emprechtinger, M., et al., 2009, A&A, 496, 731
- Fabbiano & Trinchierie (1984) Fabbiano, G. & Trinchieri, G., 1984, ApJ, 286, 491
- García-Burillo et al. (2000) García-Burillo, S.; Martín-Pintado, J.; Fuente, A.; Neri, R., 2000, A&A, 355, 499
- García-Burillo et al. (2010) García-Burillo, S.; Usero, A.; Fuente, A.; Martín-Pintado, J.; Boone, F.; Aalto, S.; Krips, M.; Neri, R.; Schinnerer, E.; Tacconi, L. J., 2010, A&A, 519, 2
- García-Burillo et al. (2014) García-Burillo, S.; Combes, F.; Usero, A.; Aalto, S.; Krips, M.; Viti, S.; Alonso-Herrero, A.; et al. accepted for publication in A&A, eprint arXiv:1405.7706
- Goicoechea et al. (2013) Goicoechea, J.R., et al., 2013, ApJ 769, L13
- González-Alfonso et al. (2013) González-Alfonso, E., et al., 2013, A&A, 550, 25
- Goto et al. (2008) Goto, M.; Usuda, T.; Nagata, T.; Geballe, T. R.; McCall, B. J.; Indriolo, N.; Suto, H.; Henning, T.; Morong, C. P.; Oka, T., 2008, ApJ, 688, 306
- Güsten et al. (2006) Güsten, R., Philipp, S. D., Wei§, A. & Klein, B., 2006, A&AL, 454, 115
- Hailey-Dunsheath et al. (2008) Hailey-Dunsheath, S.; Nikola, T.; Stacey, G. J.; Oberst, T. E.; Parshley, S. C.; Bradford, C. M.; Ade, P. A. R.; Tucker, C. E., 2008, ApJ, 689, L109
- Heckman et al. (1990) Heckman, T. M., Armus, L. & Miley, G.K., 1990, ApJS, 74, 833
- Heesen et al. (2011) Heesen, V.; Beck, R.; Krause, M.; Dettmar, R.-J., 2011, A&A, 535, 79
- Hirashita et al. (2014) Hirashita, H.; Ferrara, A.; Dayal, P.; Ouchi, M., 2014, MNRAS, 443, 1704
- Houghton et al. (1997) Houghton, S.; Whiteoak, J. B.; Koribalski, B.; Booth, R.; Wiklind, T.; Wielebinski, R., 1997, A&A, 325, 923
- Kaufmann & Neufeld (1996) Kaufmann, M.J., Neufeld, D.A., 1996, ApJ, 456, 611
- Knudsen et al. (2007) Knudsen, K. K., Walter, F., Weiss, A., Bolatto, A., Riechers, D. A. & Menten, K., 2007, ApJ, 666, 156
- Koribalski et al. (2004) Koribalski, B.S.; et al., 2004, AJ, 128, 16
- Krips et al. (2011) Krips, M., Martín, S., Eckart, A., et al., 2011, ApJ, 736, 37
- Krips et al. (2008) Krips, M., Neri, R., García-Burillo, S., et al., 2008, ApJ, 677, 262
- Leroy et al. (2015) Leroy, A. K., et al., 2015, ApJ, 801, 25
- Martín et al. (2009) Martín, S., Martín-Pintado, J. & Viti, S., 2009, ApJ, 706, 1323
- Martín et al. (2006) Martín, S., Mauersberger, R., Martín-Pintado, J., Henkel, C. & García-Burillo, S., 2006, ApJS, 164, 450
- Matsushita et al. (2009) Matsushita, S., Iono, D., Petitpas, G.R., et al., 2009, ApJ, 693, 56
- Meier et al. (2015) Meier, D., S.; 2015, ApJ, 801, 63
- Meijerink et al. (2013) Meijerink, R., et al., 2013, ApJ, 762, L16
- Meijerink et al. (2011) Meijerink, R., Spaans, M., Loenen, A.F., & van der Werf, P.P., 2011, A&A, 525, 119
- Meijerink et al. (2006) Meijerink, R., Spaans, M., & Israel, F.P., 2006, ApJ, 650, L103
- Minh et al. (2007) Minh, Y. C., Muller, S., Liu, S.-Y. & Yoon, T. S., 2007, ApJ, 661, L135
- Mouhcine et al. (2005) Mouhcine, M.; Ferguson, H. C.; Rich, R. M.; Brown, T. M.; Smith, T. E., 2005, ApJ, 633, 810
- Müller-Sánchez et al. (2010) Müller-Sánchez, F.; González-Martín, O.; Fernández-Ontiveros, J. A.; Acosta-Pulido, J. A.; Prieto, M. A., 2010, ApJ, 716, 1166
- Nakashima et al. (2007) Nakashima, J.-I.; Fong, D.; Hasegawa, T.; et al., 2007, AJ, 134, 2035
- Ott et al. (2005) Ott, J.; Weiss, A.; Henkel, C.; Walter, F., 2005, ApJ, 629, 767
- Papadopoulos et al. (2010) Papadopoulos, P.P.; van der Werf, P.; Isaak, K.; Xilouris, E. M., 2010, ApJ 715, 775
- Papadopoulos et al. (2007) Papadopoulos, Padeli P.; Isaak, Kate G.; van der Werf, Paul P., 2007, ApJ 668, 815
- Paglione & Abrahams (2012) Paglione, T.A.D., & Abrahams, R.D., 2012, ApJ, 755, 106
- Peel et al. (2011) Peel, M. W.; Dickinson, C.; Davies, R. D.; Clements, D. L.; Beswick, R. J., 2011, MNRAS, 416, 99
- Qi et al. (2006) Qi, C.; Wilner, D.J.; Calvet, N.; 2006, ApJ, 636, L157
- Rampadarath et al. (2014) Rampadarath, H.; Morgan, J.S.; Lenc, E., Tingay, S.J., 2014, AJ, 147, 5
- Rangwala et al. (2011) Rangwala, N. et al., 2011, ApJ, 743, 94
- Rekola et al. (2005) Rekola, R.; Richer, M. G.; McCall, M.L.; Valtonen, M. J.; Kotilainen, J. K.; Flynn, C., 2005, MNRAS, 361, 330
- Remy-Ruyer et al. (2014) Rémy-Ruyer, A.; et al., 2014, A&A, 563, 31
- Riechers et al. (2010) Riechers, D., et al., 2010, ApJ, 729, L131
- Rolffs et al. (2011) Rolffs, R.; Schilke, P.; Zhang, Q.; Zapata, L., 2011, A&A, 536, 33
- Rosenberg et al. (2012) Rosenberg, M.J.F, van der Werf, P.P., Israel, F.P., 2012, A&A, 550, 12
- Rosenberg et al. (2014) Rosenberg, M. J. F.; Kazandjian, M. V.; van der Werf, P. P.; Israel, F. P.; Meijerink, R.; Weiß, A.; Requena-Torres, M. A.; Güsten, R., 2014, A&A, 564, 126
- Sakamoto et al. (2011) Sakamoto, K.; Mao, R.-Q.; Matsushita, S.; Peck, A.B.; Sawada, T.; Wiedner, M. C., 2011, ApJ, 735, 19
- Sakamoto et al. (2006) Sakamoto, K.; Ho, P. T. P.; Iono, D., et al, 2006, ApJ, 636, 685
- Scoville et al. (2015) Scoville, N., et al., 2015, ApJ, 800, 70
- Sliwa et al. (2013) Sliwa, K.; Wilson, Ch. D.; Krips, M.; Petitpas, G. R.; Iono, D.; Juvela, M.; Matsushita, S.; Peck, A.; Yun, M., accepted for publication in ApJ, arXiv:1309.1144
- Storey & Hummer (1995) Storey, P. J.; Hummer, D. G., 1995, MNRAS, 272, 41S
- Stutzki & Guesten (1990) Stutzki, J.; & Guesten, R., 1990, ApJ, 356, 513
- Telesco & Harper (1980) Telesco, C. M.; Harper, D. A., 1980, ApJ, 235, 392
- Topal et al. (2014) Topal, S.; Bayet, E.; Bureau, M.; Davis, T. A.; Walsh, W., 2014, MNRAS, 437, 1434
- Ulvestad & Antonucci (1997) Ulvestad, J.S., & Antonucci, R.R.J., ApJ, 488, 621
- van der Tak et al. (2007) van der Tak, F. F. S., Black, J. H., Schöier, F. L., Jansen, D. J., & van Dishoeck, E. F. 2007, A&A, 468, 627
- van der Werf et al. (2010) van der Werf et al., 2010, A&A, 518, L42
- Viti et al. (2015) Viti, S., et al., 2014, A&A, 570, 28
- Weiß et al. (2005) Weiß, A.; Walter, F.; Scoville, N. Z., 2005, A&A, 438, 533
- Wilson et al. (2014) Wilson, C.D.; Rangwala, N.; Glenn, J.; Maloney, P.R.; Spinmiglio, L., & Pereira-Santaella, M.; 2014, ApJ, 789, L36
- Xu et al. (2014) Xu, C. K.; Cao, C.; Lu, N.; Gao, Y.; van der Werf, P.; Evans, A. S.; Mazzarella, J. M.; et al. 2014, ApJ, 787, 48
- Xu et al. (2015) Xu, C. K.; et al., 2015, ApJ, 799, 11
- Zapata et al. (2013) Zapata, L. A.; Loinard, L.; Rodríguez, L. F.; Hernández-Hernández, V.; Takahashi, S.; Trejo, A.; Parise, B., 2013, ApJ, 764, L14
- Zubko et al. (2004) Zubko, V.; Dwek, E.; Arendt, R.G., 2004, ApJS, 152, 211
- Zubko et al. (1996) Zubko, V. G.; Mennella, V.; Colangeli, L.; Bussoletti, E., 1996, MNRAS, 282, 1321