Specific Heat of Matter Formed in Relativistic Nuclear Collisions
Abstract
We report the excitation energy dependence of specific heat () of hadronic matter at freeze-out in Au+Au and Cu+Cu collisions at the Relativistic Heavy Ion Collider energies by analyzing the published data on event-by-event mean transverse momentum () distributions. The distributions in finite ranges are converted to distributions of effective temperatures, and dynamical fluctuations in temperature are extracted by subtracting widths of the corresponding mixed event distributions. The heat capacity per particle at the kinetic freeze-out surface is presented as a function of collision energy, which shows a sharp rise in below = 62.4 GeV. We employ the Hadron Resonance Gas (HRG) model to estimate at the chemical and kinetic freeze-out surfaces. The experimental results are compared to the HRG and other theoretical model calculations. HRG results show good agreement with data. Model predictions for at the Large Hadron Collider energy are presented.
pacs:
25.75.-q,25.75.Gz,25.75.Nq,25.75.Dw,12.38.MhI Introduction
The major goal of colliding heavy-ions at the Relativistic Heavy Ion Collider (RHIC) at Brookhaven National Laboratory and the Large Hadron Collider (LHC) at CERN is to study matter at extreme conditions of temperature and energy densities, where quarks and gluons, rather than mesons and baryons, define the relevant degrees of freedom Aoki . This new phase of matter, the Quark-Gluon Plasma (QGP), is governed by the principles of Quantum Chromodynamics (QCD) and is the result of a phase transition from the normal nuclear matter intro1 ; intro2 . Experiments at RHIC and LHC are on the quest to unearth the nature of the QCD phase transition and to get a glimpse of how matter behaves at extreme conditions. The beam energy scan (BES) program at RHIC has been initiated to explore the onset of phase transition by scanning the collision energy over a larger range and to locate the critical point in the QCD phase diagram.
The thermodynamic state of the QCD matter can be specified by the temperature and the chemical potentials , and corresponding to the conserved charges of QCD, namely baryon number (), strangeness (), and electric charge (), respectively. Phase transitions are associated with the transformation of thermodynamic quantities such as pressure, entropy and energy density, as well as a set of response functions, like, specific heat, compressibility and susceptibility with change in , , and . In this article, we discuss the specific heat () of the system produced in heavy-ion collisions at relativistic energies and its behaviour as a function of collision energy.
Specific heat is a thermodynamic quantity characterizing the equation of state of the system. For a system undergoing phase transition, is expected to diverge at the critical point. Temperature fluctuation of the system provides an estimation of . Near the critical point, the specific heat is normally expressed in terms of a power law, , where is the critical temperature and is critical exponent. Thus the variation of thermal fluctuations with temperature can be effectively used to probe the critical point.
Hadron Resonance Gas (HRG) model analysis of the particle yields indicate the formation of a thermal source for the produced particles in heavy-ion collisions sto ; shuryak . The production of large number of particles in each collision at the RHIC and LHC energies makes it even possible to study several quantities on an event-by-event basis rajagopal ; steph1 ; steph2 ; heiselberg ; sto ; shuryak and hence measure their event to event fluctuations. Thus, with the measurement of on an event-by-event basis, it is possible to extract the of the hot and dense strongly interacting matter produced in heavy-ion collisions. Assuming complete thermal equilibrium up to the surface of last scattering which is the kinetic freeze-out surface, is then expected to reveal the thermodynamic state of the matter at the moment of kinetic freeze-out.
The specific heat and its variation as a function of temperature have been studied extensively in different theoretical calculations. Statistical and HRG models have been used to obtain as a function of temperature in hadron gas and in quark-gluon matter sandip ; ben-hao ; X-M-Li ; aram . In Ref. ben-hao , a parton and hadron cascade model has been used to investigate as a function of beam energy for the initial partonic stage using quark-gluon matter and the final stage using hadronic matter. Lattice QCD calculations gavai ; swagato ; hatta provide estimations of for a wide range of temperatures. In Ref. gavai , continuum limits of have been calculated in quenched QCD at temperatures of 2 and 3, where is the transition temperature. It is found that differs significantly from that of the ideal gas. Recent lattice calculations using (2+1)-flavor QCD with almost physical quark masses give the results of for a temperature range of 130 to 400 MeV swagato . The low temperature (hadron phase) results agree well with HRG.
The specific heat has its origin in the event-by-event temperature fluctuations, which manifests through the fluctuations in the transverse momenta () sto ; shuryak ; aram ; X-M-Li ; korus ; ben-hao ; voloshin ; Broniowski ; Bozek ; Bleicher . Event-by-event fluctuations of have been reported by experiments at the CERN Super Proton Synchrotron (SPS) NA49-1 ; NA49-2 ; NA49-3 ; CERES and beam energy scan at RHIC phenix ; star1 ; star2 ; star_system . The values of extracted from the experimental results have large errors korus ; NA49-2 ; NA49-3 ; mike1 . The fluctuation data from Ref. NA49-1 yielded the value of to be at MeV for SPS energies. The statistical fluctuations arising from the finite multiplicity distributions of charged particles may significantly affect the extracted thermodynamic fluctuations voloshin . In the present work, this is taken care of by subtracting the widths of the results of mixed events from the real data. Since radial flow affects the estimation of temperature, its effect has also been considered. Finally, the values of have been calculated as a function of beam energy from published experimental data and compared to lattice and HRG calculations. Further predictions have been made for the LHC energies.
The paper is organized as follows. In Section-II, we present the methodology for extraction of from event-by-event average transverse momentum distributions and from theoretical calculations. The HRG model calculations of specific heat are presented in Section III. Event-by-event distributions of mean transverse momenta have been reported by several experiments at CERN-SPS and RHIC. The distributions and corresponding values of effective temperatures are presented in Section IV. A compilation of the results of specific heat from the existing experimental data is presented in Section V. Estimates for the specific heat at LHC using the AMPT model ampt have been included in this section. A discussion on the results of is given in Section VI. The paper is summarised with an outlook in Section VII.
II Specific heat: Methodology
The heat capacity of a system is defined as landau :
| (1) |
where , and are temperature, volume and energy of the system, respectively. Equivalently, of a system in thermal equilibrium to a bath at can be computed from the event-by-event fluctuations of :
| (2) |
For a system in equilibrium, the event-by-event temperature fluctuation is controlled by the heat capacity:
| (3) |
where is the mean temperature and is the variance in temperature. This yields the expression for landau ; ben-hao ; sto ; shuryak ; rajagopal :
| (4) |
Heat capacity thus can be estimated from the fluctuations in energy or temperature. For a system in equilibrium, the mean values of and are related by an equation of state. However, the fluctuations in energy and temperature have very different behaviour. Energy being an extensive quantity, its fluctuation has a volume dependent component. So energy is not suited for obtaining the heat capacity. On the other hand, temperature fluctuations provide a good major for estimating the landau ; sto ; shuryak ; rajagopal .
The temperature of the system can be obtained from the transverse momentum () spectra of the emitted particles. An exponential Boltzmann-type fit to the spectra gives a measure of the temperature:
| (5) |
where is a normalization factor and is the apparent or effective temperature of the system ben-hao . For obtaining the event-by-event fluctuation, the temperature needs to be estimated in every event. The fitting is possible only for central heavy-ion collisions at the LHC energies when the number of particles is at least one thousand in every event. Even in this case, the error associated with the fitting will be relatively large. This can be overcome by making a connection of mean transverse momentum () of particles in every event with the temperature. Since the calculation of the mean value is more stable, this method of temperature estimation can also be used for collisions at RHIC energies. The can be written as star_system :
| (6) | |||||
| (7) |
where is the rest mass of the particle. Note that the integration for is from 0 to . But in reality the window is finite. For a range of within to , we obtain:
| (8) | |||||
| (10) | |||||
This equation links the value of within a specified range of to .
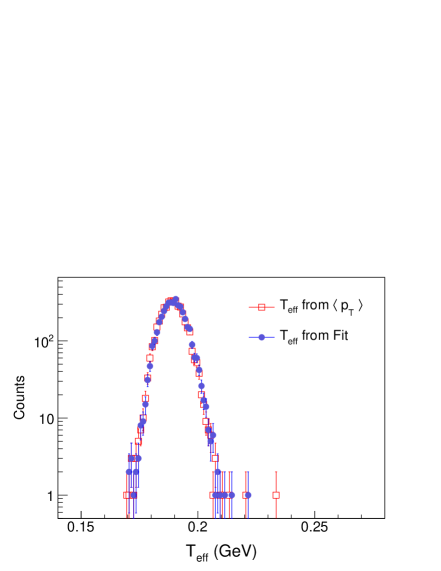
In order to validate the relation between to , we have generated a large number of events using the AMPT model ampt for Pb+Pb collisions at = 2.76 TeV. The goal is to compare the values of obtained from event-by-event distribution and from distributions. For top central (top 5% cross section) collisions, distribution of pions has been constructed for each event within a rapidity range of -1.0 to 1.0. The distribution is fitted to an exponential function and the inverse slope parameter () is extracted within fit range, GeV. Fig. 1 shows the extracted event-by-event distribution (as solid circles). For the same set of events, the values of has been calculated within the same and ranges for each event. From the value of for each event, the is calculated using eqn. (10). Resulting distribution has been plotted as open squares in Fig. 1. Both the distributions are observed to be same. This validates the relationship of and as given in eqn. (10).
We note that the extracted temperature, , is a combination of kinetic freeze-out temperature () and transverse flow velocity () of the system:
| (11) |
For pion, . The event-by-event fluctuations of needs to be taken into account for calculating the fluctuation in kinetic temperature teaney ; bhalerao ; xin-nian ; Bozek . Fluctuation in dominates over the fluctuation in for small systems (e.g. pp) shuryak_beta , asymmetric (e.g., pPb) Bozek and non-central collisions. For central Au+Au collisions at = 200 GeV star_temp , and for central Pb+Pb collisions at = 2.76 TeV alice_temp , , which translate to as GeV and GeV, respectively by using blast-wave fit bw_fits . For the present work, we consider 10% fluctuation in and calculate its effect on specific heat. is calculated using the equation,
| (12) | |||||
The values of are obtained from the blast-wave fits to the distributions of identified particles. With this, we obtain the specific heat as the heat capacity per number of particles () as ( = ) within the system.
Let us put the specific heat calculated in the present scenario (heat capacity per particle) in perspective with quantities normally quoted in theoretical calculations. For an ideal gas of particles of mass and degeneracy factor at temperature , zero chemical potential and volume , the number of particles can be expressed using Boltzmann statistics:
where , and we have taken . The energy is given by:
| (14) |
The heat capacity (from eqn. 1) can be written as,
| (15) | |||||
is a dimensionless quantity. The specific heat is the heat capacity per unit phase space volume,
| (16) |
where is an estimate of the phase space volume. In lattice calculations one extracts the dimensionless quantity and investigate its temperature dependence swagato , so in these calculations . However, in experiments it is simpler to measure the dimensionless quantity where is the charged particle multiplicity, and thus , where is taken as pseudorapidity () density of charged particles at mid rapidity ( at ). We compare the experimental results to other model calculations for as in Ref. ben-hao , where a parton and hadron cascade model, PACIAE has been used to compute . We also compare with HRG where it is straightforward to obtain both, and .
III Hadron Resonance Gas Model and Specific Heat
The current continuum estimates of lattice QCD thermodynamics in the low temperature and density phase (hadronic phase) show good agreement with that of an ideal hadron resonance gas LQCDHRG1 ; LQCDHRG2 ; LQCDHRG3 . Assuming complete chemical equilibrium between all hadrons, the hadron chemical potential of the species can be written as
| (17) |
where , and are the baryon number, electric charge and strangeness quantum numbers of the hadron, respectively. The HRG partition function in the grand canonical ensemble at can be expressed as:
| (18) | |||||
where the sum runs over all hadrons and resonances up to mass 2 GeV as listed in the Review of Particle Physics PDG . for mesons and for baryons. Here , , , and refer to the properties of the th hadron species: its degeneracy factor, mass, baryon number, electric charge and strangeness respectively. is the volume of the fireball under study. is the modified Bessel function of the second kind. From , all thermodynamic quantities could be computed.
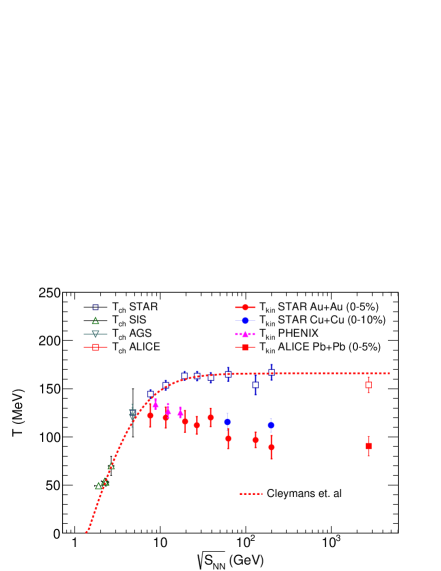
The values of have been reported by experiments at RHIC and LHC, as the final state particles give the information about from the particle spectra sandeep_freeze . These are obtained by making combined fits to the identified particle spectra using the Boltzmann-Gibbs blast-wave model. Figure 2 gives the values for different beam energies and collision systems star_temp ; star_system ; alice_temp . In addition, chemical freeze-out temperatures (), extracted from the identified particle yield by using thermal model calculations cleymans ; anton , are also shown in the figure. We find that the difference between and increases with the increase of beam energy. Lattice calculations indicate that is a monotonically increasing function of at zero . Thus we expect that the difference between the extracted at the chemical and kinetic freeze-out surfaces should also increase with beam energy following the trends of and .
We calculate from HRG model for two scenarios. In the first case, we compute at the chemical freeze-out surface using the extracted as well as . However, in the experiment one can only determine the at the kinetic freeze-out surface where the momentum exchange freezes. The thermal conditions at the kinetic freeze-out surface are much different from that at the chemical freeze-out surface. Hence the fireball is expected to have different at the two surfaces. In the second case, we try to estimate at the kinetic freeze-out surface using and zero hadron chemical potentials. For both scenarios, we calculate and for a wide range of beam energy, from = 1.91 GeV to 2.76 TeV. The results of are shown in the Fig. 3. It is observed that the trend of as a function of is similar to the nature followed by chemical and kinetic freeze-out temperatures. The value of corresponding to shows a sharp drop with increase of energy, and beyond = 62.4 GeV, the rate of decrease is very slow. A better estimate of in HRG could be made with realistic hadron chemical potentials taking into account the conservation of hadron number from the chemical to the kinetic freeze-out surfaces.
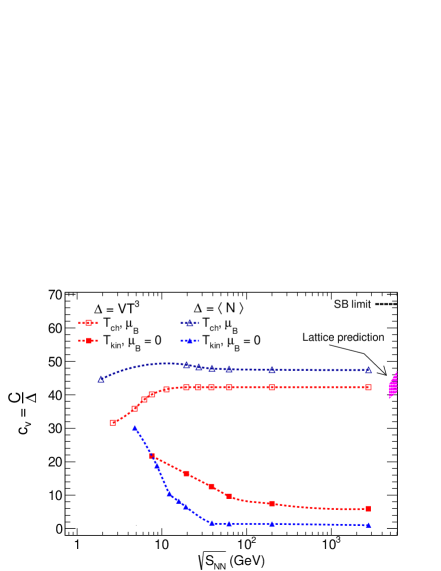
Recent lattice calculations for have been reported swagato as a function of temperature. The lattice results are at zero baryonic potential, hence only relevant at the LHC and higher energies. The value of as indicated in the Fig. 3 is for MeV, corresponding to the QCD transition temperature. It is seen that at the transition temperature and below, HRG results of agree well with lattice calculations swagato . The Steffan-Boltzmann non-interacting gas limit ( 66) is also shown in the figure.
IV Distributions of and
Experimental data for distributions have been reported by experiments at SPS and RHIC NA49-1 ; NA49-2 ; NA49-3 ; CERES ; phenix ; star1 ; star2 . In the left panel of Fig. 4 we present the distributions from the STAR experiment star1 ; star2 for the 5% most central Au+Au collisions at = 20, 62.4, 130 and 200 GeV. The results are shown for charged particle tracks within and GeV. The solid points are the event-by-event distributions from the experimental data, whereas the open circles are the corresponding results for mixed events. The mixed events are created by randomly selecting charged particles from different events. The mixed event distributions contain all the systematic effects arising from the detector effects, such as efficiency and acceptance, as well as include statistical fluctuations. The non-statistical or dynamical fluctuations in can be extracted by subtracting the width of the mixed event distribution from that of the real data.
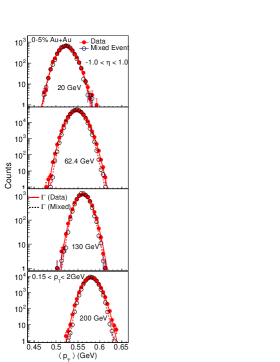
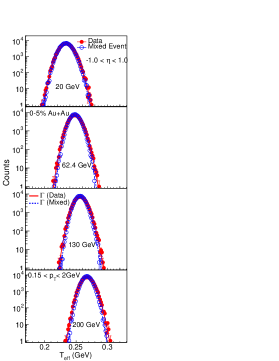
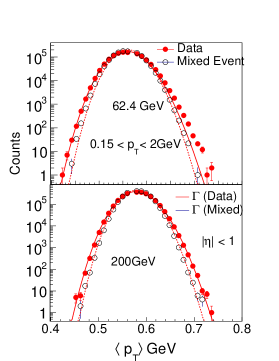
It has been observed that the distributions are nicely described by using the gamma () distribution star1 ; star2 ; mike2 :
| (21) |
Here represents the . The mean () and standard deviation () of the distribution are related to the fit parameters ( and ) by and . Both the real and mixed event distributions are fitted with the function and the fits are shown by the solid and dashed lines, respectively, in the left panels of Fig. 4. The fitted distributions are used to generate a large number of values for which corresponding values are calculated from eqn. 10. The resulting histograms represent event-by-event distributions, which are shown in the right panels of Fig. 4 for both real data and mixed events. These distributions are also fitted by the function as shown by the solid and dashed lines for data and mixed events, respectively. Table 1 lists the fit parameters for event-by-event distributions for data and mixed events.
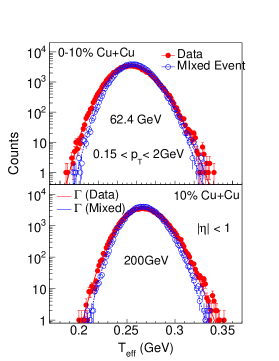
The system size dependence of and distributions have been studied with the STAR experimental data of top 10% central Cu+Cu collisions at = 62.4 and 200 GeV star_system . The results are presented in in Fig. 5. Corresponding distribution fit parameters to the event-by-event distributions for top 10% central collisions are tabulated in Table 2.
| Case | |||||
| (GeV) | (GeV) | (GeV) | (GeV) | ||
| 20 | data | 658.53 | 3.55610-4 | 0.2341 | 0.00912 |
| 20 | mixed | 724.56 | 3.22910-4 | 0.2339 | 0.00869 |
| 62.4 | data | 860.20 | 2.88510-4 | 0.2482 | 0.00846 |
| 62.4 | mixed | 1043.67 | 2.37810-4 | 0.2481 | 0.00768 |
| 130 | data | 920.25 | 2.78910-4 | 0.2566 | 0.00846 |
| 130 | mixed | 1140.12 | 2.24910-4 | 0.2564 | 0.00759 |
| 200 | data | 1078.23 | 2.48310-4 | 0.2677 | 0.00815 |
| 200 | mixed | 1387.56 | 1.92710-4 | 0.2674 | 0.00718 |
| Case | |||||
| (GeV) | (GeV) | (GeV) | (GeV) | ||
| 62.4 | data | 211.88 | 12.04010-4 | 0.2550 | 0.0175 |
| 62.4 | mixed | 271.94 | 9.45510-4 | 0.2571 | 0.0156 |
| 200 | data | 277.08 | 9.68710-4 | 0.2684 | 0.0161 |
| 200 | mixed | 370.71 | 7.27810-4 | 0.2698 | 0.0140 |
From these two figures and the given tables for and distributions for Au+Au and Cu+Cu collisions at RHIC energies, we can infer that: (a) the mean values of the event-by-event and consistently increase with the increase of beam energy, (b) the widths of the distributions decrease with the increase of beam energy. In addition, the widths for Cu+Cu system are observed to be larger compared to the corresponding widths of the Au+Au system. This may be because of the smaller system size for Cu+Cu compared to Au+Au system.
Experimental data for event-by-event distributions are not available for Pb+Pb collisions at LHC energies alice_meanpt . The string melting mode of AMPT model is used to generate central (top 5%) Pb+Pb collisions at = 2.76 TeV. The and distributions are constructed from these generated events as shown in Fig 1. This distribution will be used to extract specific heat at the LHC energy.
V Specific heat from experimental data
The widths of the distributions are strongly affected by statistical fluctuations, which need to be subtracted as the heat capacity is related only to the dynamical part of the fluctuation. The width contains two components:
| (22) |
values are obtained by subtracting the widths of the distributions for mixed events from the real data. With this, eqn. 12 is expressed as:
| (23) |
The heat capacity is calculated from eqn. 23 by using the values of from Fig. 2. Knowing the heat capacity, the specific heat, is obtained by dividing by number of charged particles in the system. Since the experimental results presented here are at mid-rapidity, we have divided the value of by charged particle multiplicity at mid-rapidity nch1 ; nch2 to obtain the specific heat. This is presented in Fig. 3 for Au+Au and Cu+Cu collisions at RHIC energies. The estimated for the LHC energy from the AMPT model using Fig. 1 is also shown in the figure. The errors in the data points are estimated mainly from the following sources: (a) error in extraction of using the blast-wave fits, (b) error in charge particle multiplicity density, and (c) error in as reported in the experimental data. The error in takes into account the spread in the value of (). It is observed that has a sharp drop from = 20 GeV to 62.4 GeV, beyond which the decrease is rather slow up to the LHC energy.
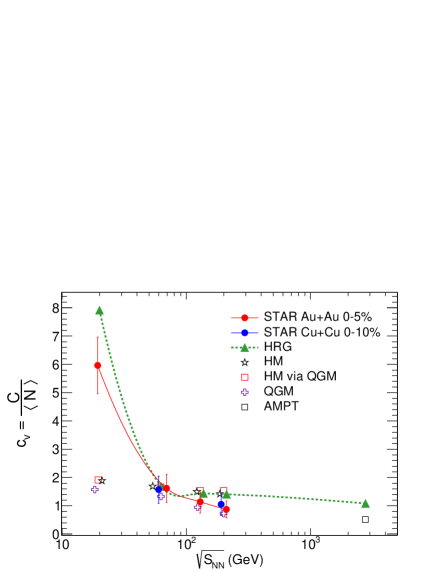
HRG calculations for with are superimposed in Fig. 6. These results follow the experimental data points quite well. In Ref. ben-hao , specific heat for central (top 5%) Au+Au collisions at RHIC energies are discussed using a parton and hadron cascade model, called PACIAE. The results of the model calculations are presented for three cases: hadronic matter in the final state (HM), quark-gluon matter in the partonic initial state (QGM), and hadronic matter via quark-gluon matter (HM via QGM). These results for Au+Au collisions are also presented in Fig. 6. The results of these models miss the experimental data point at = 20 GeV, but can explain the data at higher energies. The PACIAE is a transport model with LO pQCD cross sections considered between partons. It might be possible that at lower beam energies, the LO pQCD description is not appropriate.
VI Discussion
In an earlier publication by R. Korus et al. (Ref. korus ), the experimental data of correlations from the NA49 experiment NA49-1 ; NA49-2 ; NA49-3 for Pb+Pb collision at laboratory energy of 158 GeV had used to calculate specific heat, which yielded a value of . The large error bars of these results made the reported results insignificant. One of the possible reasons for the large errors is the low particle multiplicity which gives a significant hindrance to the calculation of dynamic temperature fluctuations voloshin . At the SPS energies, distributions have been reported by NA49 collaboration for laboratory energies of 20, 30, 40 80 and 158 GeV NA49-1 ; NA49-2 ; NA49-3 and the CERES collaboration at 40, 80 and 158 GeV CERES . In both of the data sets, the distributions for real data and mixed event are indistinguishable. These are also prominent in the ratio plots of real and mixed events as shown in Ref. CERES . Thus the extraction of dynamic fluctuation in temperature and so the specific heat is not possible. In the present work, we have probed much higher energy collisions, where the charged particle multiplicities in each event are large, allowing for the extraction of the dynamical part of the temperature fluctuation by overcoming the statistical fluctuations.
The results of specific heat for Cu+Cu collisions are close to that of Au+Au collisions. This shows that although a large change of volume happens in going from Cu+Cu to Au+Au systems, the two systems are not very different thermodynamically.
Several sources of uncertainty may affect the extraction of specific heat. In the context of the results presented in Fig. 6, three sources of uncertainty, viz., effect of finite particle multiplicity, spread of from the fits of distributions, and the radial flow fluctuations, have been discussed. Apart from these, it is worthwhile to point out some other uncertainties. Fluctuations in the impact parameter of the collision and thus the fluctuation in the number of participating nucleons gives an uncertainty to the event-by-event mean distribution. Choice of narrow bins in centrality has been made to minimize this uncertainty. Another source of uncertainty may come from the choice of the window. The lower bound of the window needs to be chosen properly in order to reduce the final state effects such as resonance decay and hadronic scattering. Similarly, the upper limit on pT needs to be chosen such that the effect from mini-jets and jets are minimized. Although it is implicit that radial flow fluctuations are minimum for central collisions because of inherent symmetry of the system, its detailed study can be made using an event-by-event hydrodynamic model. These studies will help to pin down the errors of the results extracted in Fig. 6.
VII Summary
We have studied the excitation energy dependence of specific heat of hadronic matter formed in heavy-ion collisions corresponding to RHIC and LHC energies. In the present work, dynamical component of the temperature fluctuation is calculated from distributions. From this, the specific heat is obtained as heat capacity per charge particle. We employ the HRG model to calculate heat capacity from the variation of energy of the system with temperature. Results of the HRG calculations are close to the data. With increase of collision energy, shows a sharp drop from low energy till = 62.4 GeV, beyond which the rate of decrease is very slow. In this regard, we look forward to results of BES program of RHIC, where the collision energy and centrality dependences of are expected to provide important signatures for the onset of the QGP phase transition. In order to probe the QCD critical point, we propose a finer scan of beam energies for the second phase of BES program (BES-II) from 7.7 GeV to 62.4 GeV. A sudden change in is expected at a particular beam energy within this range. Studies of heat capacity at high baryon density and lower temperatures accessible at Facility for Antiproton and Ion Research (FAIR) would be of high interest, unless it is critically challenged by statistical fluctuations. Predictions for at the LHC at = 2.76 TeV are made using different models. It will be interesting to obtain at the highest LHC energy of = 5.02 TeV in order to make a direct comparison to lattice calculations. In literature, it has been also proposed to calculate thermal conductivity from transverse energy () fluctuations, which can be explored in future studies. The excitation energy dependence of provides important information regarding the thermodynamic properties, such as, heat conductivity, speed of sound (), compressibility (), etc., which may reveal better understandings of the matter formed in relativistic nuclear collisions.
Acknowledgement SC acknowledges “Centre for Nuclear Theory” [PIC XII-RD-VEC-5.02.0500], Variable Energy Cyclotron Centre for support. This research used resources of the LHC grid computing centre at the Variable Energy Cyclotron Centre, Kolkata.
References
- (1) Y. Aoki, G. Endrodi, Z. Fodor, S.D. Katz, K.K. Szabo, Nature 443, 675 (2006).
- (2) J.W. Harris, B. Muller, Ann. Rev. Nucl. Part. Sci. 46, 71 (1996).
- (3) P. Braun-Munzinger and J. Stachel, Nature 448, 302 (2007).
- (4) L. Stodolsky, Phys. Rev. Lett. 75, 1044 (1995).
- (5) E.V. Shuryak, Phys. Lett. B 423, 9 (1998).
- (6) M.A. Stephanov, K. Rajagopal and E. V. Shuryak, Phys. Rev. Lett. 81, 4816 (1998).
- (7) M.A. Stephanov, K. Rajagopal and E. Shuryak, Phys. Rev. D 60, 114028 (1999).
- (8) M. Stephanov, Phys. Rev. D 65, 096008 (2002).
- (9) H. Heiselberg, Phys. Rep. 351, 161 (2001).
- (10) S. Chatterjee, R.M. Godbole and S. Gupta, Phys. Rev. C 81 044907 (2010).
- (11) B-H Sa, X-M Li, S-Y Hu, S-P Li, J. Feng, and D-M Zhou, Phys. Rev. 75, 054912 (2007).
- (12) X-M Li et al. Int. Jor. of Mod. Phys. E 16 1906 (2007).
- (13) Aram Mekjian, Phys. Rev. C 73, 014901 (2006).
- (14) R.V. Gavai, S. Gupta and S. Mukherjee, Phys. Rev. D 71 074013 (2005).
- (15) A. Bazavov et al. Phys. Rev. D 90 094503 (2014).
- (16) Yoshitaka Hatta and Kenji Fukushima, arXiv:hep-ph/0311267.
- (17) S. A. Voloshin, V. Koch, and H. G. Ritter, Phys. Rev. C 60 024901 (1999).
- (18) W. Broniowski, B. Hiller, W. Florkowski, and P. Bozek, Phys. Lett. B 635, 290 (2006).
- (19) P. Bozek and W. Broniowski, Phys. Rev. C 85 044910 (2012).
- (20) M. Bleicher et al., Nucl. Phys. A368, 391c (1998).
- (21) R. Korus et al., Phys. Rev. C 64 054908 (2001).
- (22) H. Appelshauser et al. (NA49 Collaboration), Phys. Lett. B 459, 679 (1999).
- (23) T. Anticic et al. (NA49 Collaboration), Phys. Rev. C 70, 034902 (2004).
- (24) T. Anticic et al. (NA49 Collaboration), Phys. Rev. C 79, 044904 (2009).
- (25) D. Adamova et al. (CERES Collaboration), Nucl. Phys. A 727. 97 (2003).
- (26) K. Adcox et al. (PHENIX Collaboration), Phys. Rev. C 66, 024901 (2002).
- (27) J. Adams, et al. (STAR Collaboration), Phys. Rev. C 71, 064906 (2005).
- (28) J. Adams, et al. (STAR Collaboration), Phys. Rev. C 72, 044902 (2005).
- (29) L. Adamczyk et al. (STAR Collaboration), Phys. Rev. C 87, 064902 (2013).
- (30) M.J. Tannenbaum, arXiv:nucl-ex/0512004.
- (31) M.J. Tannenbaum, Phys. Lett. B 498, 29 (2001);
- (32) Z.-W. Lin, C.M. Ko, B.-A. Li, B. Zhang, S. Pal, Phys. Rev. C 72, 064901 (2005).
- (33) A. Bazavov, T. Bhattacharya, M. Cheng, et al., Phys. Rev. D 80, 014504 (2009).
- (34) S. Borsányi, Z. Fodor, C. Hoelbling, et al., Jour. High. Ener. Phys. 1009, 73 (2010).
- (35) S. Borsanyi, Z. Fodor, S. D. Katz, S. Krieg, C. Ratti, and K. Szabo, Jour. High. Ener. Phys. 1201, 138 (2012).
- (36) K.A. Olive et al. (Particle Data Group), Chin. Phys. C 38, 090001 (2014).
- (37) L.D. Landau.and E.M. Lifshitz, STATISTICAL PHYSICS, (Course of Theoretical Physics, v. 5, 3rd, rev. and enlarged ed.) Pergamon Press (1980).
- (38) A. Mazeliauskas and D. Teaney, arXiv:1509.07492 [nucl-th].
- (39) R.S. Bhalerao, J.-Y. Ollitrault, S. Pal and D. Teaney, Phy. Rev Lett. 114 152301 (2015).
- (40) L. Pang, Q. Wang and X-N Wang, Phys. rev. C 86, 024911 (2012).
- (41) E.V. Shuryak, Phys. Rev. C 88, 044915 (2013).
- (42) F. Retiere and M. Lisa, Phys. Rev. C 70, 044907 (2004).
- (43) S. Chatterjee et al., Advances in High Energy Physics 2015, Article ID 349013.
- (44) B.I. Abelev et al. (STAR Collaboration), Phys. Rev. C 79, 034909 (2009).
- (45) B, Abelev et al. (ALICE Collaboration), Phys. Rev. C 88, 044910 (2013).
- (46) J. Cleymans, H. Oeschler, K. Redlich and S. Wheaton, Phys. Rev. C 73, 034905 (2006).
- (47) A. Andronic, P. Braun-Munzinger and J. Stachel, Phys. Lett. B 673, 142 (2009).
- (48) B, Abelev et al. (ALICE Collaboration), Eur. Phys. J. C 74, 3077 (2014).
- (49) S.S. Adler et al. (PHENIX Collaboration), Phys. Rev. C 71, 034908 (2005).
- (50) B. Alver et al. (PHOBOS Collaboration), Phys. Rev. C 83 024913 (2011).
- (51) R.S. Bhalerao, M. Luzum and J-Y Ollitrault, Phys. Rev. C84 034910 (2011).