The influence of radiative core growth on coronal X-ray emission from pre-main sequence stars
Abstract
Pre-main sequence (PMS) stars of mass transition from hosting fully convective interiors to configurations with a radiative core and outer convective envelope during their gravitational contraction. This stellar structure change influences the external magnetic field topology and, as we demonstrate herein, affects the coronal X-ray emission as a stellar analog of the solar tachocline develops. We have combined archival X-ray, spectroscopic, and photometric data for 1000 PMS stars from five of the best studied star forming regions; the ONC, NGC 2264, IC 348, NGC 2362, and NGC 6530. Using a modern, PMS calibrated, spectral type-to-effective temperature and intrinsic colour scale, we deredden the photometry using colours appropriate for each spectral type, and determine the stellar mass, age, and internal structure consistently for the entire sample. We find that PMS stars on Henyey tracks have, on average, lower fractional X-ray luminosities () than those on Hayashi tracks, where this effect is driven by changes in . X-ray emission decays faster with age for higher mass PMS stars. There is a strong correlation between and for Hayashi track stars but no correlation for Henyey track stars. There is no correlation between and radiative core mass or radius. However, the longer stars have spent with radiative cores, the less X-ray luminous they become. The decay of coronal X-ray emission from young early K to late G-type PMS stars, the progenitors of main sequence A-type stars, is consistent with the dearth of X-ray detections of the latter.
keywords:
stars: magnetic fields – stars: pre-main sequence – stars: coronae – stars: interiors – stars: evolution – X-rays: stars1 Introduction
X-ray emission from low-mass (3) pre-main sequence (PMS) stars is dominantly coronal in origin (e.g. Stassun et al. 2006). Compared to the contemporary Sun, they have coronae that are an order of magnitude hotter on average, 30 compared to 2, and are 10-105 times more X-ray luminous (Preibisch et al., 2005). How the coronae of stars attain such high temperatures is the subject of debate. It may be caused by the dissipation of magnetohydrodynamic waves (Narain & Ulmschneider, 1996), a result of numerous, unresolved, nanoflares (Parker, 1988), or a combination of both (Klimchuk & Bradshaw, 2014).
PMS star X-ray light curves consist of a characteristic (often called “quiescent” although it is variable) level of X-ray emission (e.g. Wolk et al. 2005), superposed on which are larger, more energetic flares. Flares are the result of particle acceleration along magnetic loops following the energy release from reconnection events. In turn, reconnection arises from the twisting and tangling of coronal magnetic field lines induced by the photospheric footpoint motions driven by stellar surface transport effects (e.g. surface differential rotation, meridional flow and supergranular diffusion).
Flares in the X-ray light curves of PMS stars follow similar temporal behaviour to those observed on the Sun, with an almost linear rise phase followed by a slower exponential decay, but can be far more energetic (Wolk et al., 2005; Favata et al., 2005). The most energetic flare detected from a PMS star would be classified as X40,000 if it were to take place on the Sun (A. Aarnio, private communication). The largest flares detected from PMS stars were once thought to be driven by the star-disc interaction, where magnetic field lines connecting stars to their inner disc were twisted due to the differential rotation rate between the footpoint of the loop at the disc and that on the stellar surface (Montmerle et al., 2000; Favata et al., 2005). However, it was subsequently established by examining excess infra-red emission, a result of the reprocessing of the stellar photons from dusty circumstellar discs, that the largest and most violent X-ray flares also occur on PMS stars whose discs had dispersed (Getman et al. 2008; Aarnio, Stassun & Matt 2010).
PMS star X-ray luminosity varies from star to star and is known to correlate with stellar mass and bolometric luminosity (e.g. Flaccomio, Micela & Sciortino 2003b; Preibisch et al. 2005; Telleschi et al. 2007). can also vary over short timescales of hours- to-days (due to flares), and over longer Myr timescales with Preibisch & Feigelson (2005) reporting a weak decrease in with increasing age, at least in stellar mass stratified subsamples. In contrast to main sequence dwarfs, however, the stellar rotation rate does not appear to play a significant role in PMS star X-ray emission. PMS stars do not follow the well-known main sequence rotation-activity relation, whereby increases with rotation rate until it saturates at (e.g. Wright et al. 2011). Instead, almost all PMS stars show saturated X-ray emission, but with orders of magnitude more scatter in than what is found for stars in main sequence clusters (Preibisch et al., 2005). This scatter has been shown to reduce to main sequence levels by a cluster age of 30, and has been speculatively related, although in a currently unknown way, to the stellar internal structure transition from fully to partially convective as PMS stars evolve across the Hertzsprung-Russell (H-R) diagram (Alexander & Preibisch, 2012).
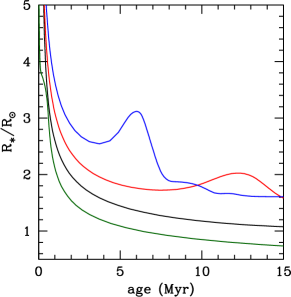
After emerging from their natal dust clouds, PMS stars are located in the upper right of the [ vs ] H-R diagram on the birth line (Stahler, 1983). They initially host fully convective interiors. By the virial theorem, as the star contracts half of the gravitational energy heats the stellar interior while the other half is radiated away. While the stellar interior is fully convective the contraction is homologous, such that the mass fraction contained within radius inside the star is the same as the radius fraction at all times (Bodenheimer, 2011), and all interior mass shells are losing heat. This global loss of heat across all mass shells results in an internal luminosity profile that increases from the centre of the star to the surface (Palla & Stahler, 1993). During this time, the stellar radius decreases with age approximately as (Lamm et al., 2005; Batygin & Adams, 2013).
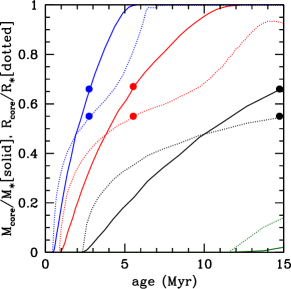
As PMS contraction progresses, the opacity (which is an inverse function of temperature) drops and the central regions of the star become stable against convection. A radiative core begins to grow, at least for stars of mass 0.35 (Chabrier & Baraffe, 1997), with lower mass stars retaining their fully convective interiors for the entirety of their PMS, and main sequence, evolution. The lowest mass stars considered in this work (0.1, see section 3) will remain fully convective for their main sequence lifetime of trillions of years (e.g. Laughlin, Bodenheimer & Adams 1997). When a radiative core develops, the base of the convective zone is heated, and a maximum in the internal luminosity profile is generated (the internal luminosity increases from the centre of the star to a maximum, then drops towards the stellar surface; Palla & Stahler 1993; Iben 2013). Mass shells interior to this maximum lose heat while those at larger radii up to the stellar surface gain heat. This internal luminosity maximum radiatively diffuses towards the stellar surface over time (Maeder, 2009), which eventually leads to a rise in the surface luminosity and the star moving from its Hayashi track (where is decreasing with age) to its Henyey track (where is increasing with age) in the H-R diagram. During radiative core development, where heat is absorbed by the convective envelope, the stellar contraction becomes non-homologous, with the central regions continuing to contract while the outer layers initially expand (Palla & Stahler, 1993). Eventually the PMS star becomes more centrally condensed, with the radiative core containing a greater fraction of the stellar mass while occupying a smaller fraction of the stellar radius (i.e. ). The behaviour described above is illustrated in Figure 1 for stars of mass 0.5, 1, 1.5, and 2, constructed from the models of Siess, Dufour & Forestini (2000).
The stellar structure transition from fully convective to partially convective interiors has been found to influence the large-scale external magnetic field topology of PMS stars (e.g. Donati et al. 2011, 2012). Evidence is beginning to emerge for a magnetic evolutionary scenario, whereby stars (at least those of mass 0.5) are born with simple (with dominant low number mode) axisymmetric large-scale magnetic fields that become significantly more complex, multipolar, and dominantly non-axisymmetric once a substantial radiative core has developed (Gregory et al., 2012, 2014).111This magnetic topology change mirrors what has been reported previously for main-sequence dwarf stars that lie on either side of the fully convective divide (Morin et al., 2008; Donati et al., 2008b; Gregory et al., 2012). Although more data is required to confirm the reported trends, they likely reflect the change in dynamo magnetic field generation process as PMS stars develop stellar analogs of the solar tacholine, a shear layer between the radiative core and convective envelope.
In this paper we examine the influence of radiative core development on the coronal X-ray emission from PMS stars. Observationally, the best studied PMS stars reside in star forming regions of average age of a few million years, and are therefore young and predominantly fully convective. As such, in order to obtain a large sample of partially convective PMS stars we consider data from five of the best studied star forming regions, as detailed in section 2. Rather than taking literature values for the stellar luminosities and effective temperatures, we re-calculate/reassign them based on the observed photometry and estimate spectral types in a consistent manner across our entire sample of 1000 stars. During this process we adopt the latest spectral type estimates (e.g. Hillenbrand, Hoffer & Herczeg 2013) and use the latest generation intrinsic colour/effective temperature scale as calibrated for PMS stars (Pecaut & Mamajek, 2013). Using PMS evolutionary models to estimate their mass, age, and internal structure from their location in the H-R diagram (section 3), we throughly examine the difference in the X-ray emission properties of fully and partially convective stars in section 4. In section 5 we consider how the X-ray emission changes as partially convective PMS stars evolve across the H-R diagram, before concluding in section 6.
2 Stellar parameters: spectral types & bolometric/X-ray luminosities
The majority of PMS stars within young star forming regions have fully convective interiors. Therefore, in order to examine the X-ray properties of partially convective PMS stars, it is necessary to consider data from more than one star forming region to increase the sample size. We have collated published data from five of the most extensively studied star forming regions, the Orion Nebula Cluster (ONC), IC 348, NGC 2264, NGC 2362, and NGC 6530, as described in the following subsections. In order to determine whether or not a given PMS star has a fully or partially convective interior we must position the star in the H-R diagram. This requires an effective temperature, , and a stellar luminosity, . In turn, can be assigned given a stellar spectral type, while can be calculated by dereddening observed photometry, the application of a bolometric correction appropriate for the stellar spectral type, and with an assumed distance modulus (usually taken to be the same for every star in a cluster).
For each of the five star forming regions we obtained X-ray luminosities, spectral types and observed magnitudes/colours from published catalogs, as detailed below. Rather than taking published values of stellar effective temperatures and luminosities, we assigned and calculated the values ourselves. This approach has the major advantage that effective temperatures are assigned across all stars in all of the star forming regions in a fully consistent manner, eliminating differences between the published catalogs and allowing them to be more directly compared. The spectral type to effective temperature scale that we adopt in this paper is the recently published PMS scale of Pecaut & Mamajek (2013). Although they used stars of age to derive their spectral type to (-intrinsic colour-bolometric correction) scale, they are more appropriate for younger PMS stars than the commonly adopted dwarf star scales. Concerns have long been raised over the use of the latter for PMS stars, which (given their larger radii) have lower surface gravities than dwarf stars (e.g. Hillenbrand 1997; Dahm et al. 2007). Furthermore, the Pecaut & Mamajek (2013) scale takes into account the greater spot coverage on PMS stars compared to main sequence dwarfs.
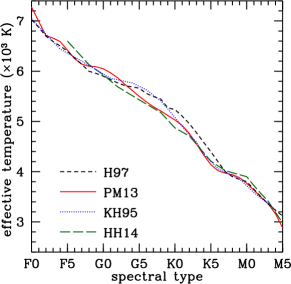
Figure 2 shows a comparison between the modern PMS spectral type- conversion scales of Pecaut & Mamajek (2013) and Herczeg & Hillenbrand (2014), and the dwarf star scale used by Hillenbrand (1997) in the acclaimed survey of young stars in the ONC [which, between the considered spectral types, is a slightly modified version of the conversion scale of Cohen & Kuhi (1979)]. Also shown is another commonly used scale, again based on dwarf stars, published by Kenyon & Hartmann (1995). The conversion scale of Pecaut & Mamajek (2013) is limited to spectral types F0 to M5, while Herczeg & Hillenbrand (2014) extends from F5 to later than M5. Stars of earlier spectral type are not of interest for this study, as they are too massive to be T Tauri stars. The M5 cut-off of the Pecaut & Mamajek (2013) scale is of little consequence to this study of partially convective PMS stars, as such late type (low mass) stars retain their fully convective interiors for the entirety of their PMS evolution. It is immediately evident from Figure 2 that PMS stars are cooler than dwarf stars by 200 from roughly mid-G to mid-K [for G-types] when comparing them to the dwarf scales of Hillenbrand (1997) [Kenyon & Hartmann (1995)]. This correction will move them to lower masses and to younger ages in the H-R diagram.
From the photometry and observed colours we have calculated stellar luminosities as described for each of the star forming regions in the following subsections. This requires bolometric corrections and intrinsic colours for which we also use the PMS conversion scale of Pecaut & Mamajek (2013), thus ensuring that our luminosities have been calculated in a uniform manner across all the star forming regions and using a fully consistent effective temperature/bolometric correction combination. Torres (2010) discuss the importance of this, which also requires the use of a value for the absolute bolometric magnitude of the Sun (this enters into the calculation of the stellar bolometric luminosity). For this, we use , as Pecaut & Mamajek (2013). This should be used with a modern estimate of the solar effective temperature of and - see footnote 2 of Mamajek (2012).
In summary, for each star forming region we have selected stars with an X-ray luminosity, (or an X-ray flux from which can be derived given a distance), spectral type between F0 and M5 (inclusive) from which we assign an effective temperature, and photometric magnitudes and colours from which we have calculated bolometric luminosities. Further details for each star forming region are given in the following subsections. We have removed stars that are known (or suspected) binaries where the two stars are not sufficiently resolved in the X-ray and/or optical catalogs to derive and/or separately for each.
2.1 The ONC
The Orion Nebula Cluster (ONC) is one of the most extensively studied star forming regions (Muench et al., 2008; O’Dell et al., 2008).
2.1.1 X-ray luminosities
We take X-ray luminosities from the Massive Young Star-Forming Complex Study in Infrared and X-ray (MYStIX) project (Feigelson et al., 2013), specifically the MYStIX Probable Complex Members (MPCM) catalog of Broos et al. (2013). For the ONC, the MYStIX X-ray luminosities are those from the Chandra Orion Ultradeep Project (COUP; Getman et al. 2005), a deep X-ray survey consisting of 13.2 consecutive days of observing, but adjusted to a distance of (Menten et al., 2007). (A distance of was assumed for the COUP without attribution.) With an exposure time of this is one of the deepest X-ray surveys of any star forming region ever conducted.
2.1.2 Spectral types & photometry
We take spectral types from (table 2 of) Hillenbrand et al. (2013). This is a compendium of literature values, including many re-assignments of spectral types to stars in the ONC catalog of Hillenbrand (1997), as well as many which are reported for the first time.222The majority of spectral types of the ONC stars which we consider in this paper (F0-M5, with in the MYStIX catalog (see section 2.1.1) and and photometry) were originally determined by Hillenbrand (1997) and Hillenbrand et al. (2013). However, for the stars considered here, the compendium Hillenbrand et al. (2013) study includes spectral type estimates from Greenstein & Struve (1946), Parenago (1954), Johnson (1965), Penston (1973), Penston, Hunter & Oneill (1975), Cohen & Kuhi (1979), Walker (1983), Duncan (1993), Edwards et al. (1993), Luhman et al. (2000), Lucas et al. (2001), Slesnick, Hillenbrand & Carpenter (2004), Wolff, Strom & Hillenbrand (2004), Daemgen, Correia & Petr-Gotzens (2012), as well as some attributed by Hillenbrand et al. (2013) to “H. C. Stempels 2008, private communication”, “A.E. Samuel 1993 unpublished PhD thesis”, “K. Stassun 2005, private communication”, “Prosser & Stauffer 1995, private communication”, and to “C. Hamilton 1994 unpublished masters thesis”.
For stars where a range of spectral types are given in the Hillenbrand et al. (2013) table we adopt a spectral type that is the median of the earliest and latest reported, with exceptions as follows. i). For stars listed by Hillenbrand et al. (2013) with a spectral type reference of “Ste=H. C. Stempels 2008, private communication" we take those spectral types over other literature values as they have been assigned based on high dispersion spectra. ii). If a source has different spectral types in Hillenbrand (1997) and in the enhanced ONC census of Hillenbrand et al. (2013), we take the Hillenbrand et al. (2013) value. iii). When adopting a median spectral type for sources that have been spectral typed in multiple literature sources we neglect outliers. For example, the star with SIMBAD identifier [H97b] 193 has been spectral typed in 4 studies, Parenago (1954), Johnson (1965), Cohen & Kuhi (1979), and Hillenbrand (1997) - as listed by Hillenbrand et al. (2013). In three, the star is between K0 and K2, while in one it is assigned K6. In this case we ignore the K6 outlier and adopt K1. iv). Spectral types taken from Luhman et al. (2000) often span a large range of values. For such stars, if other spectral types are available that fall within the range of those of Luhman et al. (2000) we consider those values only. Typically, this resulted in the adoption of a spectral type that was close to the median of the Luhman et al. (2000) range. If the other listed spectral types extend to later or earlier than those of Luhman et al. (2000) then we consider the full range of values. v). Spectral types determined solely from IR spectra often differ from those found from optical spectra, being later, typically (e.g. Slesnick et al. 2004). As discussed by Pecaut & Mamajek (2013), the well studied classical T Tauri star TW Hya, as one example, has been classified as M2.5 from nIR spectra (Vacca & Sandell, 2011), but as K6-K8 from various optical studies (e.g. Herbig 1978; Hoff, Henning & Pfau 1998; Torres et al. 2006; Pecaut & Mamajek 2013). We therefore neglect spectral types determined from IR spectra by Slesnick et al. (2004), as listed in the Hillenbrand et al. (2013) table, unless there are no estimates from optical spectra. Likewise, we neglect spectral type determinations from the IR study of Weights et al. (2009) [the latest spectral types from which “may be too late”, as noted by Hillenbrand et al. (2013)]. vi). We neglect sources where extremely discrepant spectral types have been reported in the literature (e.g. [H97b] 503 which is reported by Hillenbrand et al. (2013) as F2-F7 [Hillenbrand 1997] and K0-K7 [Luhman et al. 2000], and [H97b] 809 which is assigned F5-K5 by Hillenbrand et al. (2013), etc).
We then removed stars that are listed as (or are suspected to be) spectroscopic or close binaries, as there may be some confusion in the photometry and/or X-ray luminosities for the individual stars. These were identified by Marschall & Mathieu (1988), Mathieu (1994), Rhode, Herbst & Mathieu (2001), Prato et al. (2002), Fűrész et al. (2008), Cargile, Stassun & Mathieu (2008), Daemgen et al. (2012), Morales-Calderón et al. (2012), Correia et al. (2013), and Tobin et al. (2013) (which includes corrected tables from Tobin et al. 2009), with some being attributed to “H C. Stempels 2008, private communication” by Hillenbrand et al. (2013).
We then assigned an effective temperature to each star based on its spectral type using the Pecaut & Mamajek (2013) PMS conversion scale, linearly interpolating the value between spectral subtypes where necessary.
| Region | Distance (pc) | Reference |
|---|---|---|
| ONC | 414 | Menten et al. (2007) |
| NGC 2264 | 756 | Gillen et al. (2014) |
| IC 348 | 316 | Herbig (1998) |
| NGC 2362 | 1480 | Moitinho et al. (2001) |
| NGC 6530 | 1250 | Prisinzano et al. (2005) |
For the ONC stars with spectral types and X-ray luminosities we obtained colours and magnitudes from Hillenbrand (1997) [who obtained the majority of the photometry directly, although for a minority of the stars we consider here some magnitudes/colours were taken from Herbig & Terndrup (1986) and Prosser et al. (1994)]. We then calculated bolometric luminosities in a similar manner to Hillenbrand (1997), described below, except we have used the recently published PMS intrinsic colours and bolometric corrections of Pecaut & Mamajek (2013). The magnitudes were de-reddened by assuming a common extinction law for the cluster,
| (1) |
as derived by Hillenbrand (1997) by converting that of Rieke & Lebofsky (1985) from the Johnson band to the Cousins band (e.g. Bessell 1979). Bolometric luminosities then follow from,
| (2) |
where the bolometric correction at is calculated from that at and the intrinsic colour, , as tabulated by Pecaut & Mamajek (2013). The solar bolometric magnitude is given above, and the distance modulus, , for the cluster is calculated from our assumed cluster distance (see Table 1 and Appendix A).
For some stars in the sample which results in a (meaningless) negative extinction. This is likely as a result of inaccuracies in the adopted intrinsic colour appropriate for the stellar spectral type, an incorrectly assigned spectral type (resulting in an incorrect assignment of the intrinsic colour for that star), or photometric variability of the star. We follow Hillenbrand (1997) and set for such stars. Their calculated luminosities are therefore (likely) lower limits. 72 of the 496 stars in our final ONC sample (see section 3), 15%, had a negative extinction. This is an improvement over the original Hillenbrand (1997) study where 27% of their sample of stars with extinction estimates had set to zero, indicating that the updated census of the ONC presented by Hillenbrand et al. (2013) has improved the spectral typing of stars in the region. The stars with negative extinctions in our sample have a mean spectral type of M3. At such late spectral types, the variation in the intrinsic colour with effective temperature (spectral type) is at its steepest (e.g. Pecaut & Mamajek 2013), such that a small shift in the spectral type assignment results in a much bigger difference in , and therefore in , than it would do at earlier spectral types. Of the 72 stars with negative extinctions, the majority (52) would have a positive extinction with a change in spectral type of one subtype, which is the typical error. The remaining 20 have a small range in reported spectral types, or a spectral type estimate from a single literature source only, indicating that the resulting negative extinction is not caused by our adoption of a median spectral type. It is likely that their reported spectral types are inaccurate.
2.2 NGC 2264
The NGC 2264 star forming region, part of the Monoceros OB1 association, has been extensively observed at all wavelengths (Dahm, 2008b).
2.2.1 X-ray luminosities
NGC 2264 has been observed several times with both Chandra and XMM-Newton. Two separate, slightly overlapping, images were obtained with Chandra (Obs IDs: 2540 & 2550, PIs: Sciortino & Stauffer, and ) with Ramírez et al. (2004)333The same Chandra observation was also analysed by Sung, Bessell & Chun (2004) who identified additional X-ray sources in the field-of-view. and Flaccomio, Micela & Sciortino (2006) calculating PMS stellar X-ray luminosities. Additional X-ray luminosities have been derived by Dahm & Simon (2005) and Dahm et al. (2007) from XMM-Newton observations (two pointings, both , Obs IDs: 0011420101 & 0011420201, PI: Simon).
Comparison of the papers where the NGC 2264 X-ray data are presented reveals that a variety of differing assumptions and methods have been used by the different authors to calculate . For example, Ramírez et al. (2004) assume a uniform value for the absorbing hydrogen column density towards each star, based on “the most likely value of the observed extinction towards NGC 2264” and assuming a fixed relationship between and (e.g. Vuong et al. 2003). estimates from such relationships are highly uncertain, with a large spread apparent from diagrams (e.g. Feigelson et al. 2005). Flaccomio et al. (2006) note that “ is critical for determining ” and proceed to calculate from X-ray spectral fits treating as a free parameter in some cases and calculating it from in others. Given the different assumptions, we must be careful when combining the X-ray catalogs. However, this task has recently been simplified thanks to a re-analysis of the Chandra images during the MYStIX project (Feigelson et al., 2013). We take values for NGC 2264 stars as listed in the MPCM (MYStIX Probable Complex Member) young stars catalog of Broos et al. (2013), adjusting them to our adopted distance of [the Baxter et al. (2009) distance of was adopted for the MYStIX project (Feigelson et al., 2013)]. The X-ray luminosities were calculated using the XPHOT method of Getman et al. (2010). This allows the analysis of faint X-ray sources that cannot be handled by traditional X-ray spectral fitting methods. Adoption of the MYStIX NGC 2264 X-ray luminosities thus ensures that we are using values that have been calculated in a uniform manner for stars throughout the cluster. We have therefore neglected the XMM-Newton data of Dahm et al. (2007). Due to the wider field of view of their observations, the Dahm et al. (2007) catalog contains 43 additional X-ray sources with spectral types and photometry that would have made our final sample, see section 3, but which we do not consider here.
2.2.2 Spectral types & photometry
We collated spectral types for NGC 2264 members from the catalogs of Rebull et al. (2002), Lamm et al. (2004), Kumar et al. (2004), Dahm & Simon (2005), Sung, Bessell & Lee (1997), and Mariñas et al. (2013), adopting a spectral type that is the median of the observed range. As the Mariñas et al. (2013) spectral types have been assigned from IR spectra, we neglect their spectral types when they are found to be later than those determined from optical spectra (for the same reason as with the ONC data, see section 2.1.2). The Lamm et al. (2004) catalog is a compendium of values from Rebull et al. (2002) (but an updated version of their catalog with several new spectral types being reported) and spectral types attributed to “Young et al. (private communication)”. Some of the Dahm & Simon (2005) spectral types were assigned from the author’s own observations, while others were taken from the catalogs of Walker (1956), Herbig & Bell (1988), Rebull et al. (2002), and Lamm et al. (2004).
We again assigned effective temperatures from the conversions of Pecaut & Mamajek (2013), neglecting sources earlier than F0 and later than M5. We then removed sources which have been identified as, or are suspected, close binary stars, in case of confusion in the assigned photometry and/or X-ray luminosities. These were SIMBAD ID: Cl NGC 2264 RMS 3323 (Padgett & Stapelfeldt, 1994); Cl NGC 2264 RMS 3470 and Cl NGC 2264 RMS 3578 (Mathieu, 1994; Karnath et al., 2013); Cl NGC 2264 LBM 6083 (e.g. Windemuth & Herbst 2014); Cl NGC 2264 RMS 2465, 3157, 3307, 3370, and 3390, which are identified as “adaptive optics” binaries by Dahm et al. (2007); and stars listed as single and double line spectroscopic binaries by Fűrész et al. (2006). We have also removed Cl NGC 2264 RMS 3582 which is listed as an eclipsing binary in SIMBAD. Further investigation reveals that this star is listed in the International Variable Star Index (VSX) database (as NSV 3128) having been identified as a possible eclipsing variable by Koch & Perry (1974) (the star is listed as Penna 414 in their table). The recent study of Klagyivik et al. (2013), where several eclipsing and other binaries in NGC 2264 were identified (see below), classified Cl NGC 2264 RMS 3582 as a non-periodic variable (the system is listed as SRa01a_26062 in their work). Its binary nature is therefore questionable, but we have erred on the side of caution and have removed it from our sample. Further observations of this object are required.
Additional close binary systems, and many more exotic variables, have been identified by Klagyivik et al. (2013). From ground based time series photometry they classified periodically variable stars according to the categories of the General Catalogue of Variable stars (Samus et al., 2009). They classified many as YSOs (young stellar objects), as one would expect for a star forming region. Neglecting stars in our final sample that were either not classified by Klagyivik et al. (2013) or which were classified as YSO or MISC (miscellaneous or non-periodic variables) 43 stars with different types of variable classification remain. For example, three of the stars in our final sample are classified by Klagyivik et al. (2013) as GDOR, Doradus stars. These are late A to late F-type variable stars that undergo non-radial pulsations (e.g. Balona, Krisciunas & Cousins 1994; Kaye et al. 1999). However, multiple, independent, spectroscopic studies have classified these stars (Cl NGC 2264 RMS 3440, 3519, & 3840) as early to mid-M type (e.g. Rebull et al. 2002; Lamm et al. 2004), and there is little to suggest that they are anything but normal, low mass, PMS stars.
Thirty three other stars in our final sample have been classified by Klagyivik et al. (2013) as EA (2/33) or EB (2/33), types of eclipsing binary, or as ELL (27/33 rotating ellipsoidal variables - a type of non-eclipsing close binary system) or ELL/SP (2/33), stars with light curves that could be described as ELL systems, or with variability caused by star spots. However, a preliminary examination of the photometry and spectra collected as part of the CSI 2264 project (Coordinated Synoptic Investigation of NGC 2264; Cody et al. 2014) reveals no evidence of binarity in 85% of these stars, and only tentative evidence in the other cases (A. Cody, private communication). Klagyivik et al. (2013) mention that their classifications are expected to be 70% accurate. In a region such as NGC 2264, where coordinated multi-wavelength photometric and spectroscopic surveys have been conducted, and where light curves of young stars can show complex variability patterns due to star spots, accretion, and obscuration of stars by warped inner disk material, their classifications based solely on the morphology of light curves may be even less accurate. We have therefore neglected the classifications of Klagyivik et al. (2013) as they clearly require re-determination.
For stars with spectral types, we obtained Cousins and photometry from Rebull et al. (2002), Lamm et al. (2004), Dahm & Simon (2005), and Dahm et al. (2007), in that order. We then derived extinctions from with the latter being derived with a common extinction law for the cluster, equation (1), using the intrinsic colours of Pecaut & Mamajek (2013) appropriate for each spectral type. Bolometric luminosities then followed from equation (2).444During their X-ray study of a portion of NGC 2264 Flaccomio et al. (2006) derived bolometric luminosities assuming a uniform extinction law for the cluster, but used observed and intrinsic colours and bolometric corrections from the dwarf star effective temperature-spectral type conversion scale of Kenyon & Hartmann (1995), with the intermediate gravity scale of Luhman (1999) for M stars. As Pecaut & Mamajek (2013) do not provide intrinsic colours for PMS stars involving the Cousins band we cannot use the observed photometry to derive luminosities, and have used instead (as did Rebull et al. 2006).
2.3 IC 348
The open cluster IC 348, a region of ongoing star formation, is part of the Perseus dark cloud complex and thought to be associated with both NGC 1333 and the Perseus OB2 association (Herbst, 2008).
2.3.1 X-ray luminosities
We have taken X-ray fluxes of PMS stars from the IC 348 catalog of Stelzer et al. (2012). It was created by merging four archival Chandra observations, namely Obs IDs 606 (PI: Preibisch, 52), 8584 (PI: Calvet, 50), and 8933 & 8944 (PI: Wolk, 40 for each). The data were originally published by Preibisch & Zinnecker 2001 (see also Preibisch & Zinnecker 2002) for 606, and by Forbrich, Osten & Wolk (2011) for 8933 & 8944. To the best that we can determine, the data obtained for Obs ID 8584 were not published prior to the Stelzer et al. (2012) work. We converted the X-ray fluxes to X-ray luminosities with our assumed distance to IC 348 of (Stelzer et al. 2012 assumed a slightly lower value of in their work).
2.3.2 Spectral types & photometry
We obtained spectral types of IC 348 PMS stars from Muench et al. (2007), most of which were as cataloged by Luhman et al. (2003) who collated literature estimates from Harris, Morgan & Roman (1954), Luhman et al. (1998), Strom, Strom & Carrasco (1974), Herbig (1998), and Luhman (1999), as well as assigning their own for several stars. Their catalog also includes spectral types from Luhman et al. (2005). Once again, we removed O, B, and A-type stars, and stars later than M5, and assigned effective temperatures based on the PMS conversion scale of Pecaut & Mamajek (2013).
We again removed known or suspected spectroscopic binaries from our sample, as listed by Duchêne, Bouvier & Simon (1999), Nordhagen et al. (2006), and Dahm (2008c).
Luhman et al. (2003) argues that the -band provides the best estimates of bolometric luminosities for stars in IC 348 (except for a few binaries that are better resolved in the optical, see below). For the majority of stars with spectral types we obtained and -band magnitudes from the 2MASS All-Sky Catalog of Point Sources (Cutri et al., 2003; Skrutskie et al., 2006). To de-redden the -band magnitudes we calculated the extinction from the extinction law of Rieke & Lebofsky (1985),
| (3) |
where the intrinsic colour appropriate for the spectral type is taken from Pecaut & Mamajek (2013). We then calculated luminosities using an equation analogous to equation (2), applying spectral type dependent bolometric corrections at the 2MASS -band as listed in Pecaut & Mamajek (2013).
Luhman et al. (2003) identified four binary systems (8 stars) which are better resolved at optical wavelengths than in the infrared. We follow Luhman et al. (2003) and derive luminosities using the -band magnitudes rather than for these stars. We obtained magnitudes and colours from Herbig (1998), which was available for four of the eight stars. We de-reddened the magnitudes using equation (1). The bolometric luminosity then follows from equation (2) with calculated from the tabulated Pecaut & Mamajek (2013) and intrinsic colours appropriate for the spectral type.
2.4 NGC 2362
The open cluster NGC 2362, occasionally referred to as the Canis Majoris Cluster in reference to its most massive member the O9 star CMa, is the oldest star forming region in our sample (e.g. Dahm 2008a).
2.4.1 X-ray luminosities
We have taken X-ray luminosities from the MYStIX project MPCM young stars catalog of Broos et al. (2013). The MYStIX project was a reanalysis of previously published Chandra data (Obs ID: 4469, PI: Murray), NGC 2362 having been observed for in December 2003 (Delgado et al., 2006; Damiani et al., 2006; Dahm & Hillenbrand, 2007).
2.4.2 Spectral types & photometry
There are few detailed spectroscopic studies of NGC 2362, with spectral types only available for a handful of cluster members. We take spectral types from Dahm & Hillenbrand (2007), which includes minor updates and adds a few new spectral types to the catalog of Dahm (2005). As for the other clusters, we neglect stars earlier than F0. -band magnitudes and colours are also taken from Dahm & Hillenbrand (2007). We then calculated stellar luminosities by dereddening the observed -band magnitudes, with the application of appropriate bolometric corrections for each spectral type [see equations (1) and (2)].
2.5 NGC 6530
NGC 6530 lies towards the Galactic centre, in the Sagittarius–Carina arm, and is associated with the Lagoon Nebula (M8; Tothill et al. 2008).
2.5.1 X-ray luminosities
We again take X-ray luminosities from the MPCM MYStIX catalog (Broos et al., 2013), with a small adjustment to account for our adoption of a distance to NGC 6530 of [see Appendix A and Table 1; was assumed for the MYStIX project (Feigelson et al., 2013)]. The MYStIX project NGC 6530 data includes a re-analysis of the previously published Chandra data of the cluster (Damiani et al. 2004; Obs ID: 977, PI: Murray, ).555A shorter XMM-Newton exposure of NGC 6530 was previously published by Rauw et al. (2002).
2.5.2 Spectral types & photometry
Spectral types of cluster members were collated from Prisinzano et al. (2012), Arias, Barbá & Morrell (2007), van den Ancker et al. (1997), and Walker (1961).666Spectral types were also considered from Walker (1957) and Kumar et al. (2004) but none of these stars made our final sample. We removed sources of spectral type earlier than F0, as well as three stars of luminosity class II. We again adopted median spectral types of the literature values (see the discussion for the ONC).
We then removed known or suspected spectroscopic binaries from our sample, as listed by Henderson & Stassun (2012) and Prisinzano et al. (2007), in case of confusion in the X-ray luminosities, spectral typing, or photometry. Non-members, as determined by Prisinzano et al. (2007, 2012) were also removed.
3 Stellar parameters: mass, age & internal structure
With effective temperatures and bolometric luminosities of the stars in the five star forming regions that we consider to hand, we calculated the stellar masses and ages using the models of Siess et al. (2000) - with convective overshooting. In such a way, our stellar mass, , and age, , estimates are consistent across the entire sample. The Siess et al. (2000) mass tracks have somewhat limited stellar mass resolution, so we constructed a series of interpolated mass tracks and produced a code that automatically calculates and given and as an input. Our code also estimates whether a star is fully convective or partially convective with a radiative core, and if the latter, the radiative core mass and radius relative to the total stellar mass and radius. During this process we have not considered how errors in the assigned spectral type, or in the calculated luminosities, translate into errors in and . However, recently Davies, Gregory & Greaves (2014) did so, and estimated such errors for stars in the ONC using a stellar sample assembled in a similar manner to our own. Using their study as a guide there is a typical error of 0.1, 0.2, 0.4, and 0.5 for stars of mass 0.1-0.6, 0.6-1, 1-2, and 2-3 respectively. For ages , errors of are typical, rising to 3, 6.4, and 11 Myr for stars of age of 2.5-5, 5-10, and 10-15. The age error increases for older stars because PMS contraction proceeds on the Kelvin-Helmholtz timescale, which scales inversely with stellar radius. Stellar contraction thus slows with age (see Figure 1), decreasing the separation between isochrones in the plane as stars evolve along their mass tracks.
We adopt the Siess et al. (2000) models in preference to others as they cover a sufficient range of stellar mass and, crucially for the purposes of this paper, provide stellar internal structure information. Other, more modern, models often have a limited range in stellar mass. For example, the publicly available mass tracks and isochrones of Baraffe et al. (2015), which are superb for low-mass and fully convective PMS stars, are limited to 1.4. The Siess et al. (2000) models are also one of the most commonly used by the PMS star community, and the authors have provided a convenient online interpolator for generating isochrones of desired age. Furthermore, the Siess et al. (2000) models were used by several large X-ray surveys (e.g. Preibisch et al. 2005; Telleschi et al. 2007), which allows for a more direct comparison with our results; differences then being attributable to the updated spectral typing and our use of PMS calibrated intrinsic colours and bolometric corrections. In Appendix D we demonstrate, using the models of Jung & Kim (2007) and Tognelli, Prada Moroni & Degl’Innocenti (2011), that the main results of our paper, described in the following sections, are unaffected by the choice of PMS evolutionary model.
Before estimating and we removed 37 stars that were to the right of the mass track in the H-R diagram (12 from the ONC, 3 from NGC 2264, and 22 from IC 348). This is the lowest available mass track in the Siess et al. (2000) models, and therefore we could not accurately assign and values for such stars. In practise, this makes little difference to the work in this paper as we are primarily interested in partially convective PMS stars, and stars of mass 0.35 remain fully convective for the entirety of their PMS (and subsequent main sequence) evolution (e.g. Chabrier & Baraffe 1997). We also removed 3 stars which were more massive than , the upper mass limit of our study (2 from the ONC and 1 from NGC 2264). Although these 3 stars are currently of spectral type G2, G5, and K2, they will evolve into Herbig AeBe stars and, eventually, B-type main sequence stars (Siess et al., 2000). We neglected 3 stars which appeared to be younger than (2 from the ONC and 1 from IC 348) and 10 stars that were located below the ZAMS (5 from the ONC, 2 from NGC 2264, and 3 from IC 348). It is likely that such stars have inaccurate luminosity estimates and are positioned incorrectly in the H-R diagram. Stelzer et al. (2012) comment that stars which fall significantly below the ZAMS may be PMS stars with edge-on discs observed in scattered light. Stars as young as 0.01 may not yet have evolved to the birthline and should not be optically visible (Stahler, 1983). Indeed, estimates suggest that it takes a star about 0.1 to 0.3 to complete the embedded phase of star formation (e.g. Offner & McKee 2011; Dunham & Vorobyov 2012). In practise, stars at such a young age are fully convective, and therefore have no bearing on our study of partially convective PMS stars.
| fully convective | radiative core | ||||||||
|---|---|---|---|---|---|---|---|---|---|
| region | mean | std. dev. | median | M.A.D. | mean | std. dev. | median | M.A.D. | |
| all | 803; 147 | -3.44 | 0.59 | -3.36 | 0.45 | -3.57 | 0.68 | -3.48 | 0.48 |
| ONC | 423; 43 | -3.56 | 0.66 | -3.52 | 0.53 | -3.30 | 0.61 | -3.30 | 0.47 |
| NGC 2264 | 190; 57 | -3.20 | 0.39 | -3.18 | 0.30 | -3.58 | 0.54 | -3.44 | 0.38 |
| IC 348 | 106; 19 | -3.55 | 0.53 | -3.55 | 0.40 | -4.00 | 1.01 | -3.61 | 0.69 |
| NGC 2362 | 43; 6 | -3.09 | 0.38 | -3.19 | 0.26 | -3.31 | 0.27 | -3.35 | 0.23 |
| NGC 6530 | 41; 22 | -3.37 | 0.40 | -3.34 | 0.32 | -3.76 | 0.67 | -3.65 | 0.51 |
| Hayashi track | Henyey track | ||||||||
|---|---|---|---|---|---|---|---|---|---|
| region | mean | std. dev. | median | M.A.D. | mean | std. dev. | median | M.A.D. | |
| all | 894; 56 | -3.43 | 0.58 | -3.36 | 0.44 | -3.95 | 0.78 | -3.76 | 0.60 |
| ONC | 459; 7 | -3.53 | 0.66 | -3.48 | 0.52 | -3.89 | 0.27 | -3.98 | 0.18 |
| NGC 2264 | 221; 26 | -3.22 | 0.38 | -3.22 | 0.30 | -3.81 | 0.66 | -3.68 | 0.51 |
| IC 348 | 113; 12 | -3.54 | 0.54 | -3.54 | 0.40 | -4.30 | 1.10 | -3.75 | 0.85 |
| NGC 2362 | 48; 1 | -3.12 | 0.38 | -3.22 | 0.26 | -2.94 | - | -2.94 | - |
| NGC 6530 | 53; 10 | -3.40 | 0.41 | -3.43 | 0.33 | -4.06 | 0.79 | -4.25 | 0.63 |
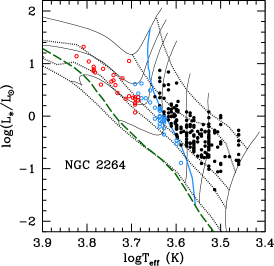
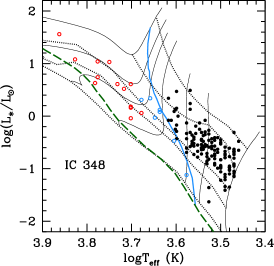
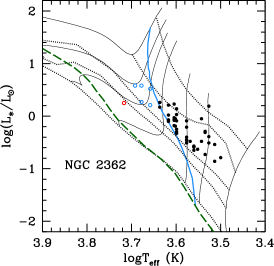
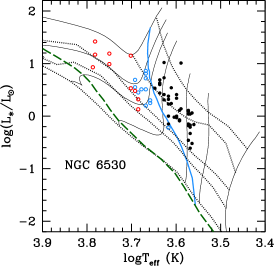
Our final sample consists of a total of 984 PMS stars including 466 from the ONC, 247 from NGC 2264, 159 from IC 348 (125 with X-ray luminosities and 34 with upper limits), 49 from NGC 2362, and 63 from NGC 6530. H-R diagrams for the final sample of stars are shown in Figure 3, where the solid blue line separates stars which are partially convective from those that are fully convective.
It is clear from visual inspection of Figure 3 that NGC 6530 and the ONC are the youngest clusters, with stars of median age 1.3 and 1.7 respectively, while NGC 2264, IC 348, and NGC 2362 are older with median ages of 2.2, 2.3, and 2.6 - a similar ordering compared to other studies (e.g. Mayne & Naylor 2008). We also note that for clusters where the spectroscopic surveys are close to complete, such as the ONC, IC 348, and NGC 2264, the fraction of partially convective stars (those to the left of the blue line in Figure 3) is a proxy for the age of the star forming region. For older clusters a larger fraction of stars will have become partially convective compared to younger regions.
4 Comparing the X-ray properties of stars on convective and radiative tracks in the H-R diagram
In this section we compare the X-ray properties, and , of partially and fully convective PMS stars, and of those on Hayashi and Henyey tracks in the H-R diagram.
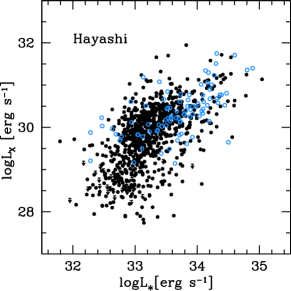
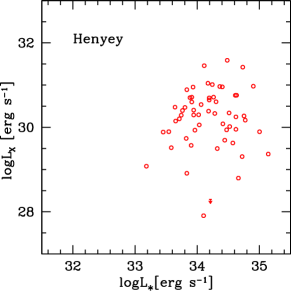
We consider four groups of PMS stars: i) those which have fully convective interiors; ii) those which have partially convective interiors consisting of a radiative core with an outer convective envelope; iii) those on Hayashi tracks in the H-R diagram; and iv) those on Henyey tracks in the H-R diagram. It is clear from PMS stellar evolution models (e.g. Siess et al. 2000), from Figure 3, and the discussion in section 1 that radiative core development can occur several Myr before stars transition onto their Henyey tracks. When the radiative core first begins to grow, the luminosity of the star initially continues to decrease before the transition into the Henyey phase where the stellar luminosity rises and the star moves upwards and left in the plane. Our group iii) (Hayashi track stars) therefore contains a mixture of both fully convective and partially convective stars, whereas our group iv) (Henyey track stars) contains only stars which have evolved to the point where the physics of their internal structure is driving them towards greater luminosities. Henyey track PMS stars have radiative cores of size 0.5 and mass 0.7.
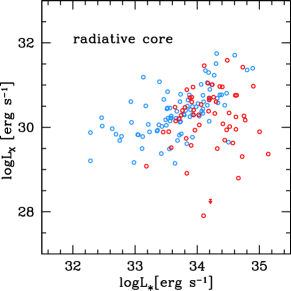
In terms of the H-R diagrams shown in Figure 3, the filled black points are the fully convective sample, and the open red/blue points the radiative core sample. The black and blue points together form the Hayashi sample (all still have decreasing with age), and the red points form the Henyey sample (which all have increasing with age).
Within our sample of 984 PMS stars, the majority, 836, are fully convective (of which 402 are of mass 0.35 and will remain fully convective) while 148 have developed radiative cores. For the ONC, 423 and 43 stars are fully convective and partially convective respectively, with 190 and 57 for NGC 2664, 139 and 20 for IC 348 (106 and 19 with X-ray luminosities; 33 and 1 with upper limits), 43 and 6 for NGC 2362, and 41 and 22 for NGC 6530.
For our entire sample of 984 stars, 927 are on Hayashi tracks in the H-R diagram while 57 have evolved onto Henyey tracks. For the ONC, 459 and 7 stars are on Hayashi and Henyey tracks respectively, with 221 and 26 for NGC 2664, 146 and 13 for IC 348 (113 and 12 with X-ray luminosities; 33 and 1 with upper limits), 48 and 1 for NGC 2362, and 53 and 10 for NGC 6530.
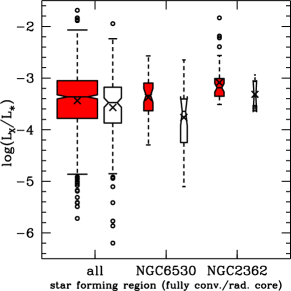
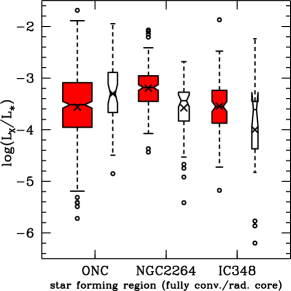

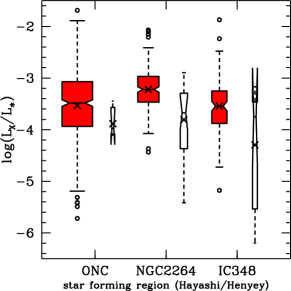
Tables 2 and 3 list the mean, standard deviation, median, and median absolute deviation of for the four stellar samples, both for all five star forming regions combined and individually [see Appendix B for a comparison of and ]. The number of stars in each category is listed as . The stars from IC 348 with upper limits are not considered in Tables 2 and 3, nor in Figure 4, but are considered in the regression fits discussed below. The sample distributions are plotted graphically as box plots in Figure 4 for the regions combined, and individually. The box plot widths are proportional to the square root of the sample size, which highlights that the bulk of the PMS stars have fully convective interiors. The whiskers extend from the quartile to the quartile times the interquartile range777The interquartile range is the difference between the upper and lower quartiles. ( for the upper whisker, for the lower whisker), or to the maximum or minimum of the sample if this is smaller than the whisker length would otherwise be, with outliers plotted for the former case. The box plots are notched with the notch height extending from the median of the sample to , where is the sample size and the interquartile range (e.g. Chambers et al. 1983). The notches provide a simple way of determining whether a difference in the medians between samples is significant (roughly when the notches of the box plots being compared do not overlap e.g. McGill, Tukey & Larsen 1978).
We note in passing that, on average, partially convective PMS stars have larger and larger compared to fully convective stars (likewise for stars on Henyey tracks compared to those on Hayashi tracks, where the difference is greater888The stellar population of NGC 6530 is an exception to this trend for as a result of an observational bias (the cluster has a lack of low-mass PMS stars that have estimated spectral types available in the literature, see Appendix B).). This is exactly as expected, as fully convective stars are located in the lower right of the PMS of the H-R diagram, see Figure 3, whereas partially convective stars are predominantly in the upper left. X-ray luminosity is known to correlate with stellar luminosity (e.g. Telleschi et al. 2007 as well as Figure 5 and the discussion below) and therefore the partially convective stars are also more X-ray luminous than those which are fully convective. Likewise, is correlated with stellar mass (e.g. Flaccomio et al. 2003b; Preibisch et al. 2005), and as the partially convective stars are typically more massive than the fully convective stars (evident from their H-R diagram positions alone), it is not a surprise that we find them to be brighter in X-rays.
Of particular interest is the comparison between for fully convective stars and those with radiative cores (and for stars on Hayashi and Henyey tracks), and the relationship between and for stars with different internal structure. Previous studies have reported that PMS stars on radiative tracks have lower compared to those on convective tracks in the H-R diagram (e.g. Feigelson et al. 2003; Flaccomio et al. 2003c; Rebull et al. 2006; Currie et al. 2009; Mayne 2010). The most quantitative study of this effect, that of Rebull et al. (2006), report a factor of 10 reduction in for partially convective compared to fully convective PMS stars in the mass range . The Rebull et al. (2006) sample of stars, from NGC 2264 (and from the Orion Flanking Fields (FFs) a region we do not consider in this paper), contained many X-ray luminosity upper limits which were carefully accounted for. Thanks to the improved X-ray data analysis methods of Getman et al. (2010), see section 2.2.1, these upper limits have been replaced by firm detections. This, combined with our larger sample from multiple star forming regions999Rebull et al. (2006) consider a sample of 317 detections plus 139 upper limits from NGC 2264 (and 250 detections plus 80 upper limits from the Orion FFs). About 28% of their sample are upper limits. For comparison, our total sample consists of 950 detections and 34 upper limits, about 3%. There are, however, important difference between our data sets, the most important being that Rebull et al. (2006) include stars without spectral type estimates, dereddening the photometry of such stars using “the most likely reddening in the direction of the cluster”. Our sample size would increase had we adopted a similar approach rather than selecting only stars with spectral types. and updated stellar luminosity/mass/age estimates, warrants a detailed comparison of for PMS stars of differing internal structure, as well as the correlation between and .

| std. dev. | prob. | ||||
|---|---|---|---|---|---|
| all stars | 984 (34) | 2.821.23 | 0.810.04 | 0.62 | 5e-5 |
| fully convective | 836 (33) | -1.061.49 | 0.930.04 | 0.61 | 5e-5 |
| radiative core | 148 (1) | 19.13.0 | 0.330.09 | 0.60 | 5e-5 |
| Hayashi track | 927 (33) | -0.651.32 | 0.920.04 | 0.60 | 5e-5 |
| Henyey track | 57 (1) | 25.68.0 | 0.130.23 | 0.73 | 0.518 |
| Hayashi track with radiative core | 91 (0) | 9.912.82 | 0.610.08 | 0.44 | 5e-5 |


Considering our whole sample of stars we find only a slight reduction in for radiative core stars, of 0.13 dex, when comparing them to fully convective stars (Figure 4, upper left, and Table 2). The difference is larger when comparing the Henyey and Hayashi sample (Figure 4, lower left, and Table 3) with stars on Henyey tracks having of 0.52 dex less than those on Hayashi tracks. It is immediately apparent when we consider the individual star forming regions why we find little difference in between fully convective stars and stars with radiative cores when considering all five star regions combined. The partially convective sample of stars have lower compared to fully convective stars in each region except the ONC, where the trend is the opposite way around. is, however, less for Henyey track compared to Hayashi track stars in the ONC. The ONC is one of the youngest star forming regions, and an examination of the H-R diagrams in Figure 3 reveals that few partially convective stars in our ONC sample have yet evolved onto Henyey tracks (about 80% of the partially convective stars in the ONC sample are still on Hayashi tracks). In the other regions the partially convective stars have evolved further towards the ZAMS. This immediately indicates that there is something happening in the evolution of as PMS develop radiative cores, with the decrease becoming greater as stars evolve onto Henyey tracks. If the ONC is removed, and the other four regions are considered together, we find a reduction in of 0.38 (0.64) dex when comparing fully convective to radiative core (Hayashi to Henyey track) stars, a larger difference than when the ONC is included.
The mean value of can be written as,
| (4) |
where and are the mean values of and respectively. If the mean logarithmic X-ray and bolometric luminosities of stars on Hayashi tracks are denoted and then the equivalent for stars on Henyey tracks can be written as and ; where to ensure that and (as required since Henyey track stars are more luminous than Hayashi track stars, on average, see Appendix B). Using equation (4) the fractional X-ray luminosities are then related as,
| (5) |
Therefore, in order to explain why is smaller for Henyey track stars compared to Hayashi track stars, we require that . In other words, the increase in for Henyey track stars when comparing them to Hayashi track stars must be less than the corresponding increase in in order to ensure that . This smaller increase is readily apparent when considering the correlation between and for the complete sample. Figure 5 plots versus with the results of linear regression fits given in Table 4.
For the linear regression fits we used the EM (expectation maximisation) algorithm of the ASURV (Astronomy SURVival analysis) package, as described by Isobe, Feigelson & Nelson (1986). To calculate the probabilities that correlations are present we used generalized Kendall’s tests within the ASURV package. ASURV allows censored data, upper limits in our case, to be properly accounted for in the analysis, alongside detections. The EM algorithm is a parametric technique that yields the linear regression coefficients (the gradient and the ordinate intercept) assuming a normal distribution for the residuals. In the absence of censored data the EM algorithm provides an ordinary least squares fit. In Table 4, and throughout, we present the values of the regression coefficients to two decimal places to be consistent with the literature; notice, however, that the uncertainties are sometimes large enough that the second decimal place is not fully justified.
Examination Figure 5 and Table 4 reveals that fully and partially convective stars behave differently in terms of their X-ray emission, with the effect becoming more pronounced when comparing stars on Hayashi and Henyey tracks. For fully convective PMS stars we find an almost linear relationship between the stellar and X-ray luminosities, , as has been reported by other authors (e.g. Telleschi et al. 2007). The power law dependency is weaker for PMS stars that have developed radiative cores, . If we consider the Hayashi sample, which includes all of the fully convective stars as well as some that are partially convective (those which still have reducing with increasing age) the almost linear relationship is maintained, . However, this hides the fact that the Hayashi sample is dominated by the behaviour of the 836 fully convective stars, compared to the 91 Hayashi track partially convective stars. If we consider only the 91 stars, the blue points in Figure 5, we find a weaker power law dependence, , than what is obtained for the fully convective stars alone. A two-sided Kolmogorov-Smirnov test gives a probability of 1e-8 that the distribution of for partially convective Hayashi track stars is drawn from the same parent population as that for fully convective Hayashi track stars. For PMS stars on Henyey tracks we find no correlation between and , with a probability of 0.52 from a generalised Kendall’s test. Taken together, this is evidence for an evolution in the X-ray emission from PMS stars as they evolve across the H-R diagram and develop radiative cores. The X-ray luminosity appears to begin to decrease once a radiative core develops, with the effect becoming more pronounced for stars that have evolved onto Henyey tracks and which have substantially radiative interiors.
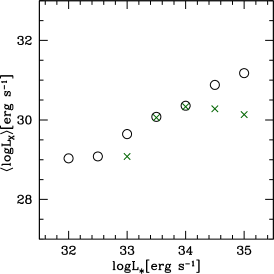
The difference in X-ray emission properties of Hayashi and Henyey track stars is further illustrated in Figure 6. The figure is constructed from the Hayashi and Henyey plots in Figure 5. The correlation between and is clear for Hayashi track stars, with increasing uniformly with . For Henyey track stars, as we increase in , there is no corresponding increase in . The mean values in each bin are shown in the right panel of Figure 6. As we increase in the mean values of for Hayashi (black circles) and Henyey (green crosses) track stars are initially well matched. The most luminous PMS stars on Hayashi tracks are, however, more X-ray luminous than those of comparable on Henyey tracks. The reduction in for Henyey track compared to Hayashi track PMS stars is therefore directly related to how the X-ray emission evolves with radiative core growth. In the next section we compare X-ray luminosities with the length of time that stars have spent with partially convective interiors.
5 X-ray luminosity and radiative core development
5.1 The evolution of the X-ray luminosity of partially convective PMS stars
In this section we demonstrate that for partially convective PMS stars the stellar X-ray luminosity is anti-correlated with the length of time that stars have spent with partially convective interiors.
For the partially convective PMS stars we can estimate how long it has been since they developed a radiative core, ,
| (6) |
where and the stellar age are in units of Myr, and the expression is valid for . The second term is an approximation for when a star of specified mass ends the fully convective phase of evolution, derived by Gregory et al. (2012) using the same Siess et al. (2000) models as we adopt here.101010For a fully convective star with equation (6) yields a negative number, the modulus of which is the number of Myr that the star still has to evolve before developing a radiative core. Likewise, for a star on the Hayashi track with , equation (7) yields a negative number, the modulus of which is the number of Myr that the star still have to evolve before transitioning onto its Henyey track.
In a similar fashion, we can derive a rough estimate from the Siess et al. (2000) models for how long it has been since a PMS star transitioned onto the Henyey track,
| (7) |
where both and are in units of Myr, and the expression is valid for . Stars of mass never transition onto Henyey tracks; they evolve directly from their Hayashi tracks to the ZAMS.
By subtracting equation (6) from (7) we can estimate the delay, in Myr, between when a star develops a radiative core until it subsequently transitions from its Hayashi track to its Henyey track in the H-R diagram. As shown in Figure 7, a solar mass star requires 12 of evolution from ending the fully convective phase to transitioning onto its Henyey tracks [a radiative core begins to grow within a solar mass star after 2.6, equation (6) while it takes 14.7 to reach the Henyey track, equation (7)]. As expected, the delay is less/more for higher/lower mass stars.
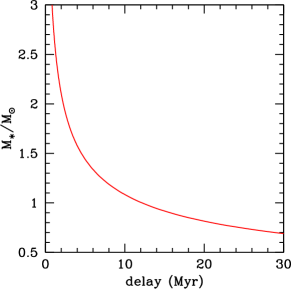
Figure 8 plots versus the time, in Myr, since the beginning of radiative core development, , estimated from equation (6). Using the EM algorithm in ASURV we find that,
| (8) |
which (neglecting the errors) is the equation of the black line in Figure 8. The standard deviation is 0.59 and the probability of there not being a correlation from a generalized Kendall’s test is , indicating the presence of a strong correlation. PMS stars that have spent longer with radiative cores have lower X-ray luminosities, albeit with a large scatter in values at a given . Such scatter in is inherent to all of the reported X-ray correlations, those with stellar mass, age, and bolometric luminosity (e.g. Preibisch et al. 2005, section 4, and Appendix C), and here with time since radiative core development. Magnetospheric accretion may contribute to some of this scatter, as we will address in future work. For now, we note that if star forming regions are considered as a whole, then accreting PMS stars are observed to be a factor of 2-to-3 times less luminous in X-rays than the non-accretors (e.g. Stelzer & Neuhäuser 2001; Flaccomio, Micela & Sciortino 2003a; Preibisch et al. 2005; Telleschi et al. 2007). We thus expect the differences between the accreting and non-accreting stars to give rise to a scatter of 0.4 dex in (see Preibisch & Feigelson 2005). This is far less than the observed scatter of 2.5 dex apparent from Figure 8. Accretion alone cannot explain the observed scatter in .
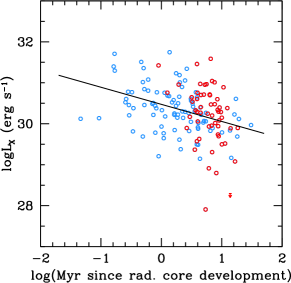
If we only consider the Hayashi track partially convective stars, the blue points in Figure 8 we find,
| (9) |
with a standard deviation of 0.51 and with the probability of there not being a correlation of . This is almost identical to that found when considering all of the partially convective stars [equation (8]. Considering only Henyey track stars, the red points in Figure 8 gives,
| (10) |
with a standard deviation of 0.68 and with the probability of there not being a correlation of . Tentatively, this perhaps indicates that the drop in stellar X-ray emission quickens once stars have evolved onto Henyey tracks in the H-R diagram. However, the probability of there being a correlation is marginal for this subsample. A power law decay of the form () may not sufficiently approximate the true behaviour of a star’s X-ray emission with time since radiative core development for the entirety of its subsequent PMS evolution.
Is the strong correlation , equation (8), a consequence of the correlations between and stellar mass , and between and age (see Appendix C)? We do not believe that it is, although does depend on both quantities, see equation (6). Imagine that we had a sample of approximately coeval PMS stars. As we consider progressively more massive stars in the sample there would come a point where the stars transitioned from fully convective to partially convective objects. As the sample is nearly coeval, the more massive the star, the longer it would have spent with a radiative core; and as is positively correlated with , we would also expect them to be more X-ray luminous, on average, than the lower mass stars in the sample. Thus we would expect stars which have spent longer with radiative cores to have larger , and therefore there would be a positive correlation between and . We observe the opposite, see Fig. 8.
Although X-ray luminosities are positively correlated with stellar mass, many of the partially convective stars, and in particular those on Henyey tracks, fall below the main body of the correlation (see Appendix C.1 and Fig. 12). Are these stars the ones that are the cause of the correlation? To test this, we removed the partially convective stars that fall on or below the dashed line in Fig. 12, which has the same gradient as the linear regression fit to the entire sample (see Table 5). Although this cut is arbitrary, the results below are the same if we choose a slightly different gradient and intercept. With the stars removed the correlation is maintained but with a weaker decay: exponent and a probability of 0.0004 [see equation (8)]. The decrease in with time since radiative core development is therefore apparent even for the stars within the main body of the correlation.
Our sample is also not coeval. A significant age spread does exist in all of the star forming regions, evident from the H-R diagram shown in Fig. 3. Also noticeable, by eye from the H-R diagrams, is that the earlier spectral type stars (those of large ) appear to be older, on average, than those of later spectral types. This has been noted before. Hillenbrand, Bauermeister & White (2008) argue that PMS evolutionary models under predict the age of low mass stars with, for example, G-type stars being 2-5 times older than K-types (Herczeg & Hillenbrand, 2015). If we focus only on the partially convective PMS stars that form the correlation in Fig. 8 there is less of an age difference. We separated this subsample into early and late spectral types and found the biggest age difference when using a spectral type cut of earlier than K0 and K0 & later, but of only 0.9.
To examine if this had any bearing on the correlation, we increased the age of the KM-type stars in Fig. 8 by a constant such that their mean age matched the mean age of the FG-type stars. This shifted 18 stars from Hayashi to Henyey tracks. The correlation was maintained although with a steeper decay than that from equation (8) with an exponent of and a probability of 5e-5. However, increasing the age of KM-types stars results in additional stars becoming partially convective. Accounting for this adds 29 stars to the partially convective sample and results in slower decay with an exponent of and a probability of 0.0001. For completeness, we also tried decreasing the age of the FG-type stars such that their mean age matched the mean age of the partially convective KM-type stars even though this is the opposite of what the work of Hillenbrand et al. (2008) suggests, where it is the late types that have under predicted ages. This resulted in a smaller sample of 120 partially convective stars, with 28 moving to portions of their mass tracks where they have fully convective interiors. Again the correlation was maintained with an exponent of and a probability of 0.0023. We can therefore conclude that any age difference between early and late spectral type stars inherent in our adopted PMS evolutionary model has no bearing on the basic result. We also note that our results are unaffected by the choice of PMS evolutionary model (see Appendix D). On average, the longer a PMS star has spent with a partially convective interior the less X-ray luminous it becomes.
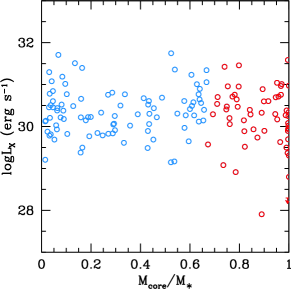
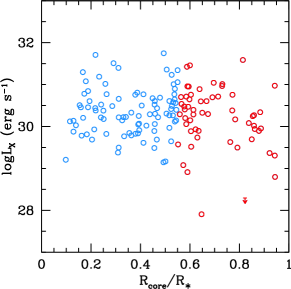
5.2 X-ray luminosity as a function of core mass and radius
As shown in Figure 9, we find no simple correlation between and radiative core mass, nor between and radiative core radius. This lack of a clear relationship between radiative core size and , with 2 dex variation in at any given core mass or radius, likely contributes to the scatter in the other correlations e.g. between and time since core development. We do find a strong correlation () between and radiative core density, , with, . However, this is a consequence of the correlation between and (see section 4), as scales inversely with (Siess et al., 2000).
6 Discussion & conclusions
We have presented a thorough examination of the differences in, and the evolution of, the coronal X-ray emission properties of fully and partially convective PMS stars. We considered the most up-to-date spectral types, X-ray luminosities, and photometry from the literature for PMS stars in five of the best studied star forming regions: the ONC, IC 348, NGC 2264, NGC 2362, and NGC 6530. The spectral type of each star was estimated from spectra and not by comparing de-reddened colours to (spectral type dependent) intrinsic colours. After de-reddening the observed colours, we used the most modern PMS stars intrinsic colour/bolometric correction/effective temperature scale of Pecaut & Mamajek (2013) to position stars in the H-R diagram and the models of Siess et al. (2000) to estimate stellar mass, age, and internal structure for our sample of close to 1000 stars.
We find a (slightly) sub-linear relationship between stellar luminosity and X-ray luminosity for fully convective PMS stars . The exponent is reduced to 0.610.08 for stars that have developed radiative cores but which are still on their Hayashi tracks in the H-R diagram (where is decreasing with age), with a two-sided Kolmogorov-Smirnov test revealing that they are drawn from a different population than the fully convective stars (see section 4). Considering all partially convective PMS stars including those on Henyey tracks ( increasing with age), which have mostly radiative interiors, the exponent is further reduced to 0.330.09. There is no correlation between and for PMS stars on Henyey tracks in the H-R diagram (see Figures 5 and 6). We note that there are only 148 stars in the radiative core sample compared with 836 fully convective stars, and only 57 Henyey track stars compared to 927 Hayashi track stars. This is as expected since our PMS clusters are young and there will always be a greater proportion of low-mass compared to high-mass stars. In future work, adding data for older PMS clusters, where more stars will have developed radiative cores, and a greater fraction will have completed the Hayashi-to-Henyey track transition, will help to increase the sample size.
The evolution of correlation is clearly driven by the stellar structure transition from fully convective to partially convective with an inner radiative core and outer convective envelop. By comparing the mean value of in bins of increasing we demonstrated that the correlation flattens at large stellar luminosities. This is because, on average, partially convective PMS stars are less X-ray luminous than fully convective ones at the same . PMS stars with radiative cores have lower fractional X-ray luminosities, , on average, than their fully convective counterparts. This effect is greater when comparing Henyey track to Hayashi track stars, with 0.52 dex when considering our entire sample of X-ray detections.
The drop off in X-ray luminosity for partially convective PMS stars is encapsulated in the correlations between and age, . Preibisch & Feigelson (2005) studied the age evolution of PMS star X-ray emission, reporting a weak decrease of approximately when dividing their stars into mass stratified subsamples. We find the same correlation but only for mass bins that are dominated by fully convective PMS stars. As a side note, is slower than we would expect from simple theoretical considerations. There is an approximately linear relationship between and for fully convective PMS stars which contract roughly as (e.g. Lamm et al. 2005; Davies et al. 2014). As such we would expect , as is approximately constant during this phase. This theoretical result represents a faster decrease than is observed.
With our larger sample of stars we have firmly established that decays more rapidly with age for higher mass bins which contain mostly partially convective PMS stars. For example, for 1-1.5 stars, with the exponent dropping to and then to for 1.5-2 and 2-3 stars. Across these three mass bins the fraction of partially convective stars in our sample is 59%, 88% and 100%, further emphasising that decays once convective zones start to vanish within stellar interiors.
This quickening of the decay in with age for higher mass bins is driven by the decay once stars have developed radiative cores. We find that, on average, the longer PMS stars have spent with radiative cores the less X-ray luminous that they become with . The correlation is robust, with the probability of there not being a correlation from a generalised Kendall’s test of 5e-5. The basic result that decays with time since radiative core development is not influenced by any age differences between early and late spectral type stars that are inherent to PMS evolutionary models (e.g. Hillenbrand et al. 2008). There is, however, no direct link between the fraction of the stellar mass contained with the radiative core and the X-ray luminosity, nor between the core radius relative to the stellar radius and (equivalently between convective zone depth and ).
The decay of with time since radiative core development can be linked to the observed increase in the complexity of the magnetic topology of PMS stars as they evolve across the H-R diagram (Gregory et al., 2012, 2014). Zeeman-Doppler imaging studies of accreting PMS stars (e.g. Donati et al. 2008a; Hussain et al. 2009; Donati et al. 2011, 2012) have revealed those which are fully convective, at least those above 0.5, and those with small radiative cores host large-scale magnetic fields that are dominantly axisymmetric, with kilo-Gauss octupole or dipole components slightly tilted with respect to the stellar rotation axis (Gregory & Donati, 2011), with the octupole becoming more dominant relative to the dipole with age (Gregory et al., 2014). In contrast, PMS stars with large radiative cores host complex, multipolar, and dominantly non-axisymmetric large-scale magnetic fields. is approximately the product of a radiative loss function and the volume emission measure, (e.g. Güdel 2009), where is a piecewise function of the coronal temperature (e.g. Aschwanden, Stern & Güdel 2008). If we approximate the emission measure as , where is the number density of the coronal plasma and the emitting volume, then the X-ray luminosity . An increase in the magnetic field complexity as PMS stars evolve from fully convective objects, to hosting substantial radiative cores will result in a decrease of the available coronal emitting volume, and therefore a decrease in . For example, the magnetic field of a PMS star with a strong dipole component would be able to contain coronal plasma out to a large radius from the stellar surface. A PMS star with a magnetic field dominated by high order and non-axisymmetric components, where the field strength would decay faster with height above the star, would have a more compact corona, a smaller emitting volume, and therefore a lower X-ray luminosity. These qualitative ideas will be developed further in a companion paper, where semi-analytic models of the evolution of the coronal X-ray emission from PMS stars with multipolar magnetic fields will be presented.
The change in magnetic field topology as PMS evolve may affect other X-ray signatures as well. For example, compact, multipolar coronae would be more likely to produce rotationally modulated X-ray light curves compared to more extended coronae (e.g. Gregory et al. 2006; Hussain et al. 2009; Johnstone et al. 2014). We also speculate that the flaring properties of Hayashi and Henyey track PMS stars may differ, although a detailed comparison of flares in X-ray light curves as a function of the stellar internal structure has not yet been undertaken.
Finally, we end by noting that the partially convective mid-K to F-type PMS stars in our sample will evolve to mid-G to A-type stars once they arrive on the main sequence. A-type main sequence stars, in particular, lack outer convective envelopes. Only 10-15% of them are detected in X-rays, with this emission thought to come from later spectral type binary companions (Schröder & Schmitt, 2007). Our work in this paper has shown that we can already observe the decay of X-ray emission during the first few Myr of the PMS evolution of stars that will become A-type main sequence stars, as their radiative zones are beginning to grow. Additionally, the disappearance of highly luminous X-ray coronae as PMS stars become largely, and fully, radiative, may be linked to the low (5-10%) detection rate of significant surface magnetic fields in Herbig AeBe stars (Alecian et al., 2013). Newly initiated surveys of PMS stars of mass will help to further complete our understanding of the evolution of stellar magnetism, and of coronal X-ray emission, with the change in stellar internal structure (Hussain & Alecian, 2014).
Acknowledgements
SGG acknowledges support from the Science & Technology Facilities Council (STFC) via an Ernest Rutherford Fellowship [ST/J003255/1], and A. Aarnio, C. Argiroffi, M. Audard, P. Bodenheimer, A. M. Cody, J.-F. Donati, E. D. Feigelson, K. V. Getman, M. Güdel, L. A. Hillenbrand, V. R. Holzwarth, K. Horne, N. Mayne, M. Pecaut & B. Stelzer for useful discussions. CLD acknowledges support from STFC via a PhD studentship and additional funding via the STFC Studentship Enhancement Programme [ST/J500744/1], and support from the ERC Starting Grant "ImagePlanetFormDiscs" (Grant Agreement No. 639889). We thank the referee for their constructive and detailed report. This research has made use of NASA’s Astrophysics Data System. This research has made use of the VizieR catalogue access tool, CDS, Strasbourg, France. This research has made use of the SIMBAD database, operated at CDS, Strasbourg. France. Statistical tests and fits were made using ASURV Rev 1.2 (Lavalley, Isobe & Feigelson, 1992), which implements the methods presented in Feigelson & Nelson (1985) and Isobe et al. (1986).This publication makes use of data products from the Two Micron All Sky Survey, which is a joint project of the University of Massachusetts and the Infrared Processing and Analysis Center/California Institute of Technology, funded by the National Aeronautics and Space Administration and the National Science Foundation. This research has made use of the International Variable Star Index (VSX) database, operated at AAVSO, Cambridge, Massachusetts, USA.
References
- Aarnio et al. (2010) Aarnio A. N., Stassun K. G., Matt S. P., 2010, ApJ, 717, 93
- Alecian et al. (2013) Alecian E., et al., 2013, MNRAS, 429, 1001
- Alexander & Preibisch (2012) Alexander F., Preibisch T., 2012, A&A, 539, A64
- Arias et al. (2006) Arias J. I., Barbá R. H., Maíz Apellániz J., Morrell N. I., Rubio M., 2006, MNRAS, 366, 739
- Arias et al. (2007) Arias J. I., Barbá R. H., Morrell N. I., 2007, MNRAS, 374, 1253
- Aschwanden et al. (2008) Aschwanden M. J., Stern R. A., Güdel M., 2008, ApJ, 672, 659
- Balona & Laney (1996) Balona L. A., Laney C. D., 1996, MNRAS, 281, 1341
- Balona et al. (1994) Balona L. A., Krisciunas K., Cousins A. W. J., 1994, MNRAS, 270, 905
- Baraffe et al. (2015) Baraffe I., Homeier D., Allard F., Chabrier G., 2015, A&A, 577, A42
- Batygin & Adams (2013) Batygin K., Adams F. C., 2013, ApJ, 778, 169
- Baxter et al. (2009) Baxter E. J., Covey K. R., Muench A. A., Fűrész G., Rebull L., Szentgyorgyi A. H., 2009, AJ, 138, 963
- Bessell (1979) Bessell M. S., 1979, PASP, 91, 589
- Bodenheimer (2011) Bodenheimer P. H., 2011, Principles of Star Formation
- Broos et al. (2013) Broos P. S., et al., 2013, ApJS, 209, 32
- Cargile et al. (2008) Cargile P. A., Stassun K. G., Mathieu R. D., 2008, ApJ, 674, 329
- Chabrier & Baraffe (1997) Chabrier G., Baraffe I., 1997, A&A, 327, 1039
- Chambers et al. (1983) Chambers J. M., Cleveland W. S., Kleiner B., Tukey P. A., 1983, Graphical Methods for Data Analysis
- Cody et al. (2014) Cody A. M., et al., 2014, AJ, 147, 82
- Cohen & Kuhi (1979) Cohen M., Kuhi L. V., 1979, ApJS, 41, 743
- Correia et al. (2013) Correia S., et al., 2013, A&A, 557, A63
- Currie et al. (2009) Currie T., Evans N. R., Spitzbart B. D., Irwin J., Wolk S. J., Hernandez J., Kenyon S. J., Pasachoff J. M., 2009, AJ, 137, 3210
- Cutri et al. (2003) Cutri R. M., et al., 2003, VizieR Online Data Catalog, 2246, 0
- Cvetkovic et al. (2009) Cvetkovic Z., Vince I., Ninkovic S., 2009, Publications de l’Observatoire Astronomique de Beograd, 86, 331
- Daemgen et al. (2012) Daemgen S., Correia S., Petr-Gotzens M. G., 2012, A&A, 540, A46
- Dahm (2005) Dahm S. E., 2005, AJ, 130, 1805
- Dahm (2008a) Dahm S. E., 2008a, NGC 2362: The Terminus of Star Formation. p. 26
- Dahm (2008b) Dahm S. E., 2008b, The Young Cluster and Star Forming Region NGC 2264. p. 966
- Dahm (2008c) Dahm S. E., 2008c, AJ, 136, 521
- Dahm & Hillenbrand (2007) Dahm S. E., Hillenbrand L. A., 2007, AJ, 133, 2072
- Dahm & Simon (2005) Dahm S. E., Simon T., 2005, AJ, 129, 829
- Dahm et al. (2007) Dahm S. E., Simon T., Proszkow E. M., Patten B. M., 2007, AJ, 134, 999
- Damiani et al. (2004) Damiani F., Flaccomio E., Micela G., Sciortino S., Harnden Jr. F. R., Murray S. S., 2004, ApJ, 608, 781
- Damiani et al. (2006) Damiani F., Micela G., Sciortino S., Huélamo N., Moitinho A., Harnden Jr. F. R., Murray S. S., 2006, A&A, 460, 133
- Davies et al. (2014) Davies C. L., Gregory S. G., Greaves J. S., 2014, MNRAS, 444, 1157
- Delgado et al. (2006) Delgado A. J., González-Martín O., Alfaro E. J., Yun J., 2006, ApJ, 646, 269
- Donati et al. (2008a) Donati J.-F., et al., 2008a, MNRAS, 386, 1234
- Donati et al. (2008b) Donati J.-F., et al., 2008b, MNRAS, 390, 545
- Donati et al. (2011) Donati J.-F., et al., 2011, MNRAS, 417, 472
- Donati et al. (2012) Donati J.-F., et al., 2012, MNRAS, 425, 2948
- Duchêne et al. (1999) Duchêne G., Bouvier J., Simon T., 1999, A&A, 343, 831
- Duncan (1993) Duncan D. K., 1993, ApJ, 406, 172
- Dunham & Vorobyov (2012) Dunham M. M., Vorobyov E. I., 2012, ApJ, 747, 52
- Dzib et al. (2014) Dzib S. A., Loinard L., Rodríguez L. F., Galli P., 2014, ApJ, 788, 162
- Edwards et al. (1993) Edwards S., et al., 1993, AJ, 106, 372
- Fűrész et al. (2006) Fűrész G., et al., 2006, ApJ, 648, 1090
- Fűrész et al. (2008) Fűrész G., Hartmann L. W., Megeath S. T., Szentgyorgyi A. H., Hamden E. T., 2008, ApJ, 676, 1109
- Favata et al. (2005) Favata F., Flaccomio E., Reale F., Micela G., Sciortino S., Shang H., Stassun K. G., Feigelson E. D., 2005, ApJS, 160, 469
- Feigelson & Nelson (1985) Feigelson E. D., Nelson P. I., 1985, ApJ, 293, 192
- Feigelson et al. (2003) Feigelson E. D., Gaffney III J. A., Garmire G., Hillenbrand L. A., Townsley L., 2003, ApJ, 584, 911
- Feigelson et al. (2005) Feigelson E. D., et al., 2005, ApJS, 160, 379
- Feigelson et al. (2013) Feigelson E. D., et al., 2013, ApJS, 209, 26
- Flaccomio et al. (2003a) Flaccomio E., Micela G., Sciortino S., 2003a, A&A, 397, 611
- Flaccomio et al. (2003b) Flaccomio E., Micela G., Sciortino S., 2003b, A&A, 402, 277
- Flaccomio et al. (2003c) Flaccomio E., Damiani F., Micela G., Sciortino S., Harnden Jr. F. R., Murray S. S., Wolk S. J., 2003c, ApJ, 582, 398
- Flaccomio et al. (2006) Flaccomio E., Micela G., Sciortino S., 2006, A&A, 455, 903
- Forbrich et al. (2011) Forbrich J., Osten R. A., Wolk S. J., 2011, ApJ, 736, 25
- Getman et al. (2005) Getman K. V., et al., 2005, ApJS, 160, 319
- Getman et al. (2008) Getman K. V., Feigelson E. D., Micela G., Jardine M. M., Gregory S. G., Garmire G. P., 2008, ApJ, 688, 437
- Getman et al. (2010) Getman K. V., Feigelson E. D., Broos P. S., Townsley L. K., Garmire G. P., 2010, ApJ, 708, 1760
- Gillen et al. (2014) Gillen E., et al., 2014, A&A, 562, A50
- Greenstein & Struve (1946) Greenstein J. L., Struve O., 1946, PASP, 58, 366
- Gregory & Donati (2011) Gregory S. G., Donati J.-F., 2011, Astronomische Nachrichten, 332, 1027
- Gregory et al. (2006) Gregory S. G., Jardine M., Collier Cameron A., Donati J.-F., 2006, MNRAS, 373, 827
- Gregory et al. (2012) Gregory S. G., Donati J.-F., Morin J., Hussain G. A. J., Mayne N. J., Hillenbrand L. A., Jardine M., 2012, ApJ, 755, 97
- Gregory et al. (2014) Gregory S. G., Donati J.-F., Morin J., Hussain G. A. J., Mayne N. J., Hillenbrand L. A., Jardine M., 2014, in IAU Symposium. pp 40–43 (arXiv:1309.7556), doi:10.1017/S1743921314001677
- Güdel (2009) Güdel M., 2009, in Cargill P., Vlahos L., eds, Lecture Notes in Physics, Berlin Springer Verlag Vol. 778, Turbulence in Space Plasmas. p. 269, doi:10.1007/978-3-642-00210-6_8
- Harris et al. (1954) Harris D. L., Morgan W. W., Roman N. G., 1954, ApJ, 119, 622
- Henderson & Stassun (2012) Henderson C. B., Stassun K. G., 2012, ApJ, 747, 51
- Herbig (1978) Herbig G. H., 1978, Can Post-T Tauri Stars Be Found?. p. 171
- Herbig (1998) Herbig G. H., 1998, ApJ, 497, 736
- Herbig & Bell (1988) Herbig G. H., Bell K. R., 1988, Third Catalog of Emission-Line Stars of the Orion Population : 3 : 1988
- Herbig & Terndrup (1986) Herbig G. H., Terndrup D. M., 1986, ApJ, 307, 609
- Herbst (2008) Herbst W., 2008, Star Formation in IC 348. p. 372
- Herczeg & Hillenbrand (2014) Herczeg G. J., Hillenbrand L. A., 2014, ApJ, 786, 97
- Herczeg & Hillenbrand (2015) Herczeg G. J., Hillenbrand L. A., 2015, ApJ, 808, 23
- Hillenbrand (1997) Hillenbrand L. A., 1997, AJ, 113, 1733
- Hillenbrand et al. (2008) Hillenbrand L. A., Bauermeister A., White R. J., 2008, in van Belle G., ed., Astronomical Society of the Pacific Conference Series Vol. 384, 14th Cambridge Workshop on Cool Stars, Stellar Systems, and the Sun. p. 200 (arXiv:astro-ph/0703642)
- Hillenbrand et al. (2013) Hillenbrand L. A., Hoffer A. S., Herczeg G. J., 2013, AJ, 146, 85
- Hirota et al. (2007) Hirota T., et al., 2007, PASJ, 59, 897
- Hoff et al. (1998) Hoff W., Henning T., Pfau W., 1998, A&A, 336, 242
- Hussain & Alecian (2014) Hussain G. A. J., Alecian E., 2014, in Petit P., Jardine M., Spruit H. C., eds, IAU Symposium Vol. 302, IAU Symposium. pp 25–37 (arXiv:1402.7130), doi:10.1017/S1743921314001653
- Hussain et al. (2009) Hussain G. A. J., et al., 2009, MNRAS, 398, 189
- Iben (2013) Iben Jr. I., 2013, Stellar Evolution Physics, Volume 1: Physical Processes in Stellar Interiors
- Isobe et al. (1986) Isobe T., Feigelson E. D., Nelson P. I., 1986, ApJ, 306, 490
- Jeffries (2007) Jeffries R. D., 2007, MNRAS, 376, 1109
- Johnson (1965) Johnson H. M., 1965, ApJ, 142, 964
- Johnstone et al. (2014) Johnstone C. P., Jardine M., Gregory S. G., Donati J.-F., Hussain G., 2014, MNRAS, 437, 3202
- Jung & Kim (2007) Jung Y. K., Kim Y.-C., 2007, Journal of Astronomy and Space Sciences, 24, 1
- Kamezaki et al. (2014) Kamezaki T., et al., 2014, ApJS, 211, 18
- Karnath et al. (2013) Karnath N., Prato L., Wasserman L. H., Torres G., Skiff B. A., Mathieu R. D., 2013, AJ, 146, 149
- Kaye et al. (1999) Kaye A. B., Handler G., Krisciunas K., Poretti E., Zerbi F. M., 1999, PASP, 111, 840
- Kenyon & Hartmann (1995) Kenyon S. J., Hartmann L., 1995, ApJS, 101, 117
- Kharchenko et al. (2013) Kharchenko N. V., Piskunov A. E., Schilbach E., Röser S., Scholz R.-D., 2013, A&A, 558, A53
- Kim et al. (2008) Kim M. K., et al., 2008, PASJ, 60, 991
- Klagyivik et al. (2013) Klagyivik P., et al., 2013, ApJ, 773, 54
- Klimchuk & Bradshaw (2014) Klimchuk J. A., Bradshaw S. J., 2014, ApJ, 791, 60
- Koch & Perry (1974) Koch R. H., Perry P. M., 1974, AJ, 79, 379
- Kraus et al. (2007) Kraus S., et al., 2007, A&A, 466, 649
- Kumar et al. (2004) Kumar B., Sagar R., Sanwal B. B., Bessell M. S., 2004, MNRAS, 353, 991
- Lamm et al. (2004) Lamm M. H., Bailer-Jones C. A. L., Mundt R., Herbst W., Scholz A., 2004, A&A, 417, 557
- Lamm et al. (2005) Lamm M. H., Mundt R., Bailer-Jones C. A. L., Herbst W., 2005, A&A, 430, 1005
- Laughlin et al. (1997) Laughlin G., Bodenheimer P., Adams F. C., 1997, ApJ, 482, 420
- Lavalley et al. (1992) Lavalley M. P., Isobe T., Feigelson E. D., 1992, in Bulletin of the American Astronomical Society. pp 839–840
- Lucas et al. (2001) Lucas P. W., Roche P. F., Allard F., Hauschildt P. H., 2001, MNRAS, 326, 695
- Luhman (1999) Luhman K. L., 1999, ApJ, 525, 466
- Luhman et al. (1998) Luhman K. L., Rieke G. H., Lada C. J., Lada E. A., 1998, ApJ, 508, 347
- Luhman et al. (2000) Luhman K. L., Rieke G. H., Young E. T., Cotera A. S., Chen H., Rieke M. J., Schneider G., Thompson R. I., 2000, ApJ, 540, 1016
- Luhman et al. (2003) Luhman K. L., Stauffer J. R., Muench A. A., Rieke G. H., Lada E. A., Bouvier J., Lada C. J., 2003, ApJ, 593, 1093
- Luhman et al. (2005) Luhman K. L., Lada E. A., Muench A. A., Elston R. J., 2005, ApJ, 618, 810
- Maeder (2009) Maeder A., 2009, Physics, Formation and Evolution of Rotating Stars, doi:10.1007/978-3-540-76949-1.
- Mamajek (2012) Mamajek E. E., 2012, ApJ, 754, L20
- Mariñas et al. (2013) Mariñas N., Lada E. A., Teixeira P. S., Lada C. J., 2013, ApJ, 772, 81
- Marschall & Mathieu (1988) Marschall L. A., Mathieu R. D., 1988, AJ, 96, 1956
- Mathieu (1994) Mathieu R. D., 1994, ARA&A, 32, 465
- Mayne (2010) Mayne N. J., 2010, MNRAS, 408, 1409
- Mayne & Naylor (2008) Mayne N. J., Naylor T., 2008, MNRAS, 386, 261
- McGill et al. (1978) McGill R., Tukey J. W., Larsen W. A., 1978, The American Statistician, 32, 12
- Menten et al. (2007) Menten K. M., Reid M. J., Forbrich J., Brunthaler A., 2007, A&A, 474, 515
- Moitinho et al. (2001) Moitinho A., Alves J., Huélamo N., Lada C. J., 2001, ApJ, 563, L73
- Montmerle et al. (2000) Montmerle T., Grosso N., Tsuboi Y., Koyama K., 2000, ApJ, 532, 1097
- Morales-Calderón et al. (2012) Morales-Calderón M., et al., 2012, ApJ, 753, 149
- Morin et al. (2008) Morin J., et al., 2008, MNRAS, 390, 567
- Muench et al. (2007) Muench A. A., Lada C. J., Luhman K. L., Muzerolle J., Young E., 2007, AJ, 134, 411
- Muench et al. (2008) Muench A., Getman K., Hillenbrand L., Preibisch T., 2008, Star Formation in the Orion Nebula I: Stellar Content. p. 483
- Narain & Ulmschneider (1996) Narain U., Ulmschneider P., 1996, Space Sci. Rev., 75, 453
- Naylor (2009) Naylor T., 2009, MNRAS, 399, 432
- Nordhagen et al. (2006) Nordhagen S., Herbst W., Rhode K. L., Williams E. C., 2006, AJ, 132, 1555
- O’Dell et al. (2008) O’Dell C. R., Muench A., Smith N., Zapata L., 2008, Star Formation in the Orion Nebula II: Gas, Dust, Proplyds and Outflows. p. 544
- Offner & McKee (2011) Offner S. S. R., McKee C. F., 2011, ApJ, 736, 53
- Padgett & Stapelfeldt (1994) Padgett D. L., Stapelfeldt K. R., 1994, AJ, 107, 720
- Palla & Stahler (1993) Palla F., Stahler S. W., 1993, ApJ, 418, 414
- Parenago (1954) Parenago P. P., 1954, Trudy Gosudarstvennogo Astronomicheskogo Instituta, 25, 1
- Park et al. (2000) Park B.-G., Sung H., Bessell M. S., Kang Y. H., 2000, AJ, 120, 894
- Parker (1988) Parker E. N., 1988, ApJ, 330, 474
- Pecaut & Mamajek (2013) Pecaut M. J., Mamajek E. E., 2013, ApJS, 208, 9
- Penston (1973) Penston M. V., 1973, ApJ, 183, 505
- Penston et al. (1975) Penston M. V., Hunter J. K., Oneill A., 1975, MNRAS, 171, 219
- Prato et al. (2002) Prato L., Simon M., Mazeh T., McLean I. S., Norman D., Zucker S., 2002, ApJ, 569, 863
- Preibisch & Feigelson (2005) Preibisch T., Feigelson E. D., 2005, ApJS, 160, 390
- Preibisch & Zinnecker (2001) Preibisch T., Zinnecker H., 2001, AJ, 122, 866
- Preibisch & Zinnecker (2002) Preibisch T., Zinnecker H., 2002, AJ, 123, 1613
- Preibisch et al. (2005) Preibisch T., et al., 2005, ApJS, 160, 401
- Prisinzano et al. (2005) Prisinzano L., Damiani F., Micela G., Sciortino S., 2005, A&A, 430, 941
- Prisinzano et al. (2007) Prisinzano L., Damiani F., Micela G., Pillitteri I., 2007, A&A, 462, 123
- Prisinzano et al. (2012) Prisinzano L., Micela G., Sciortino S., Affer L., Damiani F., 2012, A&A, 546, A9
- Prosser et al. (1994) Prosser C. F., Stauffer J. R., Hartmann L., Soderblom D. R., Jones B. F., Werner M. W., McCaughrean M. J., 1994, ApJ, 421, 517
- Ramírez et al. (2004) Ramírez S. V., et al., 2004, AJ, 127, 2659
- Rauw et al. (2002) Rauw G., Nazé Y., Gosset E., Stevens I. R., Blomme R., Corcoran M. F., Pittard J. M., Runacres M. C., 2002, A&A, 395, 499
- Rebull et al. (2002) Rebull L. M., et al., 2002, AJ, 123, 1528
- Rebull et al. (2006) Rebull L. M., Stauffer J. R., Ramirez S. V., Flaccomio E., Sciortino S., Micela G., Strom S. E., Wolff S. C., 2006, AJ, 131, 2934
- Rhode et al. (2001) Rhode K. L., Herbst W., Mathieu R. D., 2001, AJ, 122, 3258
- Rieke & Lebofsky (1985) Rieke G. H., Lebofsky M. J., 1985, ApJ, 288, 618
- Samus et al. (2009) Samus N. N., Durlevich O. V., et al. 2009, VizieR Online Data Catalog, 1, 2025
- Sandstrom et al. (2007) Sandstrom K. M., Peek J. E. G., Bower G. C., Bolatto A. D., Plambeck R. L., 2007, ApJ, 667, 1161
- Schröder & Schmitt (2007) Schröder C., Schmitt J. H. M. M., 2007, A&A, 475, 677
- Siess et al. (2000) Siess L., Dufour E., Forestini M., 2000, A&A, 358, 593
- Skrutskie et al. (2006) Skrutskie M. F., et al., 2006, AJ, 131, 1163
- Slesnick et al. (2004) Slesnick C. L., Hillenbrand L. A., Carpenter J. M., 2004, ApJ, 610, 1045
- Stahler (1983) Stahler S. W., 1983, ApJ, 274, 822
- Stassun et al. (2006) Stassun K. G., van den Berg M., Feigelson E., Flaccomio E., 2006, ApJ, 649, 914
- Stelzer & Neuhäuser (2001) Stelzer B., Neuhäuser R., 2001, A&A, 377, 538
- Stelzer et al. (2012) Stelzer B., Preibisch T., Alexander F., Mucciarelli P., Flaccomio E., Micela G., Sciortino S., 2012, A&A, 537, A135
- Strom et al. (1974) Strom S. E., Strom K. A., Carrasco L., 1974, PASP, 86, 798
- Sung & Bessell (2010) Sung H., Bessell M. S., 2010, AJ, 140, 2070
- Sung et al. (1997) Sung H., Bessell M. S., Lee S.-W., 1997, AJ, 114, 2644
- Sung et al. (2000) Sung H., Chun M.-Y., Bessell M. S., 2000, AJ, 120, 333
- Sung et al. (2004) Sung H., Bessell M. S., Chun M.-Y., 2004, AJ, 128, 1684
- Telleschi et al. (2007) Telleschi A., Güdel M., Briggs K. R., Audard M., Palla F., 2007, A&A, 468, 425
- Tobin et al. (2009) Tobin J. J., Hartmann L., Furesz G., Mateo M., Megeath S. T., 2009, ApJ, 697, 1103
- Tobin et al. (2013) Tobin J. J., Hartmann L., Furesz G., Mateo M., Megeath S. T., 2013, ApJ, 773, 81
- Tognelli et al. (2011) Tognelli E., Prada Moroni P. G., Degl’Innocenti S., 2011, A&A, 533, A109
- Torres (2010) Torres G., 2010, AJ, 140, 1158
- Torres et al. (2006) Torres C. A. O., Quast G. R., da Silva L., de La Reza R., Melo C. H. F., Sterzik M., 2006, A&A, 460, 695
- Tothill et al. (2008) Tothill N. F. H., Gagné M., Stecklum B., Kenworthy M. A., 2008, The Lagoon Nebula and its Vicinity. p. 533
- Turner (2012) Turner D. G., 2012, Astronomische Nachrichten, 333, 174
- Vacca & Sandell (2011) Vacca W. D., Sandell G., 2011, ApJ, 732, 8
- Vuong et al. (2003) Vuong M. H., Montmerle T., Grosso N., Feigelson E. D., Verstraete L., Ozawa H., 2003, A&A, 408, 581
- Walker (1956) Walker M. F., 1956, ApJS, 2, 365
- Walker (1957) Walker M. F., 1957, ApJ, 125, 636
- Walker (1961) Walker M. F., 1961, ApJ, 133, 1081
- Walker (1983) Walker M. F., 1983, ApJ, 271, 642
- Weights et al. (2009) Weights D. J., Lucas P. W., Roche P. F., Pinfield D. J., Riddick F., 2009, MNRAS, 392, 817
- Windemuth & Herbst (2014) Windemuth D., Herbst W., 2014, AJ, 147, 9
- Wolff et al. (2004) Wolff S. C., Strom S. E., Hillenbrand L. A., 2004, ApJ, 601, 979
- Wolk et al. (2005) Wolk S. J., Harnden Jr. F. R., Flaccomio E., Micela G., Favata F., Shang H., Feigelson E. D., 2005, ApJS, 160, 423
- Wright et al. (2011) Wright N. J., Drake J. J., Mamajek E. E., Henry G. W., 2011, ApJ, 743, 48
- van den Ancker et al. (1997) van den Ancker M. E., The P. S., Feinstein A., Vazquez R. A., de Winter D., Perez M. R., 1997, A&AS, 123, 63
Appendix A Distance estimates
Extensive discussion of literature estimates of the distance to the five star forming regions that we consider can be found in the papers of the Handbook of Star Forming Regions, ONC (Muench et al., 2008), NGC 2264 (Dahm, 2008b), IC 348 (Herbst, 2008), NGC 2362 (Dahm, 2008a), and NGC 6530 (Tothill et al., 2008). We therefore limit any detailed discussion below to distance estimates published subsequently. Our adopted distances are listed in Table 1.
A.1 Orion Nebula Cluster (ONC)
Historically, the distance to the ONC was subject to large uncertainty, but modern estimates have converged on (e.g. Jeffries 2007; Kraus et al. 2007; Hirota et al. 2007; Sandstrom et al. 2007; Menten et al. 2007; Mayne & Naylor 2008; Kim et al. 2008). We assume , the value obtained from trigonometric parallax measurements made using the Very Long Baseline Array (Menten et al., 2007). This corresponds to a distance modulus of .
A.2 NGC 2264
The distance to NGC 2264 remains somewhat uncertain, with modern estimates ranging from 400 (Dzib et al., 2014) to (systematic and sampling errors respectively; Baxter et al. 2009). The former was derived from a re-analysis of Hipparcos satellite parallax measurements; future, higher precession parallax observations to-be-made by the Gaia satellite will test the robustness of such a small cluster distance, 400 being a factor of two below almost all other estimates (see below). The latter was estimated by calculating for cluster members, where is the stellar inclination, using knowledge of the stellar rotation period, measured projected rotational velocities (), and the stellar radius for an assumed cluster distance ( depends on the stellar luminosity and therefore the cluster distance), . By then modelling the distribution obtained assuming that the stellar inclinations are randomly oriented, Baxter et al. (2009) varied the cluster distance until the best match with the observed distribution was obtained.
Most distance estimates fall in the range 700-780 (, Sung et al. 1997 with Park et al. 2000 finding the same value but with a smaller error; , Mayne & Naylor 2008; , Naylor 2009; , Cvetkovic, Vince & Ninkovic 2009; , Sung & Bessell 2010; , Turner 2012; , Gillen et al. 2014; and , Kamezaki et al. 2014). As the value derived by Gillen et al. (2014) was obtained from an analysis of CoRoT satellite photometry of an eclipsing binary system, and is therefore arguably the most accurate, we use their value of in this paper ().
A.3 IC 348
A.4 NGC 2362
Historically, there was more than a kilo-parsec variation in derived distances to NGC 2362 (see Dahm 2005, 2008a), but modern estimates have settled on 1.4-1.5 (Balona & Laney, 1996; Moitinho et al., 2001; Mayne & Naylor, 2008; Kharchenko et al., 2013). Many of the early type stars lie on the ZAMS, allowing the cluster distance to be derived by fitting the ZAMS in colour-magnitude diagrams. We adopt a distance of , the value derived by Moitinho et al. (2001) by fitting the B-star sequence in the vs plane ().
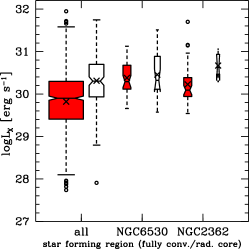
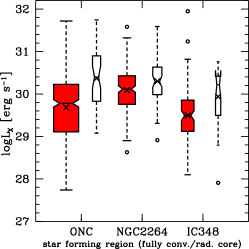
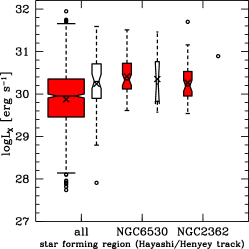

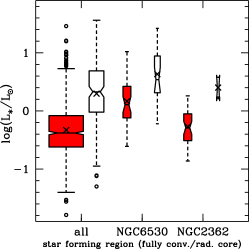
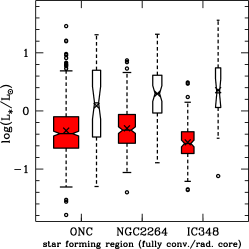
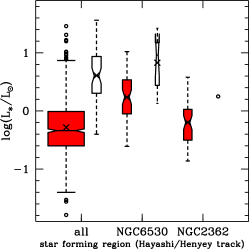
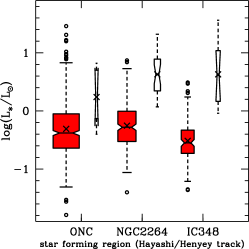
A.5 NGC 6530
Extensive discussion of the distance to NGC 6530 can be found in both Tothill et al. (2008) and Prisinzano et al. (2005). Literature estimates range from 1.3-2, with most studies deriving either 1.3 (e.g. Prisinzano et al. 2005; Arias et al. 2006; Mayne & Naylor 2008; Kharchenko et al. 2013) or 1.8 (e.g. van den Ancker et al. 1997; Sung et al. 2000). As the more recent estimates agree on the former, we adopt , the value derived by Prisinzano et al. (2005), corresponding to a distance modulus of .
Appendix B A comparison of and for fully and partially convective PMS stars
Box plots of and for the entire sample and all regions combined, are shown in Figs. 10 & 11 respectively. For brevity we present only the box plots and not full breakdowns analogous to Tables 2 & 3. Partially convective stars are, on average, more luminous than fully convective stars; likewise for Henyey compared to Hayashi track stars. There is a single exception - Hayashi track stars in NGC 6530 are more X-ray luminous on average than Henyey track stars (see Fig. 10 lower left panel). This is a result of an observational bias: the incompleteness of spectroscopic surveys of that region. In this work we have selected only PMS stars where spectral type have been assigned from spectra (and not stars with an estimated spectral type from a comparison of dereddened photometry with spectral type-dependent intrinsic colours). There are very few late-type stars with assigned spectral types in NGC 6530 (see Tothill et al. 2008). In our sample, there are only 14 M-type stars and, of these, one is classified as M1 and the rest are earlier M-types. The lack of low-mass stars in the region with spectral type assignments is evident from the H-R diagram for NGC 6530, Fig. 3, where there are no stars with . These low-mass stars, which would all be on Hayashi tracks, are weaker X-ray emitters than higher mass PMS stars, see Fig. 12. Thus, had they been spectral typed and therefore included in our sample, we would expect to have found that for NGC 6530, as with the other four star forming regions that we consider.
Appendix C Additional correlations
For PMS stars, correlations between X-ray luminosity and stellar mass, and between X-ray luminosity and stellar age, are well known (e.g. Preibisch & Feigelson 2005; Preibisch et al. 2005). In light of (i) the substantial updates to spectral type catalogs; (ii) the improved mass and age estimates derived from PMS star calibrated effective temperature and intrinsic colours that we present in this work; (iii) the large sample size of PMS stars from five star forming regions that we consider; and (iv) our division of the sample into fully/partially convective stars and Hayashi/Henyey track stars, in this Appendix we briefly re-examine the known correlations between and stellar mass/age.
| std. dev. | prob. | ||||
| all stars | 984 (34) | 30.340.03 | 1.450.06 | 0.60 | 5e-5 |
| fully convective | 836 (33) | 30.550.04 | 1.840.08 | 0.59 | 5e-5 |
| radiative core | 148 (1) | 30.110.06 | 1.320.28 | 0.59 | 5e-5 |
| Hayashi track | 927 (33) | 30.440.03 | 1.640.07 | 0.58 | 5e-5 |
| Henyey track | 57 (1) | 29.720.24 | 2.120.98 | 0.71 | 0.041 |
| Hayashi track with radiative core | 91 (0) | 30.200.05 | 1.690.26 | 0.45 | 5e-5 |
| all stars () | 963 (34) | 30.350.03 | 1.470.06 | 0.60 | 5e-5 |
| ONC () | 455 (0) | 30.380.05 | 1.610.10 | 0.62 | 5e-5 |
C.1 versus
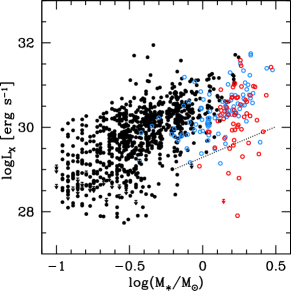
The correlation between and is plotted in Fig. 12, with linear regression fits from the expectation maximisation algorithm of ASURV presented in Table 5. Probabilities for there not being a correlation from generalized Kendall’s tests are also listed, which take account of the upper limits. Considering the entire sample we find , although as with the correlation (section 4) this hides the differing behaviour with the change in stellar internal structure. Fully convective stars show a steeper increase in with with an exponent of 1.840.08. Partially convective stars show a weaker increase with an exponent of 1.320.28, albeit with a large error. The correlation is marginal at best for Henyey track stars. It is clear visually from Fig. 12 that PMS stars with radiative cores are less luminous in X-rays than fully convective stars in the same mass range, with having decayed substantially for several Henyey track stars.
For a more direct comparison to the literature, we also list in Table 5 the correlation found for , and for ONC stars in the same mass range. The latter offers the most direct comparison with the COUP, the most comprehensive X-ray survey of a young star forming region. Preibisch et al. (2005) find that with stellar masses estimated from the Siess et al. (2000) models. With the same models we find a larger exponent of 1.610.10, although this is consistent with the Preibisch et al. (2005) result within the error.
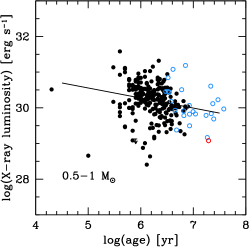
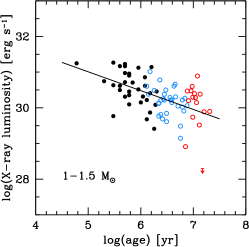
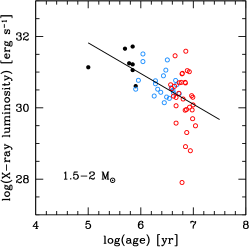
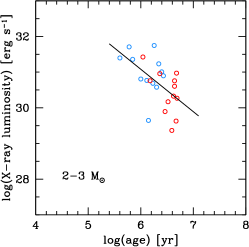
C.2 versus
Preibisch & Feigelson (2005) report a decay in X-ray luminosity with age in mass stratified samples of PMS stars in the ONC. Dividing the sample into mass bins negates any relationship potentially introduced by the PMS lifetime being a strong function of stellar mass. Linear regression fits to vs for our sample are given in Table 6. The first four mass bins (0.1-0.2, 0.2-0.4, 0.4-1.0, and 1.0-2.0) are chosen to allow a direct comparison between our results and those of Preibisch & Feigelson (2005). As our sample extends to 3, results are also given for 2.0-3.0. The anti-correlations are similar to those reported by Preibisch & Feigelson (2005), namely a decay of X-ray luminosity with age roughly of the form , although here, with our larger sample of stars the probability of (anti-)correlations being present from a generalised Kendall’s test are greater. It is also notable that in the 1.0-2.0 mass bin the decay is steeper: here , P(0)5e-5, compared to , P(0)0.053 in Preibisch & Feigelson (2005) with a smaller sample. The decay is steeper still if the mass range is extended up to 3, .
As our sample includes almost 1000 PMS stars, we have further divided stars into mass bins of 0.5-1.0, 1.0-1.5, 1.5-2.0, and 2.0-3.0.1111112.5-3.0 is not considered as there are only 5 stars in this mass range. Plots of vs shown in Fig. 13. As is apparent from Table 6, the exponent steadily decreases from about -1/3, to -1/2, to -9/10, to -6/5 across these four mass bins. There is a faster decay in X-ray luminosity with age for stars of higher mass. The last two columns of Table 6 are the fraction of partially convective stars , and the fraction of Henyey track stars , in each mass bin e.g. (=1) would indicate that all stars in that mass bin are on Hayashi (Henyey) tracks. This faster decay in with age is driven by the greater proportion of partially convective stars in the higher mass bins; and is related to the decay in as stars develop substantial radiative cores (section 4) and our finding that the longer a star has spent with a radiative core the weaker its X-ray emission becomes (section 5).
| a | prob. | ||||
|---|---|---|---|---|---|
| 0.1-0.2 | -0.300.09 | 9e-4 | 142 (20) | 0.00 | 0.00 |
| 0.2-0.4 | -0.290.08 | 1e-4 | 330 (12) | 0.01 | 0.00 |
| 0.4-1.0 | -0.290.07 | 5e-5 | 376 (1) | 0.07 | 0.00 |
| 1.0-2.0 | -0.550.09 | 5e-5 | 139 (1) | 0.71 | 0.32 |
| 1.0-3.0 | -0.610.09 | 5e-5 | 160 (1) | 0.75 | 0.35 |
| 0.5-1.0 | -0.280.08 | 5e-5 | 257 (1) | 0.10 | 0.00 |
| 1.0-1.5 | -0.530.10 | 5e-5 | 81 (1) | 0.59 | 0.19 |
| 1.5-2.0 | -0.860.19 | 5e-5 | 60 (0) | 0.88 | 0.53 |
| 2.0-3.0 | -1.190.35 | 0.0059 | 24 (0) | 1.00 | 0.50 |
Appendix D A comparison of the correlations using different stellar evolution models
In this Appendix we demonstrate that our results are independent of the adopted PMS mass tracks and isochrones. Starting with our final sample of 984 PMS stars (including the 34 upper limits), see section 3, we recalculated the stellar masses, ages, and radiative core masses, using the PMS evolutionary models of Jung & Kim (2007). Co-author Y.-C. Kim kindly supplied us with more detailed grids than published as well as stellar internal structure information. All 984 stars fell within the grid of Jung & Kim (2007). We repeated the process using the models of Tognelli et al. (2011), for which E. Tognelli generously sent us radiative core masses. However, 0.2 is the lowest available mass track of the Tognelli et al. (2011) models and 1 the youngest isochrone (the mass tracks themselves do extend to younger ages), so only 759 stars, including 13 upper limits, could be used. The other 225 stars were either of too low mass, too young, or both, to be considered.
The different models yield different mass and age estimates for individual stars [see Tognelli et al. (2011) for a detailed comparison of several PMS evolutionary models]. Some PMS stars have fully convective interiors in one model and a partially convective interior in another. Likewise, some are on a Hayashi track in one model and on a Henyey track in another. These are stars which lie close to the fully convective limit in the H-R diagram (represented by the solid blue line in Figure 3), or close to the point of transition from the Hayashi to the Henyey track. Despite the inherent differences between the models, a detailed examination of Table 7 reveals that our results remain the same regardless of the model choice. Fully convective stars have lower, mean, fractional X-ray luminosities than partially convective PMS stars, with the difference being larger when comparing Hayashi to Henyey track stars and when the ONC is excluded (see section 4). There is an almost linear correlation between and for fully convective and Hayashi track stars, with the exponent of the correlation reducing if we consider partially convective stars. There is no correlation between and for Henyey track stars (see section 4). This is likely driven by the decay of with time since radiative core development (see section 5).
The correlation between and age, , does initially appear to be model dependent. For example, in the highest mass bin, 2-3, there is no correlation when using the Jung & Kim (2007) or Tognelli et al. (2011) models. There are only 15 and 16 stars in this mass range in the two models, respectively, compared to 24 stars when using the Siess et al. (2000) models. We suspect that strong correlations would be recovered for all models if a greater sample size could be used. The different models yield different mass estimates for individual stars. If we consider alternative mass bins to those listed in Table 7 strong correlations are still recovered. As one example, for mass bins of 0.5-0.7, 0.7-1.0, 1.0-1.5, and 1.5-3.0 the exponents of the versus correlation using the models of Tognelli et al. (2011) are -0.470.10, -0.630.09, -0.770.16, and -1.000.22 respectively, with <5e-5 for the lowest three mass bins and 1e-4 for the highest mass bin. Our conclusion that the decrease in with age steepens for higher mass bins (see Appendix C.2), which contain a greater proportion of partially convective stars compared to lower mass bins, remains valid regardless of the chosen PMS evolutionary model.
| Siess et al. (2000) | Jung & Kim (2007) | Tognelli et al. (2011) | ||
| Nstars | total | 984 (34) | 984 (34) | 759 (13) |
| fully convective | 836 (33) | 884 (33) | 620 (12) | |
| radiative core | 148 (1) | 100 (1) | 139 (1) | |
| Hayashi track | 927 (33) | 949 (33) | 720 (12) | |
| Henyey track | 57 (1) | 35 (1) | 39 (1) | |
| Hayashi track with radiative core | 91 (0) | 65 (0) | 100 (0) | |
| fully convective all regions | -3.44 | -3.43 | -3.35 | |
| radiative core all regions | -3.57 | -3.72 | -3.56 | |
| Hayashi track all regions | -3.43 | -3.44 | -3.35 | |
| Henyey track all regions | -3.95 | -4.10 | -4.14 | |
| fully convective ONC excluded | -3.30 | -3.31 | -3.27 | |
| radiative core ONC excluded | -3.68 | -3.79 | -3.71 | |
| Hayashi track ONC excluded | -3.32 | -3.33 | -3.30 | |
| Henyey track ONC excluded | -3.96 | -4.12 | -4.16 | |
| a, P(0) | a, P(0) | a, P(0) | ||
| all stars | 0.810.04, 5e-5 | 0.840.04, 5e-5 | 0.670.04, 5e-5 | |
| fully convective | 0.930.04, 5e-5 | 0.970.04, 5e-5 | 0.890.05, 5e-5 | |
| radiative core | 0.330.09, 5e-5 | 0.280.13, 0.0022 | 0.340.08, 5e-5 | |
| Hayashi track | 0.920.04, 5e-5 | 0.940.04, 5e-5 | 0.830.04, 5e-5 | |
| Henyey track | 0.130.23, 0.518 | -0.110.27, 0.5894 | 0.110.27, 0.8750 | |
| Hayashi track with radiative core | 0.610.08, 5e-5 | 0.670.15, 5e-5 | 0.600.08, 5e-5 | |
| radiative core | -0.420.09, 5e-5 | -0.450.11, 1e-4 | -0.400.09, 5e-5 | |
| Hayashi track with radiative core | -0.390.10, 1e-4 | -0.450.13, 0.0012 | -0.390.08, 5e-5 | |
| Henyey track | -1.100.36, 0.009 | -1.340.53, 0.0045 | -1.020.55, 0.0136 | |
| 0.5-1.0 | -0.280.08, 5e-5 | -0.400.06, 5e-5 | -0.510.07, 5e-5 | |
| 1.0-1.5 | -0.530.10, 5e-5 | -0.760.11, 5e-5 | -0.770.16, 5e-5 | |
| 1.5-2.0 | -0.860.19, 5e-5 | -0.780.25, 7e-4 | -1.090.26, 1e-4 | |
| 2.0-3.0 | -1.190.35, 0.0059 | -0.910.31, 0.0833 | -0.770.45, 0.4177 |