Emergence of core-peripheries in networks
A number of important transport networks, such as the airline and trade networks of the world, exhibit a characteristic core-periphery structure, wherein a few nodes are highly interconnected and the rest of the network frays into a tree. Mechanisms underlying the emergence of core-peripheries, however, remain elusive. Here, we demonstrate that a simple pruning process based on removal of underutilized links and redistribution of loads can lead to the emergence of core-peripheries. Links are assumed beneficial if they either carry a sufficiently large load or are essential for global connectivity. This incentivized redistribution process is controlled by a single parameter which balances connectivity and profit. The obtained networks exhibit a highly resilient and connected core with a frayed periphery. The balanced network shows a higher resilience than the World Airline Network or the World Trade Network, revealing a pathway towards robust structural features through pruning.
Introduction
In today’s world we want to fly everywhere. Despite higher fuel prices and a wider consciousness for reducing carbon emissions, airplane travel is on the rise globally and is predicted to grow even further in the future IATA . Events like the shutdown of the entire European airspace, due to the eruption of the Icelandic volcano, Eyjafjallajökull, have demonstrated the importance of efficiency and reliability of the airline traffic Budd and other transport networks, be it trade, Internet or trains.
An ideal point-to-point network topology would ensure the fastest transfer of loads in a transport network. However, the real world imposes costs on transport networks and their actual structure is a result of a complex interplay of (among other factors) economic considerations of involved parties as well as political ties between different regions. For instance, most major airlines, nowadays, employ a hub-and-spoke philosophy in which passengers are routed through a few central airports, depending on the size of the airline’s fleet. In recent years, however, especially low-cost airlines (for example, Ryanair in Europe) have rediscovered the point-to-point philosophy, providing non-stop flights wherever sufficient demand exists Zanin . This results in a denser and more clustered network as opposed to a hub-and-spoke one.
One of the remarkable features of the World Airline Network (WAN) is its small core (consisting of about of the airports) that is almost fully connected and surrounded by a vast periphery that is nearly tree-like and connected to the core through many regional and national hubs Verma . This block arrangement is prominently known as the core-periphery structure Borgatti ; Holme ; Silva ; Csermely which was also reported for other infrastructure networks, such as the World Trade Network Fagiolo ; Rossa , the autonomous Internet network Rossa and the financial interbank lending markets Elliott , where the fraction of peripheral nodes varies from to . Rombach et al. Rombach have also found similar structures for friendship, voting and collaboration networks and Avin et al. for other social networks Avin .
The reason behind core-peripheries is still unclear. Some transport network Black ; Gastner models have been based on a greedy optimization of a particular evaluation function of distance, cost or time. None of the above studies, however, could reproduce the core-periphery structure.
We hypothesize that the core-peripheries are a result of a naturally existing state of the dynamics of networks that are driven by a balance between functional connectivity and load-based profit. As an illustration of this hypothesis, commercial airlines will very likely cancel a direct link if the number of passengers does not compensate for the associated costs. Here, we start with a Utopian network where each node is connected to every other node. Underutilized links are pruned and the load of such links is redistributed to guarantee the load transfer between nodes. Through this pruning model, we demonstrate that core-periphery structures can be obtained.
Results
Model
Generally, in transport networks, load is anything that needs to be transported from one place to another. We start with an ideal fully-connected and undirected network where load pertaining to a pair of nodes can be transferred bidirectionally (a full description of the algorithm is given in Supplementary Methods Dijkstra ).
We represent the network using an adjacency matrix with nodes and links representing whether or not there exists a direct link between any pair of nodes. Our reference network contains nodes. Since we are interested in transport networks, we consider that a link is characterized by its load , cost , and physical length (Euclidean distance between nodes, in km, taken randomly from a Gaussian distribution, . The nodes are spread around a sphere of the size of the Earth - see Supplementary Figure 1 and Supplementary Note 1).
We define the profit of a link connecting nodes and as
| (1) |
where is the benefit arising from a link and is the cost of establishing and maintaining the said link. Since the load of a link is a proxy for the benefit it accrues, we set . For simplicity, we assign the same cost to every link with a dispersion to accommodate for heterogeneity in the network; and , where is a uniformly distributed random number in the range . In particular, we consider the cases . We obtain good quantitative agreement for the three cases, showing that our results are robust to heterogeneity in the parameter (see Supplementary Figure 2 and Supplementary Note 2). Varying from the minimum load, we systematically prune links of negative profit, starting with the least loaded ones. An underutilized link that is necessary for maintaining global connectivity is not removed and classified as essential.
Once a link is pruned, its load is redistributed through the next best (shortest-path) alternative, which potentially turns these alternative links more beneficial than they were before. In the case where several paths are of the same length, one is chosen at random. The load redistribution process can be explained in two steps. Firstly, when a link is removed, the load is routed through the next shortest path available between the nodes. Secondly, every link on the next available path will have to absorb the incoming load as it moves from source to sink. The reason for choosing the shortest path as the next available path is because normally in a transport network, the length of travel times and in most passenger driven networks, convenience is of primary importance to both the consumers and service providers. However, a robustness analysis of two other alternatives (random path, second shortest-path) shows that core-periphery features are observed in the critical window and the robustness of the networks in different regimes remains the same (see Supplementary Figure 3). The pruning process eventually gives rise to a network only comprising essential links.
To distribute the loads, we introduce an observable called the popularity, , for each node , characterizing its importance for the network. The popularity of a node is initially randomly chosen from a uniform distribution in the range , and alternatively from a scale-free distribution, , to contrast and compare the effect of initial conditions on our model (see Supplementary Figure 4 and Supplementary Note 3). Subsequently, the initial load on any link is defined as the product of popularities of the nodes involved (see Supplementary Figure 5 and Supplementary Note 4 for an in depth understanding of this relationship),
| (2) |
The popularity of each link remains intact with the pruning process. However, the load of each link dynamically changes as the load of removed links is redistributed. We have examined several other load functions (such as , , and ) and found no significant dependence of the main findings on the load function. In addition, we have also used a specific and more conventional case of load, betweenness centrality (see Supplementary Figure 6 and Supplementary Note 5). As will be evident in the Results section, the existence of core-peripheries remains the same. However, the load and its redistribution are needed (and critical) to find the core-periphery structure.
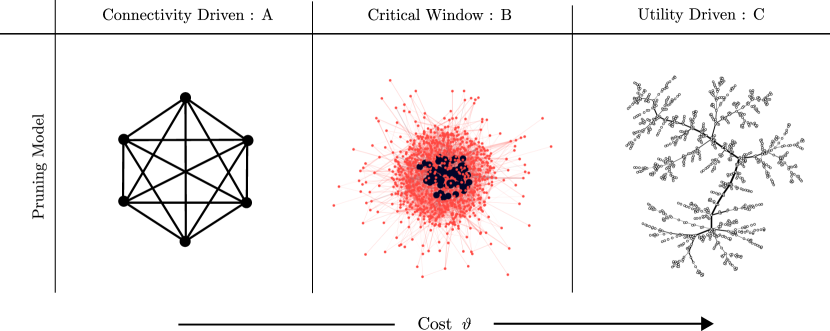
We run the above algorithm and analyze the structure using standard network techniques. The pruning process coupled with the load redistribution mechanism gives rise to three distinct families of network structures (see fig. 1), one of which strongly resembles the features of a core-periphery structure.
To identify and analyze the core-periphery structure we use the t-core decomposition, as proposed in Ref. Verma . Similar to the k-core decomposition Dorogovtsev1 , this method progressively prunes a network by recursively removing nodes that are part of the least number of triangles. The decomposition assigns the removed nodes a “coreness”, , and places them in different shells, , where a shell, , has nodes that are part of at least triangles. Since triangles enhance the resilience of load transfer and this method recovers subgraphs at every shell that are more and more densely connected, the method uncovers a hierarchical ordering. More specifically, the load passing between a pair of nodes in a transport network can be redistributed with only one change in case the direct link becomes unavailable. A node that is part of the fully-connected core of a network will be able to transfer its load through many alternatives (as many as there are nodes in the core) to accommodate for a faulty link. Thus, the -core measure is especially suitable to assess which nodes belong to the core or the periphery.
To compare networks of different sizes, we define the relative coreness
| (3) |
where is the maximum possible coreness of a node in a network of nodes.
To perform a more aggregate level analysis where core-periphery structure across different networks can be studied, we focus on the core-periphery (CP) measure, a dimensionless quantity defined as
| (4) |
where and stand for the maximum and minimum relative coreness found in the network, respectively, and and for the number of nodes that were assigned the respective coreness. A network with a genuine core-periphery structure will have both, many nodes with low coreness (periphery) and a few nodes with high coreness (core). For example, the empirical WAN has a ratio, , that is much larger than unity, suggesting the presence of very few nodes in the core, compared to the periphery. Thus, a high ratio indicates a particularly pronounced core-periphery, and a low value, the lack of a core-periphery. The rationale behind definition (4) is based on qualitative experience with the empirical WAN, which distinctly maximizes as there are very few nodes in the core and the majority of nodes fall in the periphery. Moreover, the difference in the relative coreness between core and periphery () is large.
.1 Regimes
The cost, , is varied as an independent tunable parameter and the properties of the model networks are investigated as a function of this parameter. Specifically, we systematically increase the value of the cost, starting from the minimum load and until only essential links remain, namely links necessary to keep global connectivity.
Our pruning process, depending on the value of , necessarily leads to a crossover between different regimes of networks. Say that and are the least and most loaded links in the initial network, respectively. The regimes are:
-
1.
Connectivity Driven (A) - In this case, no links fall below the cost and hence no pruning takes place. It is apparent that this regime will essentially have only a fully-connected network (the reference network we begin with). Networks in this regime maximize connectivity but their profit is diminished (eq. 1).
-
2.
Core-Periphery (B) - In this regime, the network undergoes the most rapid changes in its structure. All the links that fall below the cost are removed sequentially and the load is redistributed to the remaining network. Nodes gain more traffic and the links that get pruned give rise to a variable core-periphery character. This character is not always prominent in the entire regime and depends strictly on the value of . An example is shown in fig. 1(B).
-
3.
Profit Driven (C) - This regime shows extreme structural changes in the network. Most links get pruned except the ones essential for connectivity - eventually giving rise to a tree-like structure towards the end of this regime, illustrated in fig. 1(C). Since we attach the same cost to each link, the cost of the network scales monotonically with the number of links. Thus, networks in this regime have the minimum possible cost.
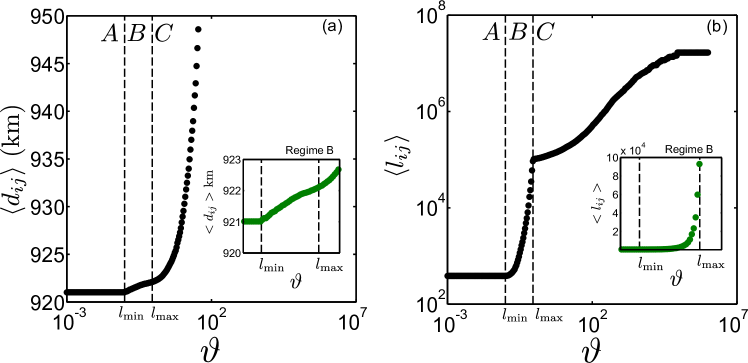
Upon removing links and redistributing their loads onto the remaining links, the modularity Leicht ; Newman3 , average shortest path length Watts1 and average load per link increase; see fig. 2, while the average degree and average clustering coefficient decrease Watts1 . This indicates that communities start emerging while keeping beneficial links intact and sacrificing the ones that lead to a shorter path for transfer of loads. The clustering in the network decays due to a periphery that is slowly emerging. It is worth noting that these curves exhibit a kink at (see fig. 2, Supplementary Note 6 and Supplementary Figures 7–9 for other characteristic properties). With a small increase in the average shortest path (fig. 2a), the average load on the remaining links increases (fig. 2b), thereby making them more significant for the network. At the network changes rapidly and links start getting pruned as they fall short of justifying their existence. Around , we observe that the network exhausts its pruning capabilities. The links that are removed now are the most loaded and hence transfer much more load to other links thereby slowing down the pruning process considerably.
Additionally, in regime A, since no link is pruned, the average shortest path length remains constant. As the pruning process becomes effective, the average shortest path slightly increases with the cost (regime B). By contrast, in regime C, the average shortest path increases exponentially with the cost. Note that as illustrated in the Supplementary Figures 10 and 11, the fraction of essential links required to ensure global connectivity is small unless the costs are very high, indicating that the constraint of global connectivity does not affect the network’s proclivity towards core-peripheries.
.2 Core Size
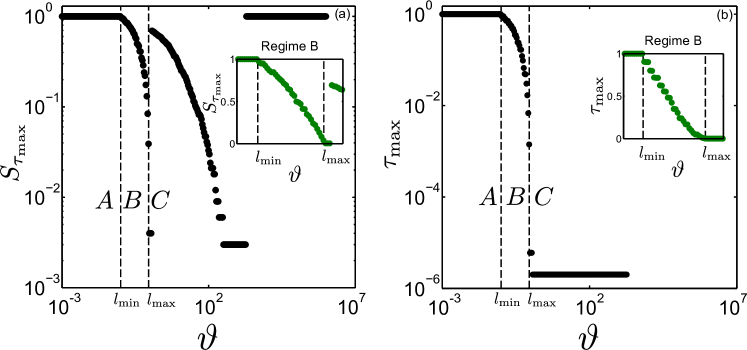
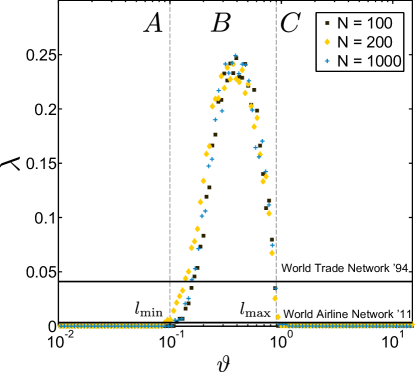
A t-core decomposition was performed at every value of to assess the network’s core-periphery properties. We measured the size of the core, , and the maximum relative coreness of the network, , as a function of the cost. Figure 3 shows that in regime A, where the network is still fully connected, the core consists of the entire network with a very large coreness since there are many triangles. On the other hand, in regime C, the tree-like network is sparsely connected such that it is essentially segregated into one shell at coreness, . Remarkably, between regimes B and C, the core size exhibits a discontinuity. The network undergoes a transition from a state where the size of the core is comparable to the system size but is of small coreness to a state with a small core and relatively large coreness. Since the empirical WAN is known to have a small core size of approximately but high inter-connectivity within the core Verma , it should be found in regime B with , where the value of is largest (see fig. 4). is close to zero in regime A and C, because we have a fully-connected network in A and a tree-like one in C. However, in regime B, where is maximum, we find a periphery emerging which is held together by the core in the middle (see fig. 1(B)). In this region, the difference in the relative coreness between core and periphery () is huge and the ratio of the number of nodes in the periphery to that of the core is much larger than unity (). The world trade network Smith and the WAN Openflights are also included in fig. 4 for comparison (solid horizontal lines). The trade network is only comprised of nodes, whereas, the airline network encompasses about nodes. These networks exhibit a lower core-periphery measure, , since there is a high cost for building networks. In contrast, a network that has no cost (or less cost) attached can comprise many more triangles within its core, consequently depicting a higher value for . In order to understand the physical depth of the quantity coreness, , we first discuss two limits of : a fully connected network (regime A) and a tree-like structure (regime C). In both cases . We tested another null configuration starting with a fully connected network of our main model where links are removed at random until the network turns into a tree (no more pruning is possible). As shown in Supplementary Figure 12, by contrast to the results with load redistribution, when links are simply removed at random, there is no well-defined maximum for , thus core-periphery structures do not emerge at any stage (Supplementary Note 7).
.3 Coreness Distribution
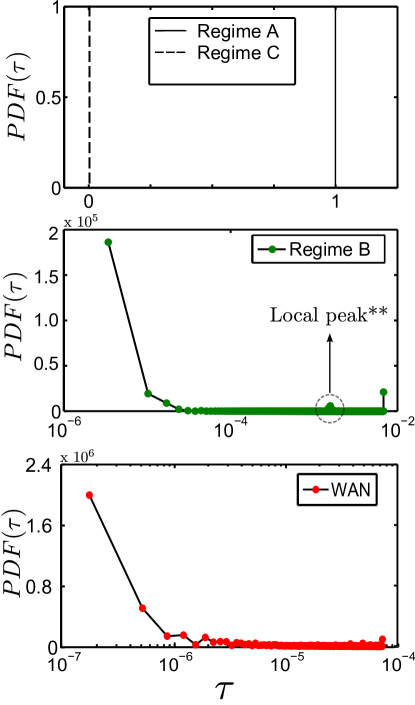
To evaluate the core-periphery properties of the networks, we calculated the probability density function (PDF) of the relative coreness of some exemplary model networks in each regime as well as the empirical WAN. Figure 5 shows the PDFs of the relative coreness of networks in each regime. Qualitatively, the core-periphery structure is visible in regime B networks. The periphery consists of many nodes with small coreness; probability dropping with increasing coreness (notice the semi-logarithmic scale).
The coreness densities of the networks from regimes A and C exhibit a markedly different behavior. In the case of a fully connected network (regime A), it consists of a single peak at and for the tree-like network (regime C), of a single peak at . Hence the entire network is segregated into one shell following the t-core decomposition. Due to their simplicity, the PDFs for regimes A and C are grouped in one plot.
Figure 1 illustrates the structural difference between the core-periphery network of regime B and the tree-like network of regime C. It is immediately evident how the core nodes (in black) are highly interconnected as they are grouped closely together by the force directed Fruchterman-Reingold algorithm Fruchterman . The algorithm uses spring-like attractive forces to attract the nodes that have a link between them, while simultaneously repulsive forces of charged particles are used to separate all pairs of nodes. This arrangement allows us to distinguish core from periphery. In the empirical WAN network, the core is spread over continents or different regions of the world (see Supplementary Figure 13).
.4 Resilience
Transportation networks in our globalized world have not resulted from a centralized optimization procedure. Most networks have resulted from the superimposition of many locally optimized networks and accretion of regional networks, providing for a globalized way to travel. In such scenarios, it is non-trivial to establish a common ground for measuring resilience. We use a basic measure, often used in the past to qualitatively assess the efficiency of a network Schneider to removal of nodes.
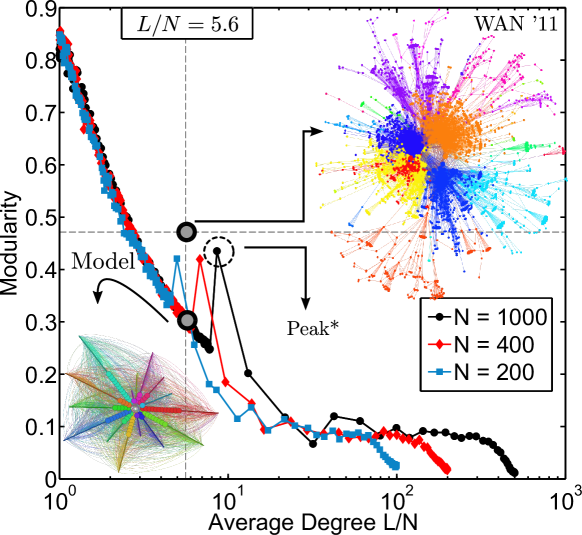
We compare the robustness of our modeled networks - for the same average degree - with the empirical WAN. As presented in Ref. Verma , the empirical network is very sensitive to the removal of high degree nodes and the size of the largest component drops very quickly (Supplementary Note 8 and Supplementary Figure 14). However, a model network in regime B appears more robust owing its topological strength to a strongly connected periphery where peripheral nodes have a few redundant links between each other. Figure 6 illustrates that the modularity of the network seems to result from the peripheral linkages, a topological feature that indicates the strength of intra-community links over links across communities. This is a grave factor contributing to its abrupt diminishing robustness. Our model produces robust networks that accrue benefit to network elements without compromising on the connectivity of these elements. In addition, the modularity peaks are a result of the increase in coreness of the network as the core collapses and a larger core takes shape (see fig. 5 - local peak** observed in the distribution of coreness for modeled networks). Furthermore, a detailed robustness analysis for various network sizes shows that the change in robustness does not depend on the network size and follows the same pattern for all network sizes (Supplementary Figure 15). For the same average degree, , the model generates many interconnected modules while the World Airline Network shows little or no links between modules (increment in modularity). In other words, the model networks have lower modularity compared to the world airline network which also has a larger average shortest path length, giving rise to more tightly knit modules.
I Discussion
We have presented a model producing the qualitative nature of the core-periphery structure observed in many real world networks. Remarkably, this is possible by dynamically allowing the failed links to redistribute their loads and the network’s effort to increase its profit, as two processes working on the network. We have also taken into account the costs imposed due to the spatial nature of such networks, by considering Euclidean distances between the nodes to define the new routes for the redistribution of loads. Simulating these processes on a network with no other fundamental assumptions, we obtain for a wide range of cost values, a small but densely interconnected core and a vast periphery.
Our pruning process not only produces core-periphery networks but also reveals different network regimes. The crossover between these regimes can be modeled using only a single cost-based parameter, . This parameter can be varied to show many interesting properties of the modeled networks. For instance, when a core-periphery structure is present, the average load on a link (a proxy for the benefit of the link) increases, while the average shortest path length between any two nodes (a proxy for convenience of load transfer) stays stable. Additionally, connectivity is optimized in regime A where everything is connected and profit is optimized in regime C, according to the construction of our model. However, note that regime B balances these two real world considerations and, interestingly, we find most real-world networks to exist in this region as well.
Though, not all networks are planned, their current condition is dictated by a variety of rules. Our efforts do not reproduce every kind of network verbatim and do not try to fully describe the evolutionary process of a network but give a plausible explanation for understanding profit-driven core-periphery networks. We not only produce the core-periphery character of networks, but also show that modeled networks are more resilient to removal of nodes compared to the empirical example of the world airline network. This resilience can be attributed to the less modular structure of the modeled networks. Since our modeled networks are stable and resilient to removal of nodes, it is natural to ask whether our approach could be used to design cost-efficient and resilient infrastructure networks, something policy makers might centrally control.
The process of pruning a globally connected network fundamentally differs from the bottom-up growth many real networks have undergone. Schneider et al. developed a pruning model which reproduces well many topological properties of protein interaction networks Schneider1 . Inspired by this strategy of preferential depletion, our model mimics core-periphery networks closely. Transport networks with a geographical dependence try to optimize faster connectivity with demand induced profit. An example includes the world airline network that is a possible outcome of individual airline networks competing and cooperating (wherever profitable) with each other. On the other hand, the networks of large carriers like Star Alliance could approximate the picture of a global network in which our model could make suggestions for improvements assuming the partners in such an alliance are able and willing to cooperate with each other.
Lastly, Peixoto et al. Peixoto show that the most robust topology against random failures is a core-periphery structure. By studying the percolation properties of arbitrary large-scale networks using robustness as the most significant force for driving the system, the authors show that a core-periphery network is the case of maximum entropy. Our non-equilibrium approach depicts that a network in regime B (critical window) will be highly robust in comparison to real networks. Louf et al. Louf have proposed a cost-benefit driven optimization model based on physical distances in transport networks to study their formation. An interesting revelation of their work is that cost driven network optimization leads to a hub-and-spoke structure, different from a core-periphery structure in our model. Louf et al. carried out the addition of links on a static system where the distances dictate the future of links. Our model differs from this in a way that a dynamic redistribution of loads is taken into account which encapsulates the collective nonlinear effects of various local load redistributions around the network. The interplay between load redistribution and profit provides a plausible explanation for core-peripheries in transport networks. We believe that our framework can be extended to other networks that are based on profit maximization.
II Methods
We ran tests for various system sizes, namely, and for each system randomly selected samples were considered.
References
- (1) International Air Transport Association. Passenger demand maintains historic growth rates in 2013. http://www.iata.org/pressroom/pr/Pages/2014-02-06-01.aspx (2013) (Accessed on 14 June 2014).
- (2) Budd, L., Griggs, S., Howarth, D., and Ison, S. A fiasco of volcanic eruptions? Eyjafjallajökull and the closure of European airspace. Mobilities 6, 31–40 (2011).
- (3) Zanin, M., Lillo, F. Modelling the air transport with complex networks: a short review. The European Physical Journal Special Topics 215, 5–21 (2013).
- (4) Verma, T., Araújo, N. A., Herrmann, H. J. Revealing the structure of the world airline network. Sci Rep 4, 5495 (2014).
- (5) Borgatti, S. P., Everett, M. G. Models of core/periphery structures. Soc Net 21, 375–395 (2000).
- (6) Holme, P. Core-periphery organization of complex networks. Phys Rev E 72, 046111 (2005).
- (7) Silva, M. R. D., Ma, H., Zeng, A. P. Centrality, network capacity, and modularity as parameters to analyze the core-periphery structure in metabolic networks. Proceedings of the IEEE 96, 1411–1420 (2008).
- (8) Csermely, P., London, A., Wu, L. Y., Uzzi, B. Structure and dynamics of core/periphery networks. Journal of Complex Networks 1, 93–123 (2013).
- (9) Fagiolo, G., Reyes, J., Schiavo, S. The evolution of the world trade web: a weighted-network analysis. J Evol Econ 20, 479–514 (2010).
- (10) Rossa, F. D., Dercole, F., Piccardi, C. Profiling core-periphery network structure by random walkers. Sci Rep 3, 1467 (2013).
- (11) Elliott, M., Golub, B., Jackson, M. O. Financial networks and contagion. Available at SSRN, 2175056 (2013).
- (12) Rombach, M. P., Porter, M. A., Fowler, J. H., Mucha, P. J. Core-periphery structure in networks. SIAM Journal on Applied mathematics 74, 167–190 (2014).
- (13) Avin, C., Lotker, Z., Pignolet, Y. A., Turkel, I. From Caesar to Twitter: an axiomatic approach to elites of social networks. Preprint at http://arxiv.org/abs/1111.3374 (2011).
- (14) Black, W. R. An Iterative Model for Generating Transportation Networks: A comprehensive review. Geographical Analysis 3, 283–288 (1971).
- (15) Gastner, M. T., Newman, M. E. J. Shape and efficiency in spatial distribution networks. J Stat Mech 2006, P01015 (2006).
- (16) Dijkstra, E. W. A note on two problems in connexion with graphs. Numerische mathematik 1, 269–271 (1959).
- (17) Louf, R., Jensen, P., Barthélemy, M. Emergence of hierarchy in cost-driven growth of spatial networks. Proc Natl Acad Sci USA 110, 8824–8829 (2013).
- (18) Dorogovtsev, S. N., Goltsev, A. V., Mendes, J. F. F. K-core organization of complex networks. Phys Rev Lett 96, 040601 (2006).
- (19) Leicht, E. A., Newman, M. E. J. Community structure in directed networks. Phys Rev Lett 100, 118703 (2008).
- (20) Newman, M. E. J. Modularity and community structure in networks. Proc Natl Acad Sci USA 103, 8577–8582 (2006).
- (21) Watts, D. J., Strogatz, S. H. Collective dynamics of small-world networks. Nature 393, 440–442 (1998).
- (22) Fruchterman, T. M. J., Reingold, E. M. Graph drawing by force-directed placement. Software: Practice and Experience 21, 1129–1164 (1991).
- (23) Smith, D. A, White, D. R. Structure and dynamics of the global economy: network analysis of international trade 1965 - 1980. Social forces 70, 857–893 (1992).
- (24) Patokallio, J. OpenFlights Data. http://openflights.org/data.html (2012) (Accessed on 28 May 2013).
- (25) Schneider, C. M., Moreira, A. A., Andrade Jr, J. S, Havlin, S, Herrmann, H. J. Mitigation of malicious attacks on networks. Proc Natl Acad Sci USA 108, 3838–3841 (2011).
- (26) Schneider, C. M., De Arcangelis, L., Herrmann, H. J. Modeling the topology of protein interaction networks. Phys Rev E 84, 016112 (2011).
- (27) Peixoto, T. P., Bornholdt, S. Evolution of robust network topologies: Emergence of central backbones. Phys Rev Lett, 109, 118703 (2012).
Acknowledgements.
We acknowledge financial support from the ETH Risk Center, European Research Council through Grant FlowCSS No. FP7-319968. and Portuguese Foundation for Science and Technology (FCT) under Contracts nos. EXCL/FIS-NAN/0083/2012, UID/FIS/00618/2013 and IF/00255/2013.See pages 1-19 of SI.pdf