Now at ]Lancaster University, Lancaster, LA1 4YB, UK.
Now at ]South Dakota School of Mines and Technology, Rapid City, South Dakota 57701, USA.
Now at ]Lancaster University, Lancaster, LA1 4YB, UK.
The MINOS Collaboration
Measurement of the multiple-muon charge ratio in the MINOS Far Detector
Abstract
The charge ratio, , for cosmogenic multiple-muon events observed at an underground depth of 2070 mwe has been measured using the magnetized MINOS Far Detector. The multiple-muon events, recorded nearly continuously from August 2003 until April 2012, comprise two independent data sets imaged with opposite magnetic field polarities, the comparison of which allows the systematic uncertainties of the measurement to be minimized. The multiple-muon charge ratio is determined to be . This measurement complements previous determinations of single-muon and multiple-muon charge ratios at underground sites and serves to constrain models of cosmic-ray interactions at TeV energies.
pacs:
13.85.Tp,95.55.Vj,95.85.RyI Introduction
Atmospheric muons are produced when primary cosmic-ray nuclei interact in the upper atmosphere, yielding hadronic showers that contain pions and kaons. These secondary mesons can either interact in further collisions in the atmosphere or decay to produce atmospheric muons. Precision measurements of the muon charge ratio, /, in cosmic-rays can be used to improve models of the interactions of cosmic rays in the atmosphere. Single-muon and multiple-muon events provide complementary information that feeds into the development of these models. In addition, measurements of the cosmic-ray muon charge ratio from a few GeV to a few TeV are important for constraining calculations of atmospheric neutrino fluxes. These are of interest both for detailed measurements of neutrino oscillations in atmospheric neutrino experiments and also for calculations of backgrounds for neutrino telescopes. The muon charge ratio is a particularly useful tool for testing the predicted atmospheric ratio.
Single-muon charge ratio measurements performed by MINOS (Near Detector) Adamson et al. (2011), L3+C Achard et al. (2004), Bess-TeV Haino et al. (2004), CosmoALEPH Zimmermann et al. (2004) and CMS Khachatryan et al. (2010) at surface-level energies, , ranging from a few hundred MeV to 100 GeV are consistent with the 2001 world average of Hebbeker and Timmermans (2002). This apparent constancy over three orders of magnitude in muon energy can be interpreted as a consequence of Feynman scaling Feynman (1969). At TeV surface energies, MINOS (Far Detector) Adamson et al. (2007) and OPERA Agafonova et al. (2014) reported higher values for the muon charge ratio, and , respectively. The atmospheric muon charge ratio for single muons is not unity because the primary cosmic rays are mostly protons, which have a preponderance of quarks, favoring the production of a leading or over and . The existence of associated production, e.g., , additionally favors over . Due to the steeply falling primary cosmic-ray energy spectrum, which follows an power law, a single-muon event in a deep underground detector is more likely to arise from the decay of a leading hadron than from a secondary hadron or later generation hadrons. The rise at TeV energies is explained in Ref. Schreiner et al. (2009) as an increased contribution from kaon decay in the region of muon energy and zenith angle . The critical energies, , are meson energies for which the decay probability and interaction probability are equal at the altitude in the atmosphere where the majority of detected muons are produced. The values for these energies are GeV and GeV Zatsepin and Kuzmin (1961).
In underground detectors, a multiple-muon event occurs when two or more almost-parallel muons are observed that originate from a common cosmic-ray primary. The process typically involves more than the decay of a single leading hadron. Events can be produced by two or more hadrons from the first interaction, or by particles produced in secondary interactions or deeper in the hadronic shower. Some events are also produced by the dimuon decay of a single leading hadron, but the branching fraction for this process is relatively small. In the MINOS Far Detector, which has a depth of 2070 meters-of-water equivalent (mwe), multiple-muon events account for 7% of the observed cosmic-ray events. In a multiple-muon event, there can be some muons for which the charge is well measured and other muons for which the charge measurement is ambiguous. This paper reports the charge ratio in MINOS for tracks in multiple-muon events in which at least one muon’s charge is well-measured, whether or not the charges of other muons in the same multiple-muon event are known. In multiple-muon events, all muons with a well-measured charge are included in the calculation of the charge ratio.
Previously, OPERA reported values of (2010) Agafonova et al. (2010) and (2014) Agafonova et al. (2014) for the multiple-muon charge ratio at a depth of 3800 mwe, smaller than the single-muon ratio cited above. In the next three paragraphs, three related factors are discussed that might make the measured multiple-muon charge ratio lower than the single-muon charge ratio: (a) the importance of the leading quark charge is diminished for nonleading hadrons and those produced after the first interaction, (b) the possibility of an increased heavy-nucleus component of the cosmic-ray flux at high energy, and (c) the kinematics of multiple-muon events coupled with the maximum detectable momentum (MDM) of a magnetic detector like MINOS.
The single-muon charge ratio is larger than unity because the incoming cosmic rays have more quarks than quarks. In the production of additional positive and negative hadrons in the first and subsequent interactions, that effect must be diminished.
A second effect comes from the fact that heavier elements make a relatively larger contribution to the cosmic-ray primaries responsible for multiple-muon events than for single-muon events, for two reasons. First, the mean primary cosmic-ray energy for observed multiple muons is higher than that for single muons, and it is expected that heavier elements become a more important component of cosmic-ray primaries at higher energies Olive et al. (2014). Second, massive primaries generate more high-energy muons per event than proton primaries of the same total energy. This is because the first interaction point of the heavy primary is likely to be higher in the atmosphere than for a proton primary. A heavy nucleus has a larger cross section for the interactions with air, and the lower density in the upper atmosphere favors pion decay over interaction early in the cascade development. Heavy nuclei also contain neutrons, which have twice as many quarks as quarks, and are therefore more likely to produce a leading negative pion, resulting in a decreased muon charge ratio.
The third effect arises since the probability of being able to measure the curvature sufficiently well decreases with increasing muon momentum. A magnetic detector can only reliably measure the charge of muons with a momentum below the MDM, which depends on the magnetic field and the detector geometry. Thus sometimes the highest-energy muon at the detector in a multiple-muon event will not have the sign of its curvature determined. In these situations, only lower-energy muons, from nonleading pions, will be used in the determination of the charge ratio. Since the leading pion is the most likely to carry the excess positive charge in the shower, this effect will reduce the measured charge ratio. This effect is explained in more detail in Sec. II.
The paper is organized as follows: the MINOS Far Detector is described in Sec. II. The analyses of the MINOS multiple-muon data and the Monte Carlo (MC) simulation are described respectively in Secs. III and IV. The determination of the multiple-muon charge ratio is presented in Sec. V, including the corrections for charge misidentification and the calculations of systematic uncertainties. A summary is given in Sec. VI.
II The MINOS Far Detector
The MINOS Far Detector (FD) is a magnetized planar steel-scintillator tracking calorimeter located at a depth of 2070 mwe in the Soudan Underground Laboratory, in an iron mine in northern Minnesota (latitude 47.82027∘ N and longitude 92.24141∘ W). The detector consists of two supermodules separated by a gap of 1.15 m and has a total dimension of . The two supermodules contain a total of 486 octagonal steel planes, each 2.54 cm thick, interleaved with 484 planes of 1 cm thick extruded polystyrene scintillator strips, at a 5.94 cm pitch. Each scintillator plane has 192 strips of width 4.1 cm. The scintillator strips in alternating detector planes are oriented at 45∘ to the vertical. Each plane has a small hole in the center for the magnet coil.
Scintillation light is collected by wavelength-shifting (WLS) plastic fibers embedded within the scintillator strips. The WLS fibers are coupled to clear optical fibers at both ends of a strip and are read out using 16-pixel multianode photomultiplier tubes (PMTs). The signals from eight strips, each one of which is separated by approximately 1 m within the same plane, are optically summed and read out by a single PMT pixel. The fibers summed on each pixel are different for the two sides of the detector, which enables the resulting eightfold ambiguity to be resolved for single-track events. For multiple-muon events, ambiguities are resolved with a high level of accuracy using additional information from timing and event topology.
The data acquisition and trigger have been described in Ref. Adamson et al. (2006). Time and pulse height on each strip are digitized locally. The primary trigger requires activity to be observed on 4 planes out of 5 within 156 ns. More detailed detector information can be found in Ref. Michael et al. (2008).
In order to measure the momentum of muons traversing the detector, the steel has been magnetized into a toroidal field configuration. The field varies in strength from 1.8 T near the magnetic coil to around 1 T near the edges. In one magnetic field setting, negative muons resulting from interactions of neutrinos from the Fermilab NuMI beam are focused toward the center of the detector. This magnetic field orientation will be referred to as the forward field (FF) configuration. In the reverse field (RF) configuration, the coil current is reversed and positive muons from beam antineutrinos are focused into the detector.
A reconstruction program turns scintillator hits into tracks, and a Kalman filter procedure Fruhwirth (1987) is used to fit the track trajectories. The Kalman filter performs a series of recursive matrix manipulations to specify the trajectory of the particle as well as the ratio of its charge to its momentum, . It also provides an uncertainty, , on the measured value of . Single muon tracks are found with high efficiency. The reconstruction program has not been tuned for multiple-muon events. The techniques to achieve charge separation for reconstructed muons are described in the next section, and the efficiencies for track reconstruction and charge separation are considered in Sec. IV.
One important aspect of the present analysis is the detector’s MDM. Due to the leading particle effect mentioned in Sec. I, the excess of positive charge is most likely carried by the highest-energy muon, which for a multiple-muon event is frequently the least likely to have a well-measured charge. In MINOS, the MDM is approximately a function only of the angle with respect to the detector axis and the distance of closest approach to the magnet coil, called the impact parameter, which can vary from zero to four meters Fields (2006). For favorable values of these two parameters the MDM reaches 470 GeV, but is as low as 15 GeV for other angles and impact parameters. The 3 requirement on the measurement of curvature in this analysis leads to a charge measurement for only a small fraction of single and multiple muons in MINOS (see Ref. Adamson et al. (2007) and Table 1). For a track 20∘ from the zenith, the MDM varies from 220 GeV for a track with an impact parameter of 0.5 m mostly perpendicular to the magnetic field, to 17 GeV for a track with an impact parameter of 3.5 m mostly parallel to the magnetic field.
III Data Sample
The multiple-muon sample reported in this paper was recorded between August 2003 and April 2012. During the data-taking period, the detector ran 80.97% in the FF and 19.03% in the RF configurations.
Selection criteria are chosen to ensure good quality data, filter well-reconstructed multiple-muon events, and separate muons based on their charge. An initial preselection stage of the event selection aims to identify and remove periods of data associated with detector hardware problems Blake (2005). Events with two or more tracks are then selected for analysis. Next, a series of six track analysis cuts are applied to the data. First, the collection of multi-GeV muons within a multiple-muon event must be highly parallel; to ensure this condition, at least two muons must be reconstructed with an angular separation of less than 5∘. If at least two tracks in an event satisfy this cut, all the muons in that event may be counted in the multiplicity, .
Tracks are required to have crossed at least 20 planes in the detector, and to have a path length of at least 2 m. Each track in a multiple-muon event must be reconstructed as pointing downward, based on timing in the scintillator. The entry point of each track is required to be less than 50 cm from the outside surface of the detector and greater than 50 cm from the central axis (referred to as the fiducial volume cut). To ensure the quality of track reconstruction, a selection requirement of is placed on the goodness of fit variable returned by the Kalman filter procedure. These selection cuts are similar to those used in the previous ND and FD single-muon charge ratio analyses Adamson et al. (2011, 2007). The multiplicity of an event is defined as the number of tracks passing these cuts.
The method to identify tracks with well-determined charge is the same as that used in the MINOS single-muon charge-ratio analysis Adamson et al. (2007), and is described in the rest of this section. This charge-separation procedure only selects a small fraction of tracks since many muons in MINOS do not noticeably bend in the magnetic field. In this paper, the charge ratio is defined for all tracks that are determined to have well-measured charge. If more than one track in a multiple-muon event has a well-measured charge, each will be included in the calculation of . 91.6 % of the events in the full multiple-muon sample satisfy this criterion.
Two selection variables are used to increase the degree of confidence in the assigned curvature and charge sign of the tracks. The first variable uses outputs of the Kalman filter technique used in the track curvature fitting. The quantity , called the curvature significance, can be thought of as the significance with which a straight-line fit to the track can be rejected, using the pattern of curvature that is expected given the magnetic field. Figure 1 shows the measured multiple-muon charge ratio in the data as a function of the curvature significance. The figure shows separately the data taken in the two magnetic field orientations, illustrating systematic differences in the charge ratio measurements between FF and RF data. These differences come from acceptance effects due to the magnetic field, detector asymmetry, and detector alignment errors. To remove these biases, data taken in the two field orientations is combined by calculating a geometric mean (GM) between the two data sets, described at the beginning of Sec. V.
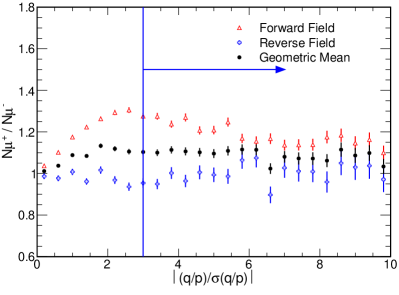
Events with low values of the curvature significance are typically high-momentum tracks () that do not significantly curve while traversing the MINOS detector. For such tracks, the charge sign determined by the fitter becomes less reliable. As the curvature significance tends to zero, the fitter picks the two charge signs with nearly equal probability and, as can be seen from Fig. 1, the measured charge ratio tends to unity. A cut is applied such that only tracks with are used in the analysis.
The second charge quality selection variable, , is defined as
| (1) |
where is the component of the magnetic field perpendicular to the track direction, , at a given point along the track path, is the distance from the detector center axis, is the differential path length element along the track in the magnetic field, and the integral runs from the point where the muon enters the detector to the point at which it either exits the detector or stops in the detector. This variable quantifies the magnitude of the bending due to the magnetic field.
Figure 2 shows the measured multiple-muon charge ratio in the data as a function of . For this analysis, it was required that 5 Tm. For low values of , track curvature due to multiple scattering is comparable to the magnetic bending and the measured charge ratio approaches unity as expected in the case of random charge determination. The cut was chosen in Ref. Adamson et al. (2007) as the value above which charge misidentification becomes negligible.111In Ref. Adamson et al. (2007), the length was defined as the total track length. In Ref. Adamson et al. (2011) and in this paper, the length through the magnetized steel is used. The cut was commensurately adjusted. This issue is discussed in some detail in Ref. Schreiner et al. (2009).
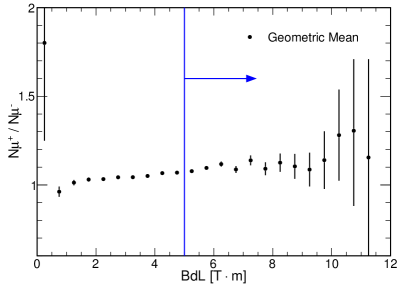
Table 1 summarizes the number of muon tracks that pass each of the selection cuts. The final selected sample is then used in the calculation of the multiple-muon charge ratio, which is described in Sec. V.
| Cuts | Number of muons remaining | |
|---|---|---|
| Preselected tracks | (100%) | |
| Track analysis cuts | ||
| Parallel tracks () | (87.5%) | |
| 20 planes | (70.5%) | |
| 2 m track length | (70.3%) | |
| Downward-going track | (70.2%) | |
| Fiducial volume | (68.9%) | |
| Fit quality: | (61.9%) | |
| Charge-sign quality cuts | ||
| (13.0%) | ||
| 5 Tm | (3.7%) | |
IV Simulated atmospheric muons
Two distinct samples of simulated atmospheric muons are used to evaluate the efficiency of the cuts in Table 1: one sample to evaluate the multiple-muon track reconstruction efficiency, and another sample to evaluate the charge separation efficiency. These two Monte Carlo (MC) data samples use different methods to simulate the muon charges and momenta, as well as the vertex positions where the muons enter the detector. In each case, this information is used as the input to the GEANT4-based simulation Agostinelli (2003) that propagates the muons through the MINOS FD, taking into account the magnetic field and the muon energy losses as they travel through the steel and scintillator. This GEANT4-based simulation furthermore models the production of light in the scintillator strips and the full chain of PMTs and readout electronics that converts this light into raw detector data. These simulated data are then passed through the same reconstruction and analysis as the real data.
| Reconstructed | Simulated multiplicity: multiple-muon events per multiplicity | ||||||||
|---|---|---|---|---|---|---|---|---|---|
| M | |||||||||
| 1 | 16593 | 15632 | 12248 | 10314 | 9351 | 8856 | 8525 | 8526 | 8411 |
| 2 | 58057 | 28359 | 24000 | 22080 | 17845 | 15919 | 15004 | 14550 | 14154 |
| 3 | 1 | 38355 | 27336 | 24906 | 22757 | 21092 | 19897 | 18999 | 18422 |
| 4 | 1 | 21913 | 20577 | 20245 | 20198 | 19744 | 19024 | 18205 | |
| 5 | 1 | 10654 | 12593 | 13794 | 14285 | 14428 | 14022 | ||
| 6 | 4497 | 6420 | 7532 | 8021 | 8351 | ||||
| 7 | 1 | 1697 | 2686 | 3471 | 3914 | ||||
| 8 | 502 | 999 | 1347 | ||||||
| 9 | 131 | 319 | |||||||
| 10 | 33 | ||||||||
| 58.1% | 66.7% | 73.3% | 78.2% | 77.9% | 79.1% | 79.7% | 79.6% | 78.8% | |
| 58.1% | 38.4% | 21.9% | 10.7% | 4.5% | 1.7% | 1% | |||
The reconstruction algorithms must form tracks out of scintillator signals. The scintillator strips in alternating planes are oriented at to each other; scintillator hits in each of these two views are used to reconstruct muon tracks. The tracks of multiple muons passing through the detector simultaneously may overlap in one or both of these views. This overlap can confuse the reconstruction algorithms, resulting in reconstruction failures. To assess the frequency of such reconstruction failures, it is necessary to produce a sample of simulated muons with distributions of vertex positions and directions that accurately match the data. To obtain the necessary MC sample, the vertex positions and direction cosines of a large sample of real cosmic muon data are used as the seeds of simulated multiple-muon events in the detector. Once a vertex position and direction has been chosen for the primary muon of the event, the vertex positions and directions of the subsequent muons are taken from real muons that have directions within of the primary muon. To obtain broadly representative energy and charge distributions for these simulated muons, the energy and charge of each muon is taken from a CORSIKA Heck and Pierog simulation, which is described in more detail below.
To evaluate the track reconstruction efficiency, samples of multiple-muon events were generated for each muon multiplicity from 2 to 10. Table 2 shows the remaining number of reconstructed multiple-muon events in the MINOS FD after the preselection and analysis cuts are applied. For each generated multiplicity, , Table 2 shows the track reconstruction efficiency of the multiple-muon events, , defined as the sum of all events with at least two reconstructed muons divided by the number of generated multiple-muon events. Table 2 also shows the efficiency of well-reconstructed multiple-muon events, , defined as the number of reconstructed multiple-muon events with the same multiplicity as the corresponding generated event, divided by the number of generated events. It is important in the analysis that multiple-muon events be identified as such, even though all of the muons in the event may not be reconstructed. The efficiency for identifying a multiple-muon event is 60%–80% as shown in Table 2. The efficiency for measuring the correct multiplicity for is much lower, but this is less important for this analysis.
The most important factor affecting the charge separation efficiency for tracks in multiple-muon events is the presence of large showers along the muon track, resulting from bremsstrahlung from radiative energy loss. The track reconstruction algorithm occasionally includes scintillator hits from these showers as part of the muon track, resulting in an otherwise straight track being reconstructed with an apparent curvature with high significance. The frequency of such large showers along muon tracks depends directly on the energy of the muon. Therefore, to obtain a sample of simulated muons suitable for determining the charge separation efficiency, it is vital that the energy distribution of the muons is correct, and in particular that the energy distribution of muons within each multiple-muon event is correct.
To evaluate the charge separation efficiency, the CORSIKA cosmic-ray simulation was used to generate the energy distribution of the muons. CORSIKA uses an initial primary cosmic-ray spectrum to generate particle showers in the atmosphere, and propagates muons from meson decay to the Earth’s surface. The energy of these muons at the surface level is converted to energies at the detector level by considering energy loss as the muons traverse a distance through the Soudan rock to the detector Reichenbacher (2007),
| (2) |
where the parameters and describe the energy lost by a muon of energy through collisional and radiative processes, respectively. Equation (2) assumes continuous energy loss and does not account for fluctuations Lipari and Stanev (1991). The energy loss parameters for standard rock ( and ), as a function of energy, are given in Reichenbacher (2007). The values considered in the analysis for these parameters are: 2.44 MeV.cm2/g and 3.04 10-6 cm2/g.
A total of atmospheric cosmic-ray showers were generated with primaries in the energy range between 4 TeV and 400 TeV. The showers that resulted in multiple-muon events at the depth of the MINOS FD were kept, preserving the correlation between the momenta of muons within a multiple-muon event. These muons were then used as seeds for the GEANT4-based detector simulation, assigning vertex positions and directions from data events as described earlier for the track-efficiency MC sample. Note that the charge-ratio output from CORSIKA was not tuned to the MINOS data, since detector symmetries indicate there should be no difference in the efficiency of charge separation between a and a . Note also that any correlation between muon energy and angle has been neglected in this simulation. This is acceptable, since any such correlation would have a small effect on the measured charge separation efficiency; in Sec. V, a systematic uncertainty is determined on the charge separation efficiency that heavily dominates the size of any possible effect from this neglected correlation.
Defining as the number of muons with true charge reconstructed with charge , the charge purity, , can be defined as the quotient between the number of well-identified muon charges ( + ) and the total number of identified charges ( + ),
| (3) |
Table 3 shows the number of generated, charge-separated and correctly identified charges as well as the charge purity obtained for several muon multiplicities. Note that the purity obtained from the MC simulation is not calculated separately for positive and negative muons and that, with this definition, the purity and efficiency are equal. Differences in the efficiency for positive and negative muons appear in Table 3 because only the FF configuration was simulated. There is an asymmetry in the acceptance between tracks traveling along or against the axis of the detector, and a difference in overburden in those two directions. These effects cancel in the data using the GM. A corrected charge ratio is obtained using the purity from Eq. (3).
| No of | No of | No of well- | |||||
|---|---|---|---|---|---|---|---|
| generated | charge-separated | identified | |||||
| 2 | 101534 | 98466 | 2227 | 2106 | 2132 | 1979 | 94.9 0.3 |
| 3 | 150359 | 149641 | 2659 | 2734 | 2500 | 2523 | 93.1 0.3 |
| 4 | 200125 | 199875 | 3113 | 3153 | 2869 | 2889 | 91.9 0.3 |
| 5 | 251209 | 248791 | 3309 | 3444 | 3044 | 3160 | 91.9 0.3 |
| 6 | 310203 | 289797 | 3614 | 3130 | 3308 | 2781 | 90.3 0.4 |
Previously, MINOS obtained a charge purity above 99% for a simulated single-muon sample Adamson et al. (2011). Table 3, on the other hand, shows that purities for simulated multiple-muon samples are lower than those obtained for the single-muon events. Based on a scanning study, the lower purity of charge separation observed in the multimuon sample is largely due to the greater fraction of events with large showers. This is expected since the higher average energy of multiple-muon events compared to single-muon events will result in a higher rate of radiative energy loss.
V Determination of the Multiple-Muon charge ratio underground
As discussed in Sec. III, there is a bias in the charge ratio when it is calculated using only data from a single magnetic field orientation. To cancel the geometrical acceptance effects and alignment errors that cause this bias, data taken in both magnetic field configurations is combined with a GM Adamson et al. (2007); Schreiner et al. (2009); Matsuno et al. (1984),
| (4) |
where the are the number of positive and negative muons measured in the FF and RF configurations. is the measured charge ratio, uncorrected for muon charge-separation efficiency. Figure 1 illustrates that the significant bias in the charge ratio measured with a single field orientation is strongly suppressed in the GM.
After applying all the cuts shown in Table 1, a final sample of 312514 muon tracks was obtained from 298291 events with . In the FF sample 137392 and 115714 were selected. In the RF sample 29732 and 29676 were selected. The mean reconstructed momentum for these tracks in the detector is 48 GeV, while the typical momentum of muons that fail the cuts is much higher. Table 4 shows the number of observed positive and negative charge-separated muons in both field configurations as a function of the muon multiplicity.
| Forward Field (FF) | Reverse Field (RF) | |||
| N | N | N | N | |
| 2 | 106248 | 88924 | 23282 | 22719 |
| 3 | 20886 | 18049 | 4330 | 4594 |
| 4 | 6501 | 5578 | 1382 | 1488 |
| 5 | 2386 | 1972 | 457 | 534 |
| 6 | 888 | 770 | 187 | 212 |
| 7 | 323 | 271 | 70 | 92 |
| 8 | 104 | 98 | 18 | 26 |
| 9 | 42 | 42 | 5 | 9 |
| 10 | 14 | 10 | 1 | 2 |
| All | 137392 | 115714 | 29732 | 29676 |
Table 5 shows the calculated muon charge ratio as a function of the muon multiplicity obtained from the GM of the two magnetic field orientations. The measured charge ratio over all multiplicities is .
To obtain the true charge ratio of the multiple-muon events reaching the MINOS FD, must be corrected to account for the charge-separation efficiency, . The details of this correction are given in Appendix A. The corrected charge ratio, , is related to the uncorrected GM, , and the charge-separation efficiency, , from Table 3, by
| (5) |
Table 6 shows as a function of muon multiplicity, taking into account the fact that depends upon the multiplicity. Over all multiplicities, the correction increases the charge ratio by 0.013, giving an efficiency-corrected charge ratio of .
| M | Forward field | Reverse field | Geometric mean |
|---|---|---|---|
| (FF) | (RF) | (GM) | |
| 2 | 1.195 0.005 | 1.025 0.010 | 1.107 0.006 |
| 3 | 1.157 0.012 | 0.943 0.020 | 1.044 0.012 |
| 4 | 1.165 0.021 | 0.929 0.035 | 1.040 0.022 |
| 5 | 1.210 0.037 | 0.856 0.055 | 1.018 0.036 |
| 6 | 1.153 0.057 | 0.882 0.088 | 1.009 0.056 |
| 7 | 1.192 0.098 | 0.761 0.121 | 0.952 0.085 |
| 8 | 1.061 0.149 | 0.692 0.212 | 0.857 0.145 |
| 9 | 1.000 0.218 | 0.556 0.310 | 0.745 0.223 |
| 10 | 1.400 0.580 | 0.500 0.612 | 0.837 0.541 |
| All | 1.187 0.005 | 1.002 0.008 | 1.091 0.005 |
| Meas. charge | Charge | Corrected charge | |
| ratio () | efficiency (%) | ratio () | |
| 2 | 1.107 0.006 | 94.9 0.3 | 1.119 0.007 |
| 3 | 1.044 0.012 | 93.1 0.3 | 1.052 0.014 |
| 4 | 1.040 0.022 | 91.9 0.3 | 1.048 0.026 |
| 5 | 1.018 0.036 | 91.9 0.3 | 1.021 0.043 |
| 6 | 0.974 0.044 | 90.3 0.4 | 0.968 0.054 |
| All | 1.091 0.005 | 94.4 0.3 | 1.104 0.006 |
Two sources of systematic error are considered: first, a contribution from possible failure to fully cancel effects of magnetic field and alignment errors by reversing the magnetic field (bias); second, a contribution from not fully accounting for the charge-separation failures that tend to give a random charge determination (randomization) Schreiner et al. (2009).
The systematic error on bias can be evaluated by comparing the ratio to the ratio which, in the case of no bias, should be identical. This comparison accounts for all biases whatever the source, and includes focusing effects, errors in the magnetic field maps, and possible curvatures in the coordinate system. This systematic error was determined for the MINOS FD single-muon charge-ratio analysis Adamson et al. (2007) to be , and this value of the uncertainty also applies to this multiple-muon analysis.
To calculate the systematic uncertainty on the rate of charge randomization, the error on the measured charge misreconstruction rate in the MC simulation is estimated. These charge reconstruction failures are dominated by events with large radiative energy loss, which has a significantly higher rate for muon energies above 1 TeV. An inaccurate muon energy distribution being modeled by CORSIKA would be a source of systematic error. This is examined by comparing some features of our MC with two other MC simulations: a different version of CORSIKA, and an earlier program developed for the Soudan 2 experiment Kasahara (1997); Kasahara et al. (1997), which studied multiple-muon events at a location near the MINOS FD. No differences were noticed in the calculations of energy loss, multiplicity, and other features of multiple-muon events underground. As another check, the rate of reconstructed showers was compared in the data, in the MC simulation, and in charge-misidentified MC events. There was a negligible rate of charge-misidentified events with no showers. The mean number of showers in events with at least one shower in these three samples was 1.70, 2.14 and 2.68 respectively. There is thus some evidence that the Monte Carlo simulation is overestimating the number of high-energy muon events, and hence the correction to the charge ratio. The ratio 2.14/1.70 = 1.26 is taken as evidence that there are 26% more showers in the MC than there should be. This value is conservatively increased by half, and 39% systematic error is used as a possible overcorrection. Half of 39%, or 20%, is then taken as the systematic error on a possible undercorrection. Since the size of the correction is 0.013, this leads to a systematic error on from randomization of . When combined in quadrature with the systematic error from bias, the total systematic error is .
Thus the efficiency-corrected multiple-muon charge ratio at a depth of 2070 mwe is determined to be . This measurement agrees within uncertainties with the recent OPERA measurement of (2014) Agafonova et al. (2014) and has a much smaller uncertainty.
VI Summary
A measurement of the multiple-muon charge ratio, , has been performed using the full MINOS FD atmospheric data set. For multiple-muon events the measured charge ratio is before correcting for charge misidentification. The efficiency-corrected charge ratio is
| (6) |
The calculated underground multiple-muon charge ratio [Eq. 6)] is lower than the single-muon charge ratio measurements obtained by several experiments in the past Adamson et al. (2011); Achard et al. (2004); Haino et al. (2004); Zimmermann et al. (2004); Khachatryan et al. (2010); Hebbeker and Timmermans (2002); Adamson et al. (2007); Agafonova et al. (2010). This result gives support to hypotheses about the decrease of the charge ratio for multiple-muon events discussed in Sec. I, providing a better understanding of the mechanism of multiple-muon production in the atmosphere. Although the measured ratio in principle depends on the depth, shape of the overburden, area, and MDM of an underground detector, the result is consistent with the last OPERA multiple-muon charge ratio measurement Agafonova et al. (2014).
VII ACKNOWLEDGMENTS
This work was supported by the U.S. DOE, the U.K. STFC, the U.S. NSF, the State and University of Minnesota, the University of Athens, Greece, and Brazil’s FAPESP, CAPES and CNPq. We are grateful to the Texas Advanced Computer Center, the Minnesota Department of Natural Resources, the crew of Soudan Underground Laboratory, and the Fermilab personnel for their contributions to this effort.
Appendix A Purity-corrected multiple-muon charge ratio
As defined in Sec. IV, is the number of muons with true charge reconstructed with charge . Assuming that the charge efficiency, , is the same for both positive and negative muons in both MC and data, we have
| (7) |
| (8) |
| (9) |
Combining Eqs. (7), (8) and (9) we can express the measured charge ratio as
| (10) |
Reordering the terms,
| (11) |
Furthermore, the true charge ratio is
| (12) | |||||
The associated error, , is obtained by propagating the errors on and through Eq. (13):
| (14) |
Using and , we obtain .
References
- Adamson et al. (2011) P. Adamson et al. (MINOS Collaboration), Phys. Rev. D 83, 032011 (2011).
- Achard et al. (2004) P. Achard et al. (L3 Collaboration), Phys. Lett. B 598, 15 (2004).
- Haino et al. (2004) S. Haino et al., Phys. Lett. B 594, 35 (2004).
- Zimmermann et al. (2004) D. Zimmermann et al., Nucl. Instrum. Methods Phys. Res., Sect. A 525, 141 (2004).
- Khachatryan et al. (2010) V. Khachatryan et al. (CMS Collaboration), Phys. Lett. B 692, 83 (2010).
- Hebbeker and Timmermans (2002) T. Hebbeker and C. Timmermans, Astropart. Phys. 18, 107 (2002).
- Feynman (1969) R. Feynman, Phys. Rev. Lett. 23, 1415 (1969).
- Adamson et al. (2007) P. Adamson et al. (MINOS Collaboration), Phys. Rev. D 76, 052003 (2007).
- Agafonova et al. (2014) N. Agafonova et al. (OPERA Collaboration), Eur. Phys. J. C 74, 2933 (2014).
- Schreiner et al. (2009) P. A. Schreiner, J. Reichenbacher, and M. C. Goodman, Astropart. Phys. 32, 61 (2009).
- Zatsepin and Kuzmin (1961) G. Zatsepin and V. Kuzmin, Sov. Phys. JETP 12 (1961).
- Agafonova et al. (2010) N. Agafonova et al. (OPERA Collaboration), Eur. Phys. J. C 67, 25 (2010).
- Olive et al. (2014) K. A. Olive et al. (Particle Data Group), Chin. Phys. C 38, 090001 (2014).
- Adamson et al. (2006) P. Adamson et al. (MINOS Collaboration), Phys. Rev. D 73, 072002 (2006).
- Michael et al. (2008) D. Michael et al. (MINOS Collaboration), Nucl. Instrum. Methods Phys. Res., Sect. A 596, 190 (2008).
- Fruhwirth (1987) R. Fruhwirth, Nucl. Instrum. Methods Phys. Res., Sect. A 262, 444 (1987).
- Fields (2006) T. Fields, MINOS Internal Note DocDB-1511 (2006).
- Blake (2005) A. Blake, FERMILAB-THESIS-2005-77, Ph.D. thesis, Cambridge University (2005).
- Agostinelli (2003) S. Agostinelli, Nucl. Instrum. Methods Phys. Res., Sect. A 506, 250 (2003).
- (20) D. Heck and T. Pierog, “Extensive air shower simulations with CORSIKA,” https://www.ikp.kit.edu/corsika/.
- Reichenbacher (2007) J. Reichenbacher, Proceedings of the 30th International Cosmic Ray Conference, Merida Mexico HE2.1, 668 (2007).
- Lipari and Stanev (1991) P. Lipari and T. Stanev, Phys. Rev. D 44, 3543 (1991).
- Matsuno et al. (1984) S. Matsuno et al., Phys. Rev. D 29, 1 (1984).
- Kasahara (1997) S. Kasahara, A Study of Cosmic Ray Composition in the Knee Region using Multiple-Muon Events in the Soudan 2 Detector, Ph.D. thesis, University of Minnesota (1997).
- Kasahara et al. (1997) S. Kasahara et al., Phys. Rev. D 55, 5282 (1997).