A possible Chandra and Hubble Space Telescope detection of extragalactic WHIM towards PG 1116+215
Abstract
We have analyzed Chandra LETG and XMM-Newton RGS spectra towards the quasar PG 1116+215, a sightline that is rendered particularly interesting by the HST detection of several O VI and H I broad Lyman- absorption lines that may be associated with the warm–hot intergalactic medium.
We performed a search for resonance K absorption lines from O VII and O VIII at the redshifts of the detected far–ultraviolet lines. We detected an absorption line in the Chandra spectra at 5.2 confidence level at wavelengths corresponding to O VIII K at (statistical followed by systematic error). This redshift is within 3 of that of a H I broad Lyman- of km/s (corresponding to a temperature of ) at . We have also analyzed the available XMM-Newton RGS data towards PG 1116+215. Unfortunately, the XMM-Newton data are not suitable to investigate this line because of instrumental features at the wavelenghts of interest. At the same redshift, the Chandra and XMM-Newton spectra have O VII K absorption line features of significance 1.5 and 1.8 , respectively.
We also analyzed the available SDSS spectroscopic galaxy survey data towards PG 1116+215 in the redshift range of interest. We found evidence for a galaxy filament that intersect the PG 1116+215 sightline and additional galaxy structures that may host WHIM. The H I BLA and the O VIII K absorbers are within a few Mpc of the filament (assuming that redshifts track Hubble flow distances) or consistent with gas accreting onto the filament from either direction relative to the sightline with velocities of a few km/s.
The combination of HST, Chandra, XMM-Newton and SDSS data indicates that we have likely detected a multi–temperature WHIM at towards PG 1116+215. The O VIII K absorption line indicates gas at high temperature, , with a total column density of order and a baryon overdensity for sightline lengths of Mpc. This detection highlights the importance of BLA absorption lines as possible signposts of high–temperature WHIM filaments.
1 Introduction: the search for missing baryons at low redshift
The intergalactic medium (IGM) contains the vast majority of the universe’s baryons at all redshifts (Shull et al., 2012, and references therein). At high redshift, the bulk of this mass is in the photoionized phase that gives rise to the Lyman- forest, but at lower redshifts a diffuse warm–hot intergalactic medium (WHIM) at temperatures is predicted to contain approximately 50% of the baryons in the universe (e.g. Davé et al., 2001; Cen & Ostriker, 1999). Absorption–line spectroscopy in the far ultraviolet (FUV) has proven a successful means for studying the IGM at low redshift, and a number of surveys have used space–based observations to place constraints on the baryonic content of its different phases (e.g., Danforth & Shull, 2008; Tripp et al., 2008; Tilton et al., 2012; Shull et al., 2012). Nonetheless, these surveys have detected only a fraction of the expected baryons. The detection of WHIM gas remains particularly incomplete, owing to the difficulty associated with detecting the broad Lyman- H I absorption (BLA) lines and highly ionized metal lines (such as K from O VII and O VIII) that are characteristic of diffuse gas at WHIM temperatures.
The limited resolution and effective area of the current generation of X-ray grating spectrometers makes the detection of X-ray absorption lines challenging. To date, there have been only a handful of reported detections of X–ray lines from the WHIM, typically from O VII and O VIII. These detections include absorption features toward the targets H 2356-309 (Buote et al., 2009; Fang et al., 2010), PKS 2155-304 (Fang et al., 2002, 2007; Yao et al., 2009), Mkn 421 (Nicastro et al., 2005; Rasmussen et al., 2007; Yao et al., 2012), Mkn 501 (Ren et al., 2014) and 1ES 1553+113 (Nicastro et al., 2013). Given the limited statistical significance of all X–ray lines detected to date, it is important to investigate additional sightlines and understand the correlation between UV and X–ray absorption lines.
In this paper we investigate the presence of X–ray absorption lines from the WHIM towards the source PG 1116+215, a quasar at . This sightline is well studied in the FUV (e.g., Sembach et al., 2004; Lehner et al., 2007; Danforth et al., 2010; Tilton et al., 2012) and it is rendered particularly interesting by the presence of several H I broad Lyman– absorption (BLA) lines and O VI absorption line systems at reported by Tilton et al. (2012) from Hubble Space Telescope (HST) STIS and COS data. In particular, the BLA at detected from HST data is one of the broadest H I lines in the Tilton et al. (2012) sample ( km/s), and it is indicative of gas at if the line width is purely thermal.
This paper is structured as follows. In Section 2 we describe the source PG 1116+215 and the available FUV data, in Sections 3 and 4 we describe the analsis of the Chandra and XMM-Newton data, in Section 5 we provide our interpretation of the X–ray and FUV results, and in Section 6 we present our conclusions. Throughout this paper we assume a standard CDM cosmology with and .
2 The sightline towards PG 1116+215
PG 1116+215 is a quasar at redshift . FUSE and HST FUV data were analyzed by Tilton et al. (2012), who detected several absorption lines from intervening gas towards the source. Among the absorption lines detected in the FUV, we are especially interested in following up those absorption–line systems that have the potential for associated X–ray lines, in particular the two K resonant lines from oxygen, O VII ( Å) and O VIII (doublet at a center wavelength of Å). The atomic data relevant to this paper are presented in Table 1. Oxygen is expected to be the most abundant element with atomic number in the interstellar medium, and O VII and O VIII are the most abundant oxygen ions in collisional ionization equilibrium at (i.e., the high–temperature end of the WHIM range, Mazzotta et al., 1998).
| Ion | Line Transition | Name | Wavelength (Å) | X–ray Energy (eV) | Osc. strength |
|---|---|---|---|---|---|
| H I | Lyman- | 1215.67⋆ | — | 0.416 | |
| O VI | 1037.6,1031.9 | — | 0.199 | ||
| O VII | K | 21.602 | 574.02 | 0.696 | |
| O VIII | K | 18.969⋆⋆ | 653.66 | 0.416 | |
| O VIII | K | 16.006⋆⋆⋆ | 0.7747 | 0.079 |
For this purpose, we select two classes of absorption–line systems towards PG 1116+215 among those detected by Tilton et al. (2012): O VI systems that have both lines in the doublet detected, and broad H I Lyman- absorption lines (BLA) with km/s. O VI systems are traditional signposts for the WHIM, since O VI is the most abundant ion with strong resonance lines in the FUV (e.g. Shull et al., 2012). It is clear that, for a single–temperature WHIM cloud in collisional ionization equilibrium (CIE), O VI and O VII will coexist in significant amounts only in a very narrow range of temperatures, and one does not expect virtually any O VIII at temperatures where O VI is present. Nonetheless, it is possible that WHIM clouds have a multi–temperature structure, as speculated by Shull et al. (2003), and therefore O VI is a useful indicator of WHIM at higher temperatures. BLA’s are also potential indicators of hot gas, with a thermal broadening of km/s indicating a temperature of . In this temperature range, we may in fact expect to find significant column densities of the O VII and O VIII ions. The FUV absorption lines that meet these criteria are listed in Table 2.
In particular, we note that the BLA has the highest Doppler parameter of the entire sample studied by Tilton et al. (2012). For this paper we have re-analyzed the STIS and COS data of that absorption feature using the latest version of the pipeline used in Tilton et al. (2012), which implements minor improvements in exposure coaddition and continuum placement. 111See http://casa.colorado.edu/ danforth/science/cos/costools.html for COS coaddition code. We used version 3.3 of coadd_x1d. Fitting a single Voigt component to the COS data, we obtain (or 20 km/s), km/s and . Fitting a single Voigt component to the STIS/E140M data we measure (or 12 km/s), km/s and . Tilton et al. (2012) reported z=0.09279 ( 15 km/s, or ), km/s and an equivalent width of Å, which corresponds to an H I column density of cm-2 (or ). If the Doppler parameter is purely thermal, a value of km/s corresponds to a temperature of K (or ); for the single Voigt component fit to the COS data, the temperature corresponding to the Doppler parameter is K (or ). It is worth noting that this BLA may have minor contamination from a weak foreground Galactic absorption line from C I 1329. Though the COS data contain no suggestions of an additional, narrower absorption component, the higher-resolution STIS data contain a narrow feature of low significance, possibly corresponding to a C I component. Simultaneously fitting this feature with an additional Voigt component alters the BLA fit slightly to z=0.0927143 ( 15 km/s), km/s, and . The potential impact of C I contamination therefore appears to be negligible for the purposes of this study. Because the re–analysis obtains results consistent with the original values from Tilton et al. (2012), we adopt those original values as listed in Table 2.
The X–ray spectra towards PG 1116+215 have been previously used to search for absorption lines. Fang et al. (2015) studied absorption lines from warm–hot gas in the Galaxy but did not investigate the systems that arise from the extragalactic WHIM. Yao et al. (2009) focused on selected O VI systems detected with earlier FUV data, including two systems at and which we also investigate in this paper, but did not analyze the system. Yao et al. (2010) stacked Chandra data of several bright AGNs, looked for lines at the redshift of bright nearby galaxies and likewise did not investigate lines at . Neither paper reported any positive identification of absorption lines from the extragalactic WHIM towards PG 1116+215. The prior knowledge on the redshift of potential O VII and O VIII systems that we have from the FUV data (Table 2) is essential to search for faint X–ray absorption lines. Given that we only seek to study lines at a known redshift, the statistical significance of detection can be simply defined as the ratio of the line flux and its 1- uncertainty, as discussed, for example, by Nicastro et al. (2013). In the case of blind searches, i.e., without a prior knowledge on the redshift, one needs to account for the number of independent detection opportunities available for a given transition, leading to a reduction in the significance of detection relative to the case of lines with a redshift prior (Nicastro et al., 2013).
3 Spectral analysis of X–ray data
In this paper we analyze the Chandra and XMM-Newton X–ray grating spectra of PG 1116+215. The Chandra HRC/LETG data provides a uniform coverage at all wavelengths of possible O VII and O VIII absorption lines of interest to this study. The XMM-Newton data can be used to study only some of these absorption lines, given a number of instrumental features that make several wavelength intervals of interest unavailable with the RGS spectrometer.
Spectral analysis was perfomed in XSPEC (version 12.8.2) in the wavelength range 17–26 Å where all relevant O VII and O VIII K lines from the systems listed in Table 2 are expected. For completeness, we also investigate absorption lines from the same ions. At the redshift of , the redshifted O VIII line position coincides with the O VII line. We therefore set the flux of the redshifted O VIII line to zero, and let the flux of the O VII line be free in the fit. The continuum was modelled with a power law in which both the normalization and the spectral index was allowed to vary to find the best–fit parameters and the significance of detection of the lines. Each line was parameterized with a Gaussian model that uses as parameter the total line flux (, in units of photons s-1 cm-2), redshift, line energy and line width (parameter of the Gaussian, in units of eV).
We use the Cash statistic as the fit statistic, which is appropriate for a data set of independent Poisson data points that may have bins with a low number of counts. We prefer this over rebinning the spectra, in order to retain a fixed bin width that matches the resolution of the Chandra data. The statistic is approximately distributed like a distribution with degrees of freedom, where is the number of datapoints and is the number of (interesting) fit parameters (Bonamente, 2013). To determine the 1- uncertainty in the flux of the lines and in the other free parameters we therefore vary each interesting parameter until , and use of this range as the 1- uncertainty, following the same procedure that applies to Gaussian datasets with as the fit statistic. In Section 4.3 we further discuss the effects of fitting the Chandra data using a variable bin size with a minimum of 25 counts per bin and the fit statistic.
3.1 Chandra
Chandra observed PG 1116+215 for a total of 88 ks of clean exposure time with the HRC/LETG spectrometer (observation ID 3145). Data reduction was performed in CIAO 4.7 using the standard processing pipeline (chandra_repro) that generates source spectra, background spectra and response files. The +1 and -1 order spectra were kept separate to better address the presence of spectral features in each order spectrum. The spectra were rebinned to a fixed bin size of 0.05 Å, roughly the spectral resolution of the instrument.
The redshifts of the lines were fixed at the values of the expected lines using the HST redshifts shown in Table 2. In the case of features, including the the absorber, we allowed the redshift to be free in the final analysis to allow for small adjustments around the expected value. In Section 4 we discuss the best–fit values of the redshifts for the detected features, and compare them with the HST a priori redshifts. Given the spectral resolution of LETG, we fixed the line width parameter of all lines to a fiducial value that corresponds to a width of 100 km/s, or eV, which is a characteristic value for the thermal broadening of lines from ions in the temperature range . The line width is significantly smaller than the intrinsic resolution of the LETG spectrometer, which is of order 1 eV for the wavelength range of interest. Small changes from the nominal value used of 0.2 eV have therefore negligible effect on the fit results. We address the source of systematic error associated with this assumption in our assessment of the significance of detection of the lines in Section 4.3.
| Redshift | Line ID | Doppler (km/s) | (mÅ) |
|---|---|---|---|
| 0.13373 | HI Lyman- (BLA) | ||
| 0.09279 | HI Lyman- (BLA) | ||
| 0.04123 | HI Lyman- (BLA) | ||
| 0.17340 | OVI 1032,1038 | ||
| 0.13848 | OVI 1032,1038 | ||
| 0.05927 | OVI 1032,1038 |
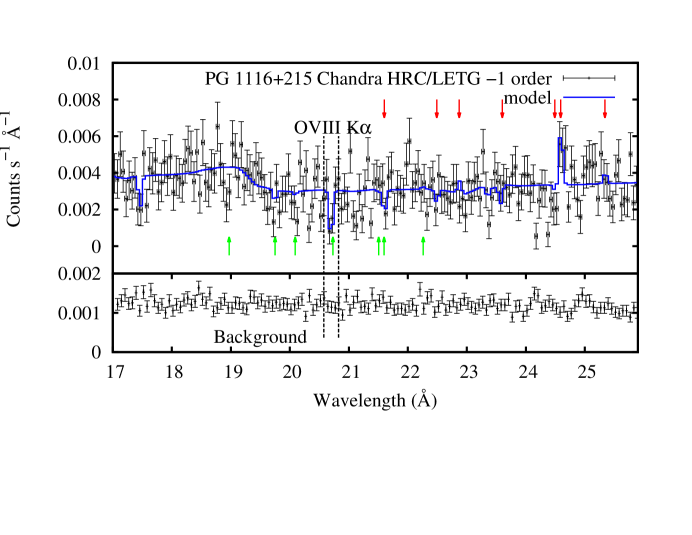
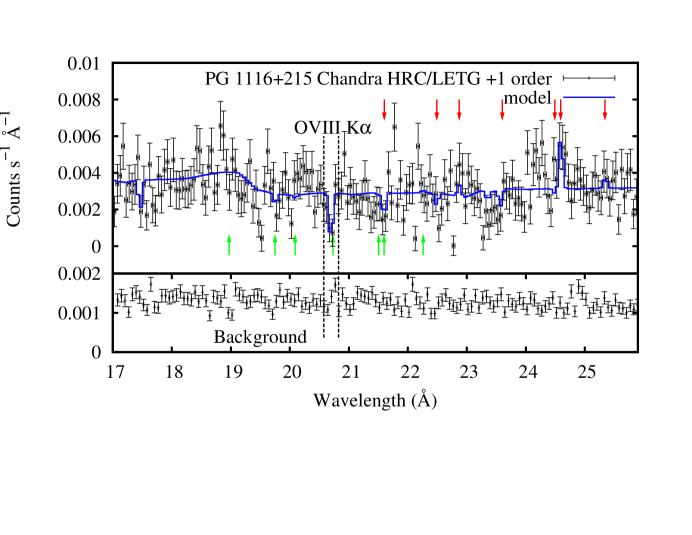
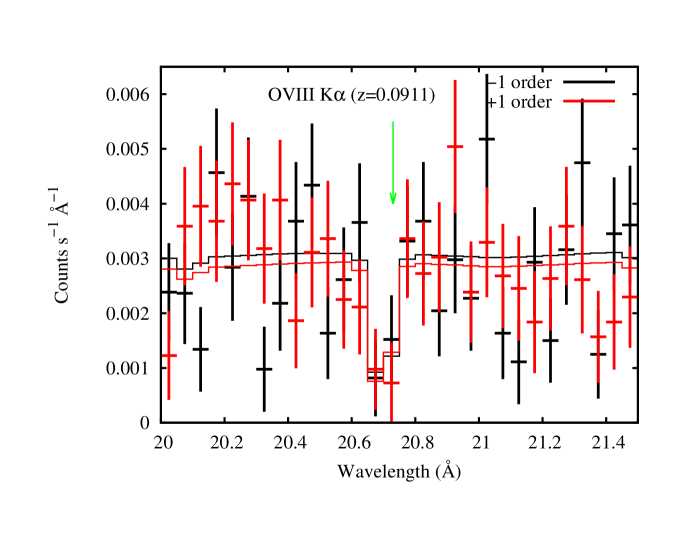
The Chandra spectra and the best–fit models are shown in Figure 1. The error bars shown in the spectrum are based on the Geherels approximation of the Poisson errors (Gehrels, 1986). The results of our fit are shown in Table 3. The best–fit statistic is for 346 degrees of freedom. The flux of PG 1116+215 at the wavelength of the line is measured as photons cm-2 s-1 Å-1 in the Chandra observation. The equivalent width of the lines are obtained from the relationship , where is the total line flux (see Table 3). In Table 3 we also report constraints on the equivalent widths of the lines. When the data indicate a positive normalization for the Gaussian line model, we report a 90% upper limit obtained as the equivalent width corresponding to a value of the line flux , where is the uncertainty in .
| Line ID | Redshift | Flux ( phot cm-2 s-1) | (S/N) | (mÅ) |
|---|---|---|---|---|
| O VII K | 0.0 | -1.9 | ||
| O VII K | 0.041 | - | -1.1 | |
| O VII K | 0.059 | +0.8 | ||
| O VII K | -1.5 | |||
| O VII K | 0.1337 | -0.4 | ||
| O VII K | 0.1385 | +3.5 | — | |
| O VII K | 0.1734 | 0.8 | ||
| O VIII K | 0.0 | -1.7 | ||
| O VIII K | 0.041 | -0.9 | ||
| O VIII K | 0.059 | -0.2 | ||
| O VIII K | -5.2 | |||
| O VIII K | 0.1337 | -0.2 | ||
| O VIII K | 0.1385 | 0.0 | — | — |
| O VIII K | 0.1734 | 0.2 |
3.2 XMM–Newton
XMM-Newton observed PG 1116+215 in four separate visits (observations 0201940101, 0554380101, 0554380201 and 0554380301) for a total of 372 ks of clean exposure. Reduction of the data was performed with the SAS software, using the rgsproc pipeline and the calibration data current as of June 2015. The products of the reduction are order averaged spectra for each observation and the matching background spectra and response matrices.
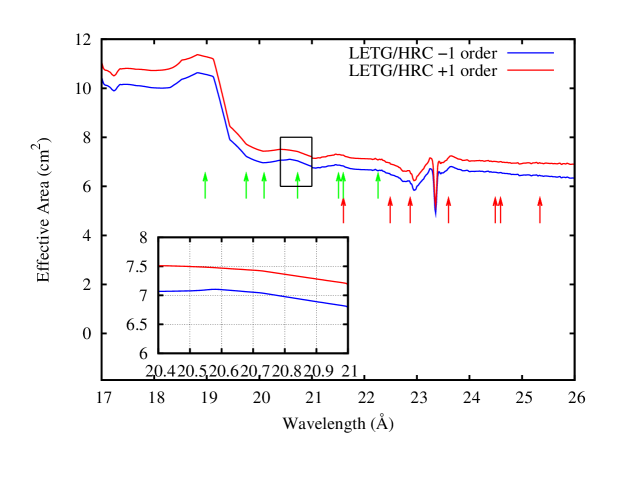
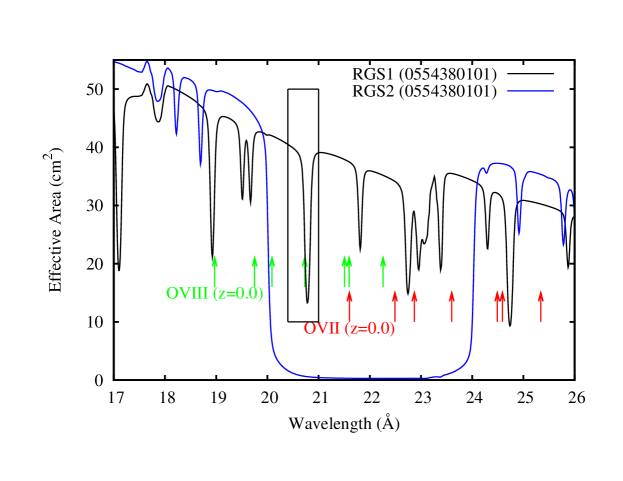
Each spectrum was rebinned to a bin size of 0.05 Å, approximately matching the RGS resolution in the wavelength range of interest (17-26 Å). The bin size is therefore the same as for the Chandra spectra. We followed the same method of analysis of the spectra as for the Chandra data. The only difference in the analysis is the fact that several spectral regions corresponding to the lines of Table 2 are unavailable with RGS. Figure 2 shows the Chandra HRC/LETG and the XMM-Newton RGS effective areas. The main instrumental feature is the lack of effective area of RGS2 between 20–24 Å, due to the failure of one of the CCD’s in the focal plane of RGS2. RGS1 has also a number of instrumental edges that prevent an accurate determination of those lines that follow near sharp gradients in the effective areas. In particular, the O VIII absorption line detected with Chandra near Å falls at the edge of a sharp intrumental feature of RGS1, and therefore we cannot reliably address the presence of such line using the RGS data.
Results of our RGS spectral analysis are summarized in Table 4, where we have used a dash in correspondence of those lines that cannot be probed because of these instrumental features. The four order RGS1 spectra were fit simultaneously to the same model used for the Chandra data, and so were the four order RGS2 spectra; normalizations of the continua was left free among the observations to allow for flux variations among the different spectra. The goodness of fit was measured using the Cash statistic as for 650 degrees of freedom for the RGS1 spectra, and for 376 degrees of freedom for the RGS2 spectra.
| Line ID | Redshift | RGS1 | RGS2 | ||||
| Flux | (S/N) | (mÅ) | Flux | (S/N) | (mÅ) | ||
| O VII | 0.0 | -1.5 | — | — | — | ||
| O VII | 0.041 | - | -0.4 | — | — | — | |
| O VII | 0.059 | — | — | — | — | — | — |
| O VII | 0.0911 | -1.8 | — | — | — | ||
| O VII | 0.1337 | -1.0 | — | — | |||
| O VII | 0.1385 | — | — | — | -0.6 | ||
| O VII | 0.1734 | -0.5 | -0.3 | ||||
| O VIII | 0.0 | — | — | — | -0.2 | ||
| O VIII | 0.041 | — | — | — | -0.8 | ||
| O VIII | 0.059 | -0.5 | — | — | — | ||
| O VIII | 0.0911 | — | — | — | — | — | — |
| O VIII | 0.1337 | 0.0 | — | — | — | ||
| O VIII | 0.1385 | 0.0 | — | — | — | — | — |
| O VIII | 0.1734 | -1.0 | — | — | — | ||
4 Results of the spectral analysis
In this Section we provide a detailed description of the two features that were detected at confidence in the fixed–redshift search, namely the absorption line at Å (Sec. 4.1) and a possible emission line at Å (Sec. 4.2). We also provide an analysis of sources of systematic uncertainty in the detection of the absorption line at Å in Sec.4.3.
4.1 Absorption line at Å
The strongest feature detected in the Chandra data at a priori FUV wavelengths is an absorption line at Å, which corresponds to that of K absorption from O VIII at . The nominal significance of detection for this line is 5.2 , and the feature is clearly visible in each of the order Chandra grating spectra (Figure 1). We do not detect significant absorption lines consistent with O VII or O VIII K originating from other a priori FUV redshifts. As we discussed in Section 3.2, this feature cannot be measured accurately by XMM-Newton.
The Tilton et al. (2012) BLA absorption line has a measured redshift of , which is confirmed by the re–analysis of the HST data presented in Section 2. In the initial analysis of the spectra we had fixed the redshift of the Chandra absorption line at this value and obtained a line flux of phot cm-2 s-1, for a best–fit statistic of ( for one additional d.o.f. relative to the fit with variable redshift). In that case, the absorption line was detected at a confidence level corresponding to , instead of for a variable redshift. In the final analysis we preferred to use a variable redshift, to account for possible sources of systematic errors in the determination of the redshift and a possible physical off–set between the H I and O VIII lines. We also measured the redshift separately from the and order LETG spectra following the same fitting method as for the combined observations. The order spectrum measures and the order spectrum measures , i.e., both spectra have a line shift that is consistent with the value of measured from the joint analysis of the two spectra.
A significant source of systematic error in the measurement of the Chandra redshift is the accuracy of the wavelength scale. The wavelength scale of the LETG/HRC detector is known to have errors of up to 0.05 Å, with an rms uncertainty of order 0.01 Å. 222See http://cxc.cfa.harvard.edu/cal/letg/Corrlam/ This rms uncertainty corresponds to a redshift error of approximately . Adopting this source of systematic error, our measurement of becomes consistent with the HST measurement of at the level. The agreement in the measurement of the line shift between the order spectra suggests however that the difference between the X–ray and FUV redshifts may be real, rather than associated with an uncertainty of the wavelength scale of the Chandra detector. Such difference may result from a supra–thermal velocity structure in the X–ray absorber, as discussed in Section 5, where we provide our interpretation of this absorption lines system and the temperature constraints obtained from the Chandra and HST measurements.
Our choice to set the redshift of the putative O VIII K as a free parameter in the final analysis of the Chandra data warrants a discussion of the significance of detection of this line. The nominal significance of detection, obtained as the ratio of the best–fit value and the 1- error bar and allowing a free redshift, is 5.2 . This absorption feature was detected at significance using the fixed redshift from FUV data (see Section 3.1); had such fixed–redshift analysis not provided a significant detection of the feature, this absorption line would have gone undetected by our analysis. The difference between the best–fit redshift of and the fixed FUV redshift of corresponds to a velocity difference of km/s. Peculiar velocities of few km/s are reasonable for large–scale unvirialized structures such as WHIM filaments, i.e., they may be due to accretion or shocks. The use of a free redshift in the analysis can therefore be viewed as a means for obtaining the best possible estimate of line parameters, while retaining a resonable physical association with the fixed redshift used in the line search.
A more conservative approach towards determining the statistical significance of this line is to account for the total redshift path length of the line search. The redshift range of our search can be defined as fourteen redshift intervals of size around the O VII and O VIII wavelengths of Table 2, where is the statistical plus systematic error, estimated at Å according to the values of Table 3 and the systematic errors in Section 4.3. In so doing, we account for the prior redshift information from FUV data while allowing adjustments to the X–ray redshift to account for reasonable instrumental or physical redshift differences. We define the number of independent detection opportunities within that path length as
| (1) |
where is the rest wavelength on the line of interest and the resolution of the spectrometer (e.g., the FWHM of the line–spread function, Nicastro et al., 2013). Using the atomic parameters in Table 1 and a resolution of 0.05 Å, there are approximately 20 independent opportunities in our search space for detecting an O VIII K absorption line and 23 opportunities for O VII K, i.e., 43 independent opportunities to detect any one of the fourteen possible absorption lines of interest. If we approximate the nominal probability of exceeding for a Gaussian distribution as (this value is an only an approximation, due to uncertainties in the numerical integration of the tail of the Gaussian function), the corrected null hypothesis probability becomes , which corresponds to the probability of exceeding the mean of a Gaussian distribution by . The detection of the putative O VIII K line therefore remains very significant even if we account somewhat conservatively for the entire redshift path of the search.
4.2 Emission line feature at Å
The only other spectral feature detected at a significance is an emission line near Å in the Chandra data, corresponding to an O VII K line at (Table 3). At that redshift Tilton et al. (2012) detected both components of an O VI absorption doublet (Table 2). Using a free–redshift fit to the Chandra data for this line, we obtain line parameters of and , i.e., a less than 1- redshift deviation from the HST redshift. The free–redshift fit for this line results in a 3.4 significance of detection, similar to that in the fixed–redshift analysis of Table 3. The RGS2 detector is the only XMM-Newton detector that can accurately probe this line, and the RGS2 does not show a clear evidence of an emission line at that redshift (see Table 4).
To determine whether the flux difference between the Chandra and XMM-Newton data for this feature is statistically significant, we re–measure the line fluxes using as the fit statistic with a minimum of 25 counts per bin, so that Gaussian statistics apply (the fluxes in Tables 3 and 4 were obtained using Poisson statistics). We obtain a Chandra flux of phot cm-2 s-1 and an XMM-Newton flux of phot cm-2 s-1, for a difference of phot cm-2 s-1. This is a 3.3 deviation from the null hypothesis that the two fluxes are identical, for a null hypothesis probability of approximately 0.05%. We conclude that there is a statistically significant difference between the fluxes measured by Chandra and XMM-Newton.
The Chandra emission line may be a transient feature, since the XMM-Newton and Chandra observations were taken at different times. Such putative transient emission line would have to be associated with a region of very small size, such that its high density can produce the narrow emission line and have sufficiently low O VII column density as to be unable to produce absorption in the PG 1116+215 spectrum; these properties are not those of the WHIM, which is a diffuse and low–density medium. Moreover, the Chandra spectrometer is slitless and only sources with an angular extent smaller than the PSF of the telescope (of order 1 arcsec) will show a high–resolution spectrum. Therefore any emission line source of a size larger than 1 arcsec would not have been detectable with LETG. It is also possible that this feature is an emission line at the redshift of the AGN, . At this redshift, a wavelength of Å corresponds to a rest wavelength of Å, which in fact corresponds to a Lyman- resonance line from N VII (e.g. Verner et al., 1996). However, a stronger N VII Lyman- emission line ( Å) would be expected at Å, but the Chandra and XMM-Newton data do not show evidence of an emission line at that wavelength. Given the limited significance of detection and the inconsistency between Chandra and XMM-Newton, additional data at this redshift are needed before providing a conclusive statement as to the origin of this putative transient O VII emission line at .
It is also possible that the Chandra emission line feature is simply due to a Poisson fluctuation. Our method of analysis in fact searches for absorption lines in selected wavelength ranges and we have no a priori reason to expect an emission line, given the physical parameters of the WHIM under investigation (low density and large size), i.e., we cannot use a priori information on the redshift. In the absence of such prior redshift knowledge, the probability of detecting an emission feature of a given significance due to Poisson fluctuations depends on the total redshift path length of the search. Using Equation 1, a fiducial wavelength of 20 Å and a resolution of 0.05 Å, there are approximately 40 independent detection opportunities for an emission line in our search space. Since there is a nominal probability of to exceed for a Gaussian distribution, the corrected null–hypothesis probability becomes , or 2.4%, which corresponds to the probability of exceeding the mean of a Gaussian distribution by . There is therefore a non–negligible probability of a chance fluctuation that yields such an emission line feature in our search.
We conclude that this emission line feature in the Chandra data is either a narrow transient emission line that is not associated with the WHIM, or it is due to a Poisson fluctuation. We therefore do not further consider this spectral feature in this paper.
4.3 Systematics
The putative O VIII K absorption line at is the strongest spectral feature detected in our spectra. In Section 4 we have already addressed the systematics in the measurement of the redshift associated with the determination of the Chandra wavelength scale. To address the robustness of this detection, we further performed a set of tests on the data and the method of analysis used to obtain this result. They consist of the following: (1) re–analysis of the data using binned data with a minimum of 25 counts, following a more traditional method of analysis that uses as the fit statistic (e.g. Yao et al., 2010; Fang et al., 2015); (2) re–analysis using different background levels, to assess the dependence of the significance of detection on the background; (3) use of different values of the line width parameter to study its effect of the line detection.
4.3.1 Fit with spectra rebinned to 25 counts
For the analysis with a minimum of 25 counts per bin, we grouped the Chandra data with the grppha FTOOL software, and re–fitted the data in XSPEC using as the fit statistic. The best–fit statistic was for 245 degrees of freedom (), which corresponds to a null hypothesis probability of 42.7%. The best–fit parameters of the continuum in the 17-26 Å band are (power–law index) and (normalization, in XSPEC units), which are indistinguishable from those obtained from the fit statistic method ( and ). For the significance of detection of the O VIII K absorption line, we find a redshift of and , for a significance of detection 3.3 .
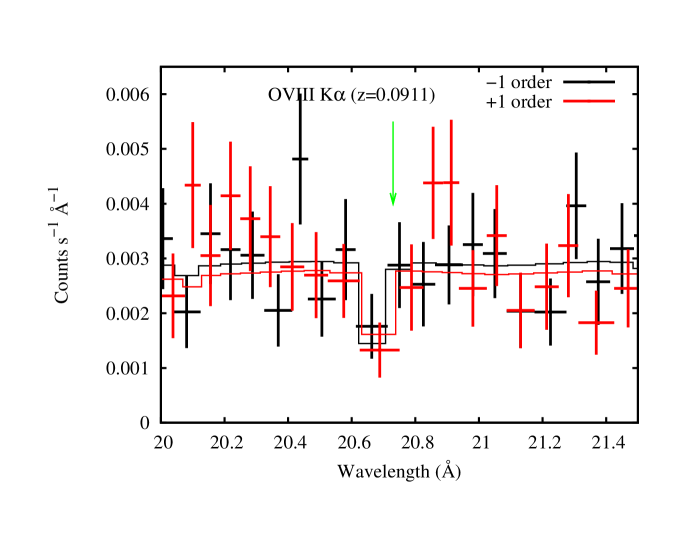
The difference in the significance of detection between the two methods of analysis can be explained with the differences in the spectral binning. Each of the 0.05 Å width bins contain significantly less than 25 counts, and therefore the two fitting methods ( fit statistic with fixed bin width and statistic with a minimum of 25 counts) are not equivalent. A comparison of the spectral bins used in the two analysis is shown in Figure 3. The effect of rebinning to achieve a minimum of 25 counts is clear, with the bins being significantly wider than in the fixed–width Poisson fit method. Some of the wider bins are an average of regions of continuum and regions where the absorption line is present, and this limits both the ability to identify the line position (or redshift) and its depth. Even with these limitations, the O VIII line is detected at confidence level. We conclude that the fixed bin–width method of Table 3 provides a more accurate method of measuring the absorption line, while the 25–count bin method is still able to confirm the detection. The lower significance of detection with the latter method is clearly attributed to limitations in the ability to measure the absorption line parameters due to the width of the bins.
4.3.2 Background analysis
We address the effect of the background on the detection of the line by rescaling the nominal background by %, to account for possible systematics of the HRC detector. We perform this test by increasing and decreasing the background spectra by 10%, and re–fit the data to the same model as described in the previous section. The effect of a background change by % is negligible: the best–fit statistic is virtually unchanged ( for both cases), the best–fit redshift value remains the same as that in Table 3, and the best–fit normalization becomes (for -10% background level) and (for +10% background level), both negligible changes ( %) relative to the nominal background.
We also examine whether there are anomalous fluctuations in the background at the wavelengths of the O VIII absorption line. In Figure 1 we show the background spectra for our Chandra LETG observations. The background is nearly constant across the wavelength range of interest, and there are no statistically significant fluctuations from the average background level at the wavelength of the O VIII absorption line (marked by the fourth green arrow from the left and highlighted by the dashed lines).
We conclude that the background has a negligible effect on the significance of detection of the O VIII absorption line.
4.3.3 Effect of the line width parameter
The significance of detection of the line is likewise insensitive to the parameter , given that the thermal broadening of plasma at is significantly smaller than the resolution of the Chandra LETG data. The width of the Gaussian line profile is proportional to the parameter via the approximation of , where is the energy of the line and is the speed of light. For the observed O VIII K line, a value of km/s corresponds to a line broadening of approximately eV.
First we changed the fixed value of the width parameter to eV and eV (corresponding to a change of % relative to the nominal value of ), and re–fitted the spectra. The best–fit statistic was unaffected ( for both cases), the best–fit redshifts and normalizations remained the same as those in Table 3. We also used a -function model for each of the lines and repeated the fit. The best–fit value of the parameters, their uncertainties and the minimum fit statistic were again virtually identical to those obtained with the nominal Gaussian models for the lines.
In an attempt to determine observational constraints on the line width parameter from the Chandra data, we also repeated the fits of Table 3 with a Gaussian model of variable . The best–fit model has a goodness of fit statistic for 345 degrees of freedom, for a decrease by using an additional free parameter. This reduction in the statistic is not statistically significant. We find a best–fit value of eV and a normalization of , for a significance of detection of , i.e., the K lines remains statistically significant even when the width of the Gaussian is a free parameter. The range of allowed widths for the Gaussian line profile corresponds to km/s and it is therefore consistent with a substantial amount of non–thermal broadening (the thermal broadening of a 0.2 keV O VIII line is 50 km/s).
The fact that the fit statistic changes by , relative to the nominal value of km/s, for values in the range km/s indicates that the Chandra data are insensitive to changes in the Doppler parameter and that the significance of detection of the O VIII absorption line is unaffected by changes to this parameter.
5 Interpretation
In this section we discuss possible interpretations for the absorption line at Å, tentatively identified as K from O VIII at . First we constrain the physical parameters of the absorber in Section 5.1, then we analyze the presence of the associated K line in Section 5.2 and finally we discuss the absorber’s location in relation to known galaxy structures in Section 5.3.
5.1 Column density and temperature of the O VIII absorber
The equivalent width of the O VIII K line is mÅ (Table 3). For an optically thin absorber, the rest–frame equivalent width and the column density (in ) are related by
| (2) |
where is the oscillator strength of the O VIII K line, the equivalent width in Å and Å is the rest–frame wavelength (e.g. Verner et al., 1996). Equation 2 gives a column density of cm-2.
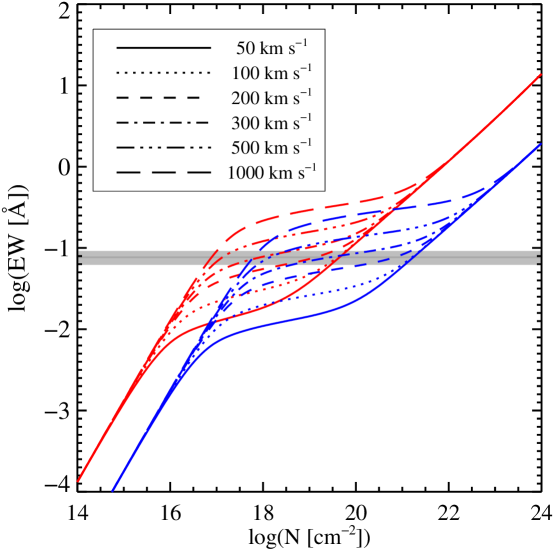
Since the equivalent width of the line is larger than the thermal broadening (6 mÅ for km/s), we must examine the possibility of saturation of the line as function of the parameter. The curves of growth for the O VIII K line reported in Figure 4 clearly show that, for a measured equivalent width of mÅ, an O VIII K absorption line is optically thin only for values km/s and it becomes increasingly saturated for lower values of . In Table 5 we report the measurement of the O VIII column density as function of and the estimates for the equivalent width of the associated O VIII K line, based on the curves of growth of Figure 4. Constraints on the O VIII K line are discussed in Section 5.2.
| b (km/s) | K (mÅ) | |
|---|---|---|
| 50 | ||
| 100 | ||
| 200 | ||
| 300 | ||
| 500 | ||
| 1000 |
In Section 4.3.3 we have shown that the LETG data are largely insensitive to the width of the absorption line and the data are consistent with a wide range of parameters that includes substantial non–thermal broadening. To estimate more accurately the line profile (including the parameter) and column density of the O VIII K line we make use of the SPEX software package (Kaastra et al., 1996), which has available a collisional ionization equilibrium model that accounts for plasma temperature, ionization fractions, column densities, line profiles, absorption edges and thermal/non–thermal broadening in a consistent way. For this purpose, we perform the following fits to the LETG spectra between 17-25 Å, to include the O VIII K and K and the O VII K lines. Since the O VIII K is the only line we detect in our spectra, we consider a single–temperature CIE plasma in which oxygen is the only heavy element. First we allow only thermal broadening of the lines and let the temperature of the plasma and the redshift as free parameters. Then we repeat the same fits allowing for non–thermal broadening of the lines (the parameter, see Table 6). We used the combined order spectrum, thus the fewer degrees of freedom compared to the earlier fits. We assumed a solar abundance of elements to convert the measured O VIII column density to the total . If a different abundance of oxygen relative to solar were used, e.g., if an abundance of solar, the column density would increase by a corresponding amount, e.g., by a factor of 10 for solar. The column density of O VIII is unaffected by the choice of metal abundance.
| Fit | kT (keV) | (km/s) | (cm-2) | (cm-2) | (d.o.f.) |
|---|---|---|---|---|---|
| 1 | 0 (fixed) | 168.2 (156) | |||
| 2 | 165.4 (155) |
An F–test for the significance of the additional component in the fit with free relative to the one with fixed returns a value of . This value of the statistic has a null hypothesis probability of approximately 90%, i.e., there is only a 10% chance that the addition of the free parameter is not justified. The SPEX fits therefore indicate that the data has a slight preference for an O VIII K line with a substantial amount of non–thermal broadening rather than a value of km/s; this analysis is compatible with the phenomenological XSPEC fits presented in Section 4.3.3. This conclusion is borne out by the large value of and by the fact that, in the fit with thermal broadening alone, the best–fit temperature is shifted to a larger value presumably to accommodate a larger thermal broadening for the O VIII K line. If the line is indeed broadened by km/s, the line remains optically thin, as indicated by the analysis of the curves of growth. In this case, the O VIII column density obtained by the SPEX fits (Table 6) are consistent with the value obtained from Eq. 2, i.e., the line is not saturated. The fit with a narrow line broadening results in a very large total column density that cannot be easily explained using a WHIM filament model, i.e., such large column density would be a typical column density associated with a cluster (see Sec. 5.3). A significant broadening of the line is therefore a more plausible scenario also because of its lower column density.
The data also place a lower limit to the temperature, in particular due to the available data at the wavelengths of the O VII K line. Using a 90% confidence interval, the temperature is constrained to keV, or , from the fit with variable broadening parameter. At this temperature, the thermal broadening of O VIII lines corresponds to km/s, therefore non–thermal broadening dominates if the temperature of the absorber is near this lower limit. Temperature constraints are independent of the overall abundance of oxygen relative to solar. As shown in Table 3 and Table 4, Chandra and XMM-Newton have weak absorption features at the wavelength of the redshifted O VII K (respectively 1.5 and 1.8 significance). Deeper observations may result in statistically significant detections of these lines that would be very effective in constraining more accurately the temperature of this absorption line system.
The Doppler parameter of the H I BLA corresponds to a lower temperature than this value, since the largest estimate of corresponds to , as discussed in Section 2. Therefore the H I BLA and the O VIII K absorption lines do not originate from an isothermal medium. In Section 4 we have shown that the HST and Chandra redshifts are within 3 of each other. Assuming that the centroid shift of the X–ray and FUV lines are purely due to the Hubble expansion, the redshift difference indicates a Mpc line–of–sight separation between the two absorbers. We examine this scenario in Section 5.3.
5.2 Constraints on the O VIII K absorption line
The large values for the column density of the putative O VIII K absorption line suggest that the associated K line may be detectable with the available Chandra and XMM-Newton data. Both Chandra LETG and XMM-Newton RGS1 have significant effective area at the wavelength of the redshifted O VIII K line ( Å). In particular, the line falls in a wavelength range where RGS1 does not have any of the detector artifacts that prevented the investigation of the K line with this instrument.
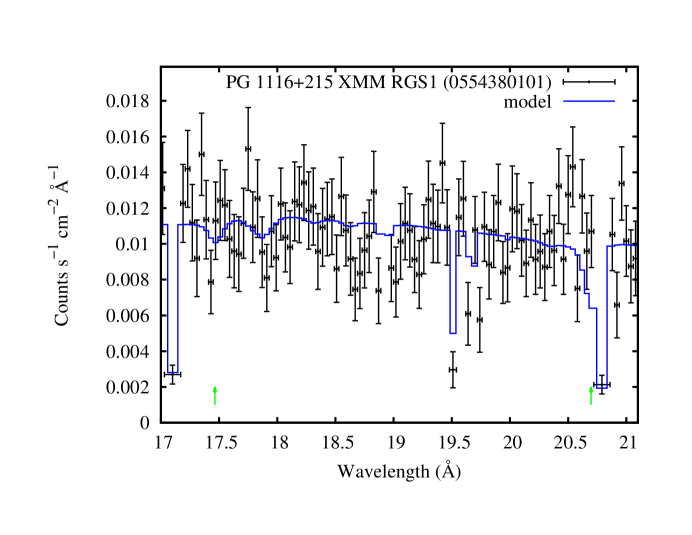
To determine the flux associated with O VIII K absorption at , we repeated the same spectral fits with the addition of a K Gaussian absorption line model at the same redshift as the K line, with a variable normalization. The results of these fits, the flux of the source at that wavelength and the resulting equivalent width of the line are reported in Table 7. For Chandra, the goodness of fit is for 345 degrees of freedom, for a decrease by using one additional model parameter. For XMM-Newton RGS1, the goodness of fit is for 649 degrees of freedom, for a decrease by using one additional model parameter. For XMM-Newton RGS2, the goodness of fit is for 375 degrees of freedom, for a decrease by using one additional model parameter. Neither instrument records a significant detection of the line, although the significance of the normalization of the Gaussian model in the Chandra data is suggestive (see also Fig. 1). In Figure 5 we show the RGS spectrum of one of the XMM-Newton observations using the same absorption model as the free- fit to the Chandra data of Table 6. The spectrum shows that the spectral region of the O VIII K line is near a strong detector absorption edge that prevented an accurate measurement for this line and that the non–detection of the K line is consistent with the model from the Chandra data. The Chandra observation took place at a time when the PG 1116+215 soft X–ray flux was more than twice that in any of the XMM-Newton observations. This is a possible reason why the deeper XMM-Newton observations were not able to provide a detection of the K line.
| K | K (mÅ) | |||
|---|---|---|---|---|
| ( phot cm-2 s-1) | ( phot cm-2 s) | Measurement | 99% Upper Limit | |
| LETG | 66.2 | |||
| RGS1 | 36.9 | |||
| RGS2 | 33.8 | |||
The curves of growth reported in Figure 4 were used to predict the equivalent width for the K line from the measured equivalent width for the K line. Constraints on the K equivalent widths from LETG, RGS1 and RGS2 are shown in Table 7. The 99% confidence upper limits from our data are consistent with the equivalent widths expectations based on the K measurements reported in Table 5 for most values of the parameter. In particular, the K constraints are in agreement with the expectations for both low values of the parameter ( km/s), and for large values ( km/s). The scenario of km/s is problematic because of the high column density implications, as discussed in Sec. 5.1. A value of km/s explains the non–detection of K and implies a lower – i.e., more reasonable – columnn density for the K absorber.
We conclude that the current data do not have sufficient depth to achieve a significant detection of the O VIII K line, regardless of the degree of saturation of the K line, and that the K constraints suggest the presence of a substantial amount of non–thermal broadening ( km/s) for the O VIII gas.
5.3 Association with galaxies and filaments
5.3.1 Galactic structures
We analyzed the available SDSS spectroscopy data in a region of Mpc2 around PG 1116+215. The analysis consists in the identification and characterization of possible galaxy structures using the methods described in Tempel et al. (2014a). The SDSS spectroscopic data at this redshift has an estimated completeness of 20% for galaxies at magnitudes and therefore our analysis is hampered by such limitation. The nearest galaxy to the sightline is more than 1 Mpc away from the sightline, therefore a galactic origin for the FUV and X–ray absorption lines is unlikely.
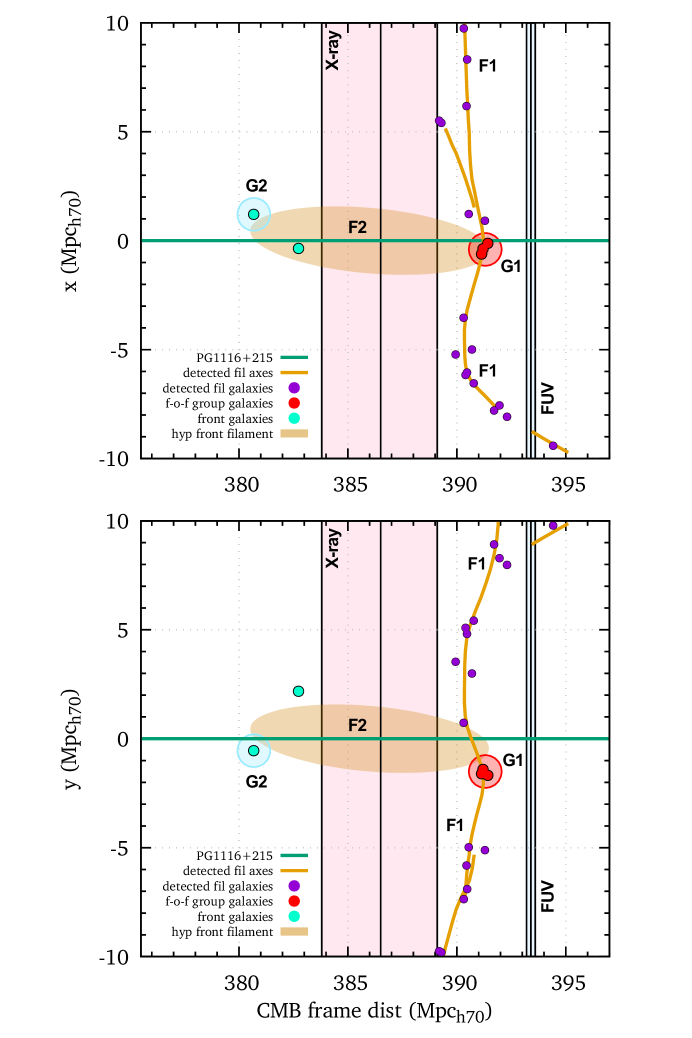
The analysis of the large–scale SDSS data reveals a significant filament of galaxies (F1, Fig. 6) that extends nearly perpendicular to the sight line (i.e., the filament is primarily in the plane of the sky). Simulations of large–scale structure formation predict that filaments contain most of the WHIM (Cui et al., 2012; Nevalainen et al., 2015). This filament intersects the sightline towards PG 1116+215 and a three–galaxy group (G1). The redshifts of the galaxies that form this filament are between the redshift of the FUV line and that of the O VIII K line, indicating that in principle both absorption lines may originate from WHIM gas associated with this filament, provided that the absorbing gas moves with a velocity of up to a few km/s towards this filament, from either side relative to our observing position. The current data do not permit an accurate determination of the size of the filament in the direction of the sightline towards PG 1116+215. The fact that the filament lies in the diretion perpendicular to this sight line would seem to indicate that its extent along the sight line may be limited to a few Mpc.
We also find that three galaxies identified by Tripp et al. (1998) form a galaxy group, according to a friend–of–friends algorithm (Tempel et al., 2014b). The center of the group (G1, see Fig. 6) lies at a distance of Mpc from the sightline towards PG 1116+215. Galaxy groups with a membership of a few galaxies are not expected to have a soft X–ray halo that extends to such large distances. In principle, this three–galaxy group could be part of a more massive cluster, if many of its members have not been identified yet (e.g., due to the incompleteness of the available SDSS data). To test this scenario, we analyzed the available X–ray data at this location using publicly available ROSAT PSPC data that had PG 1116+215 at its aimpoint (25 ks of exposure, observation ID rp700228n00). This galaxy group is too distant from PG 1116+215 to be covered by XMM-Newton and Chandra observations of the quasar. At the location of this group, however, PSPC detects no X–ray counts above the local background. We conclude that it is unlikely that any halo of hot gas associated with a small group at a distance of 2 Mpc is responsible for the detected O VIII K absorption.
The SDSS data further identify a galaxy at a projected distance of 1.3 Mpc from the PG 1116+215 sight–line and approximately 5 Mpc in front of the X–ray absorber. This galaxy, according to McConnachie et al. (2009), is part of a compact galaxy group (Hickson–type, or HCG) with 4 galaxies identified through photometric redshifts (the McConnachie et al. 2009 identifier for this group is SDSSCGB21597, G2 in Fig. 6). The presence of a galaxy group in front of the X–ray absorber and another group nearly behind it suggests a scenario of a possible WHIM filament (F2, see Fig. 6) extending between the two, with a distance of 10 Mpc almost entirely along the sightline. This scenario would be the natural explanation for the broadening of the O VIII K absorption line reported in this paper. The Hubble flow velocity difference at the ends of a 7 Mpc filament is 500 km/s, consistent with the observations. In this scenario we have to assume a homogeneous distribution of WHIM over a pathlength of 7 Mpc. This assumption, however, cannot be tested with the current data.
5.3.2 Interpretation
The values from Table 6 can be used to estimate the density of the WHIM required to create the observed absorption line. Using the range of Mpc suggested by the SDSS data for filaments along the sightline, the following relationship can be used to determine the WHIM density,
| (3) |
where we have used g, (Planck Collaboration et al., 2015), H atoms cm-3 and a somewhat conservative estimate of cm-2. Equation 3 therefore measures for filament lengths in the range Mpc. For filament lengths of Mpc (e.g., the possible filament F2), the temperature and density are therefore consistent with the high–density and high–temperature end of the WHIM that is expected to provide O VII and O VIII absorption lines. If the absorbing plasma is more concentrated or resides in a filament with a 1–2 Mpc extent along the sight line (e.g., filament F1), the larger estimate of applies and the absorbing gas is consistent with a rare form of WHIM in the borderline between the intergalactic gas and the gas bound to galaxy clusters (see Fig. 6 of Branchini et al., 2009). Although the available X–ray data rule out the presence of a massive cluster at this location, a dense and hot WHIM in filament F1 is still a possible explanation for the detected O VIII line, e.g., the high density may be related to accretion of gas towards group G1. Additional optical data in this area will overcome the incompleteness of the available SDSS coverage and improve our estimates of the geometry and extent along the sightline of the filament. An estimate of the total column density of hydrogen associated with the H I BLA detected by Tilton et al. (2012) relies on an estimate of the temperature of the H I absorber. If we assume a temperature of , consistent with the Doppler parameter of the BLA, then the H I ionization fraction in CIE is (Gnat & Sternberg, 2007), and the total column density associated with the BLA becomes . This column is sufficiently lower than that associated with the O VIII K line, so that the estimates of Eq. 3 are not significantly affected.
6 Discussion and conclusions
In this paper we have analyzed the Chandra and XMM-Newton X–ray grating spectra towards PG 1116+215, a quasar at with several intervening FUV absorption lines detected in the HST data (Tilton et al., 2012) that may be related to the WHIM. We use the redshift of the FUV detections as priors for the search of O VII and O VIII K lines.
The strongest feature we have detected is an absorption line at 20.7 Å in the Chandra spectra that we tentatively identify as a K resonance line from O VIII at . This absorption line has a nominal statistical significance of , and corresponds (within of the Chandra redshift measurements) to a very broad H I Lyman- (BLA) absorption line at present in the HST STIS and COS data. The O VIII K detection and the Doppler value of the H I BLA indicate that the absorbing plasma is likely in a multi–temperature state. We conclude that we have a possible detection of a WHIM system towards PG 1116+215 at that features H I BLA (at ) and O VIII K absorption (). The temperature difference between the two phases is relatively small, if the Doppler parameter of the BLA is an accurate indicator of its temperature. The energy required to heat plasma to approximately may be provided by shocks associated with the large–scale structure formation processes.
The available SDSS data provide evidence of galaxy structures towards PG 1116+215 near the redshift of the Chandra and HST absorption lines. In particular, we have identified a large–scale filament that intersects the PG 1116+215 sightline. The putative WHIM associated with this filamente can in principle be associated with these absorption lines, assuming that the absorbers are moving towards the filament with speeds of a few 100 km/s. We have also identified two galaxy groups that are located directly in front and behind the X–ray absorber. The available SDSS data are however not able to determine whether there is a filament between them that may be responsible for the O VIII absorption line. Deeper spectroscopic data to identify additional galaxies in the field is necessary before we can make a more conclusive association between the detected absorption lines and a specific galaxy structure.
The limited significance of detection of the putative O VIII absorption line at reported in this paper requires a confirmation with additional data before its presence and the physical state of the absorbing plasma can be determined accurately. Unfortunately, the available XMM-Newton data towards PG 1116+215 cannot be used effectively to address the presence of this O VIII absorption line, since at the wavelengths of this line RGS2 has no effective area, and RGS1 has a significant drop in its efficiency due to an instrumental feature. Additional observations will also address the presence of O VII K lines. The available Chandra and XMM-Newton data in fact have absorption line features of respectively 1.5 and 1.8 at the wavelength of the O VII K line that are consistent with a significant column density of O VII. These lines may be detected with longer observations and potentially provide the first X–ray system with multiple absorption lines from the same element.
The detection of this putative O VIII K absorption line in the Chandra spectra of PG 1116+215 underscore the importance of H I BLA absorption lines as signposts of the elusive high–temperature WHIM plasma (e.g. Danforth et al., 2011; Prause et al., 2007). If this line is confirmed, the X–ray data indicates the presence of high–temperature WHIM with a total hydrogen column density of order . The combination of BLA’s and X–ray data for large samples has therefore the potential to identify large reservoirs of warm–hot baryons, and possibly close the missing–baryons gap (Shull et al., 2012).
Acknowledgements: JN is funded by PUT246 grant from Estonian Research Council. We thank Dr. M. Weisskopf and Prof. A. Finoguenov for help in the interpretation of the data. TF was partially supported by the National Natural Science Foundation of China under grant No. 11273021. ET and JT acknowledge the support by institutional research funding IUT26-2, IUT40-2 of the Estonian Ministry of Education and Research. MB acknowledges support by the NASA/MSFC 2015 Faculty Fellow program.
References
- Bonamente (2013) Bonamente M., 2013, Statistics and Analysis of Scientific Data. Springer, Graduate Texts in Physics
- Branchini et al. (2009) Branchini E. et al., 2009, ApJ, 697, 328
- Buote et al. (2009) Buote D. A., Zappacosta L., Fang T., Humphrey P. J., Gastaldello F., Tagliaferri G., 2009, ApJ, 695, 1351
- Cen & Ostriker (1999) Cen R., Ostriker J. P., 1999, ApJ, 514, 1
- Cui et al. (2012) Cui W., Borgani S., Dolag K., Murante G., Tornatore L., 2012, MNRAS, 423, 2279
- Danforth et al. (2010) Danforth C. W., Keeney B. A., Stocke J. T., Shull J. M., Yao Y., 2010, ApJ, 720, 976
- Danforth & Shull (2008) Danforth C. W., Shull J. M., 2008, ApJ, 679, 194
- Danforth et al. (2011) Danforth C. W., Stocke J. T., Keeney B. A., Penton S. V., Shull J. M., Yao Y., Green J. C., 2011, ApJ, 743, 18
- Davé et al. (2001) Davé R. et al., 2001, ApJ, 552, 473
- Fang et al. (2015) Fang T., Buote D., Bullock J., Ma R., 2015, ApJS, 217, 21
- Fang et al. (2010) Fang T., Buote D. A., Humphrey P. J., Canizares C. R., Zappacosta L., Maiolino R., Tagliaferri G., Gastaldello F., 2010, ApJ, 714, 1715
- Fang et al. (2007) Fang T., Canizares C. R., Yao Y., 2007, ApJ, 670, 992
- Fang et al. (2002) Fang T., Marshall H. L., Lee J. C., Davis D. S., Canizares C. R., 2002, ApJ, 572, L127
- Gehrels (1986) Gehrels N., 1986, ApJ, 303, 336
- Gnat & Sternberg (2007) Gnat O., Sternberg A., 2007, ApJS, 168, 213
- Kaastra et al. (1996) Kaastra J. S., Mewe R., Nieuwenhuijzen H., 1996, in UV and X-ray Spectroscopy of Astrophysical and Laboratory Plasmas, Yamashita K., Watanabe T., eds., pp. 411–414
- Lehner et al. (2007) Lehner N., Savage B. D., Richter P., Sembach K. R., Tripp T. M., Wakker B. P., 2007, ApJ, 658, 680
- Mazzotta et al. (1998) Mazzotta P., Mazzitelli G., Colafrancesco S., Vittorio N., 1998, A&AS, 133, 403
- McConnachie et al. (2009) McConnachie A. W., Patton D. R., Ellison S. L., Simard L., 2009, MNRAS, 395, 255
- Nevalainen et al. (2015) Nevalainen J. et al., 2015, A&A, 583, A142
- Nicastro et al. (2013) Nicastro F. et al., 2013, ApJ, 769, 90
- Nicastro et al. (2005) Nicastro F. et al., 2005, ApJ, 629, 700
- Planck Collaboration et al. (2015) Planck Collaboration et al., 2015, ArXiv e-prints
- Prause et al. (2007) Prause N., Reimers D., Fechner C., Janknecht E., 2007, A&A, 470, 67
- Rasmussen et al. (2007) Rasmussen A. P., Kahn S. M., Paerels F., Herder J. W. d., Kaastra J., de Vries C., 2007, ApJ, 656, 129
- Ren et al. (2014) Ren B., Fang T., Buote D. A., 2014, ApJ, 782, L6
- Sembach et al. (2004) Sembach K. R., Tripp T. M., Savage B. D., Richter P., 2004, ApJS, 155, 351
- Shull et al. (2012) Shull J. M., Smith B. D., Danforth C. W., 2012, ApJ, 759, 23
- Shull et al. (2003) Shull J. M., Tumlinson J., Giroux M. L., 2003, ApJ, 594, L107
- Tempel et al. (2014a) Tempel E., Stoica R. S., Martínez V. J., Liivamägi L. J., Castellan G., Saar E., 2014a, MNRAS, 438, 3465
- Tempel et al. (2014b) Tempel E. et al., 2014b, A&A, 566, A1
- Tilton et al. (2012) Tilton E. M., Danforth C. W., Shull J. M., Ross T. L., 2012, ApJ, 759, 112
- Tripp et al. (1998) Tripp T. M., Lu L., Savage B. D., 1998, ApJ, 508, 200
- Tripp et al. (2008) Tripp T. M., Sembach K. R., Bowen D. V., Savage B. D., Jenkins E. B., Lehner N., Richter P., 2008, ApJS, 177, 39
- Verner et al. (1996) Verner D. A., Verner E. M., Ferland G. J., 1996, Atomic Data and Nuclear Data Tables, 64, 1
- Yao et al. (2012) Yao Y., Shull J. M., Wang Q. D., Cash W., 2012, ApJ, 746, 166
- Yao et al. (2009) Yao Y., Tripp T. M., Wang Q. D., Danforth C. W., Canizares C. R., Shull J. M., Marshall H. L., Song L., 2009, ApJ, 697, 1784
- Yao et al. (2010) Yao Y., Wang Q. D., Penton S. V., Tripp T. M., Shull J. M., Stocke J. T., 2010, ApJ, 716, 1514