Reactor antineutrino fluxes – status and challenges
Abstract
In this contribution we describe the current understanding of reactor antineutrino fluxes and point out some recent developments. This is not intended to be a complete review of this vast topic but merely a selection of observations and remarks, which despite their incompleteness, will highlight the status and the challenges of this field.
I Introduction
The antineutrino flux from a nuclear reactor has become a matter of considerable interest over the past few years. The antineutrinos are created in the beta decay of the neutron rich isotopes produced as fragments in the fission of the reactor fuel. The interest in the resulting electron antineutrino flux originates from two communities. Basic research employs measurement of the flux to investigate neutrino oscillations including the possible existence of sterile neutrinos while the safeguards and threat reduction community would use the neutrino111For the sake of brevity we will refer to electron antineutrinos as neutrinos throughout this paper. spectrum and its composition over time as indicator of the makeup of the fissile material in the reactor. The basic research focus is on the absolute neutrino flux while safeguards has greater interest in the spectrum shape which may have markers for particular species of the fuel. Significant uncertainty remains regarding both issues. Reactor neutrino experiments rely on inverse beta decay (IBD)
| (1) |
to detect the neutrino. This reaction has a neutrino energy threshold of . Any uncertainty in the cross section directly relates to an uncertainty in the detected event rate or measured flux. The existing world average of the absolute value of the measured flux is 6% below the best prediction of that flux Mention et al. (2011), which was recently confirmed by Daya Bay An et al. (2015), which known as the Reactor Antineutrino Anomaly (RAA).
Three recent very successful experiments (Daya Bay An et al. (2012), Reno Ahn et al. (2012), Double Chooz Abe et al. (2012)) focused on measuring the neutrino mixing angle and as a by-product provided the most precise and detailed measurements of the neutrino spectrum produced by pressurized water power reactors (PWR). All three measurements used well-calibrated detectors at three different reactor sites and observed an unexpected excess of neutrinos with energies between 4.8 and 7.3 MeV An et al. (2015). This result has forcefully brought home the notion that the neutrino fluxes are not as well understood as had been thought. At present, it is not clear what physics gives rise to the bump. It clearly must be attributed to the excess production of some isotope or isotopes with a beta decay end point energy in the interval of the observed bump. There was a belief that the reactor neutrino fluxes could be predicted to within 2%. This belief was founded on employing integral beta spectra measured in the 1980’s at the Institute Laue-Langevin (ILL) by K. Schreckenbach and collaborators. They inserted foils of 235U, 239Pu and 241Pu into the ILL reactor to expose them to a thermal neutron flux and directly measured an integral beta spectrum created by the beta decaying isotopes produced by the neutron induced fission of each fissile isotope Von Feilitzsch et al. (1982); Schreckenbach et al. (1985); Hahn et al. (1989). The beta electron spectroscopy was performed with a magnetic spectrometer which also provide the necessary electron/gamma separation. It is of note that this type of measurement has been pioneered by Reines in 1958 Carter et al. (1959) using an anti-coincidence counter based on plastic scintillator; the same technique was employed in a recent measurement of the integral beta spectrum of 238U Haag et al. (2014a). Those measurements and the inferred neutrino yield for each fissile isotopes can be combined with the evolution of the fissile fuel composition over the run time to make a prediction of the neutrino spectrum. Of course, there are some assumptions and physics required in going from the beta spectrum to the neutrino spectrum but these were presumed to be tractable. Thus, the bump observed in the neutrino flux came as a surprise as no such bump could be generated using the ILL beta spectrum measurements. In principle one could take a different tack from using the ILL measurements and employ information contained in the very large data bases ENDF/B-VII.1 and JEFF-3.1.1 associated with the fission of 235U, 239Pu and 241Pu. These databases pull together a large body of experimental results to establish the fraction of each isotope produced in the fission of a specific fuel element as well as the subsequent beta decay branching ratios for each isotope. Naturally the use of such a procedure produces a large uncertainty in the predicted neutrino spectrum, on the order of 15%, see for instance Ref. Fallot et al. (2012). However using ENDF/ B-VII.1 one predicts a bump similar to that observed in the neutrino measurements. As reported in Hayes et al. (2015) using the JEFF-3.1.1 no such bump is predicted. Reference Hayes et al. (2015) discusses possible origins for the bump but provides no definite conclusions. Thus the bump in the neutrino energy spectrum that at present cannot be traced to a particular fissile isotope and an apparent 6% deficit in the total measured rate present serious obstacles to the use of neutrino detection for either basic research or threat reduction.
For basic neutrino research, the question is whether the 6% deficit is due to nuclear physics or due neutrino oscillation involving one or several eV-scale sterile neutrinos. The eV-scale sterile neutrino interpretation is also supported by a range of anomalies, where none taken individually is statistically very significant, but which in combination point towards an eV-scale sterile neutrino, for a review see Ref. Abazajian et al. (2012).
The basic application for threat reduction and nuclear non-proliferation safeguards relies on the predicted spectral difference in neutrino emission between uranium and plutonium isotopes, which allows to infer the plutonium content of a reactor without reference to its past operating history and without the need to modify reactor operations Christensen et al. (2014). The basic concept has been proposed by Borovoi and Mikaelyan in 1978 Borovoi and Mikaelyan (1978) and in many past reactor experiments a clear correlation between the neutrino signal and the state of the reactor was found (for early results see Korovkin et al. (1988); Klimov et al. (1990); Bernstein et al. (2008)). For an actual real-word application a much better quantitative understanding of the spectral differences in neutrino yields between different fissile isotopes is required.
The field of geoneutrino research as an experimental science is quite young Araki et al. (2005) and has made significant progress in the past few years Gando et al. (2013); Agostini et al. (2015). The sources and distribution of heat in the Earth interior is an important question in geophysics as it closely relates to the composition of the Earth and it is this heat which drives plate tectonics and the geodynamo. There are basically three potential sources for heat inside the Earth: contraction or gravitational binding energy, chemical energy and radioactivity. The overwhelming majority of radiogenic heat stems from the decay chains of potassium-40, uranium-238 and thorium-232. For a review of the relation between radiogenic heat and Earth composition models see for instance Ref. Šràmek et al. (2013). The latter two decay chains in uranium-238 and thorium-232 produce neutrinos above the inverse beta decay threshold and thus are solely responsible for the observed signals mentioned above. The next crucial data set will come from JUNO, however a large background of reactor neutrinos will have to be accurately subtracted Han et al. (2015). This subtraction requires a very good understanding of in particular the low-energy part of the reactor neutrino spectrum between IBD threshold and about 3.5 MeV.
II Neutrino yields
More than 99% of the power in reactors, in a uranium fuel cycle, is produced in the fission of four isotopes: 235U, 239Pu, 238U, and 241Pu. A reactor with fresh fuel starts with only fissions in the uranium isotopes and plutonium is produced via neutron capture on 238U as the burn-up increases. The total neutrino flux from a reactor can be written as
| (2) |
where is the fission rate in isotope and is the neutrino yield for the isotope . The thermal power of the reactor is also given in terms of the fission rates
| (3) |
where is the thermal energy release in one fission of the isotope ; we use the values for given in Ref. Kopeikin et al. (2004). In order to be able to disentangle the contributions of the four isotopes, we need to know the neutrino yields . These neutrino yields, in principle, are given by the neutrino spectra of each fission fragment and the cumulative fission yield for each fragment, ,
| (4) |
where typically runs over about 800 isotopes. In practice, we do not know the neutrino spectrum of a given fission fragment, but have only information regarding the beta spectrum and in many cases this knowledge is inaccurate, incomplete, or entirely missing. Even for a well known beta spectrum, significant complications arise from the conversion of a beta spectrum into a neutrino spectrum since each individual beta decay branch has to be treated separately. As a result, a direct computation of the neutrino yields via the summation of all individual neutrino spectra will be of limited accuracy Mueller et al. (2011); Fallot et al. (2012), but in many cases is the only available method.
A more accurate method is based on the measurement of the integral beta spectrum of all fission fragments Von Feilitzsch et al. (1982); Schreckenbach et al. (1985); Hahn et al. (1989); Haag et al. (2014b) and subsequently the neutrino spectrum can be reconstructed from those measurements Huber (2011). This method is less dependent on nuclear data about individual fission fragments but is not entirely free from uncertainties related to effects of nuclear structure Huber (2011); Hayes et al. (2013). In particular Hayes et al. Hayes et al. (2013) pointed out that forbidden decays which can make up as much as 40% of all neutrinos in certain energy ranges can have a significant impact on the predictions. The reason is, that in forbidden decays the spectrum of emitted neutrinos depends on details of the underlying nuclear structure, and generally no information at this level of detail is available.
Until the 2011 work by a group from Saclay Mueller et al. (2011), the results from Refs. Von Feilitzsch et al. (1982); Schreckenbach et al. (1985); Hahn et al. (1989) obtained in the 1980s at the Institut Laue-Langevin in Grenoble were considered the gold standard. The Saclay group, in preparation of the Double Chooz neutrino experiment Abe et al. (2012), revisited the previous results in an attempt to reduce the uncertainties. Instead, they found a upward shift of the central value of the average yield by about 3% while the error budget remained largely unchanged. This result, in turn, requires a reinterpretation of a large number of previous reactor neutrino experiments, since this changes the expected number of events. Together with the changes of the value of the neutron lifetime Wietfeldt and Greene (2011) and corrections from so-called non-equilibrium effects, the previous experiments appear to observe a deficit in neutrino count rate of about 6%; this is called the reactor antineutrino anomaly and was first discussed in Ref. Mention et al. (2011). The initial result on the flux evaluation and the 3% upward shift has been independently confirmed Huber (2011). A plausible explanation could come in the form of a new particle, a sterile neutrino, which is not predicted by the Standard Model of particle physics. Given the far-flung consequences of the existence of this sterile neutrino a considerable level of research activity ensued.
In Tab. 1 (taken from Ref. Christensen et al. (2015)) the event rate predictions for various flux models are compared for the four fissile isotopes. The ENSDF flux model represents a crude summation calculation and is based on thermal neutron fission yields of 235U, 239Pu, and 241Pu from the JEFF database, version 3.1.1 JEF (2009); the fast neutron fission yield of 238U from the ENDF-349 compilation England and Rider (1994); and on the beta-decay information contained in the Evaluated Nuclear Structure Data File (ENSDF) database, version VI ens . The neutrino spectrum is derived following the prescription in Ref. Huber (2011). This calculation reproduces the measured total beta spectra Von Feilitzsch et al. (1982); Schreckenbach et al. (1985); Hahn et al. (1989); Haag et al. (2014b) to within about 25%. A detailed summation result has been derived by Fallot et al. Fallot et al. (2012), where the ENSDF entries are replace with high quality experimental data (where available) and a a selected mix of databases is used. Fallot’s calculations reproduces the measured total beta spectra Von Feilitzsch et al. (1982); Schreckenbach et al. (1985); Hahn et al. (1989); Haag et al. (2014b) to within 10%. A direct inversion of the neutrino spectra from the total beta data was performed in Ref. Huber (2011) for the isotopes 235U, 239Pu, and 241Pu. To date this represents the most accurate neutrino yields for those isotopes. The absolute values are significantly different between models, but once normalized to the predictions for total rate and mean energy of 235U, these results become very similar. Therefore, we conclude that the difference in neutrino yield and mean energy between the fissile isotopes is consistently predicted by the various flux models – which should come as no surprise since these differences have their origin in the fission yields.
| ENSDF | Fallot | Huber | ||||||||||
|---|---|---|---|---|---|---|---|---|---|---|---|---|
| events | ratio | ratio | events | ratio | ratio | events | ratio | ratio | ||||
| 235U | 3826 | 1 | 4.48 | 1 | 3905 | 1 | 4.28 | 1 | 4252 | 1 | 4.25 | 1 |
| 238U | 5836 | 1.53 | 4.59 | 1.024 | 6076 | 1.56 | 4.45 | 1.040 | ||||
| 239Pu | 2442 | 0.64 | 4.26 | 0.950 | 2536 | 0.65 | 4.13 | 0.965 | 2796 | 0.66 | 4.04 | 0.951 |
| 241Pu | 3551 | 0.93 | 4.47 | 0.998 | 3515 | 0.90 | 4.23 | 0.988 | 3872 | 0.91 | 4.13 | 0.971 |
These results indicate a certain level of robustness in predictions, but this impression needs to be tempered by the recent observation of a bump-like feature. The shoulder recently observed in the neutrino flux from PWRs as measured by Reno Ahn et al. (2012), Daya Bay An et al. (2012) and Double Chooz Abe et al. (2012) was unexpected and its origin still uncertain. This shoulder cannot be reproduced if one uses as input the Schreckenbach measurements Von Feilitzsch et al. (1982); Schreckenbach et al. (1985); Hahn et al. (1989) of the integral beta spectra of the daughters produced by thermal neutron fission of reactor fuel. A subsequent publication by Dwyer and Langford Dwyer and Langford (2015) indicated that a shoulder similar to the one observed could be produced using for input the beta decays in a subset of ENDF/B-VII.1 Chadwick (2011) fission database. If one uses the fission database JEFF-3.1.1 JEF (2009) as input no shoulder is produced. This is not surprising as the uncertainties in the databases are large relative to the size of the shoulder.
It would be useful if the observed shoulder could be uniquely assigned to the decay of the daughters of a specific fuel type. If the shoulder is due to the thermal neutron fission of 235U, 239Pu or 241Pu then Schreckenbach’s measurements would be called into serious question. The recent measurement of the beta spectrum of the decay of the daughters of the fast fission of 238U Haag et al. (2014b) is not sufficiently precise to show the presence of a shoulder. Hayes and collaborators Hayes et al. (2015) investigate the possible origins of the observed shoulder and propose the following list
-
1.
Beta decay of non-fissionable material in the reactor
-
2.
Shape of the beta and neutrino spectrum for first forbidden decays
-
3.
Beta decay of the daughters of the fast fission of 238U
-
4.
Beta decay of daughters of the epithermal fission of 235U, 239Pu and/or 241Pu
-
5.
Errors in Schreckenbach’s ILL beta spectra
Taking at face value RENO’s claim that the shoulder they observe makes up 2% of the total yield of events, allows the first of the proposed causes to be readily dismissed. One shortcoming is, that the modelers Mueller et al. (2011); Huber (2011) created the neutrino spectrum from Schreckenbach’s beta spectrum assuming that all the beta decays were allowed rather than taking account of the fact that some of the most important decays are , so-called non-unique first forbidden decays. These decays have no weak magnetism correction which increase their contribution relative to what the modelers provided. This is because weak magnetism typically decreases the antineutrino component of an allowed axial transition above half of the end point energy. Treating these decays more correctly increases their yield in the region of the bump Hayes et al. (2015) by somewhat less than 1% of the total yield so it cannot account for all of the shoulder. Not enough is known of the decay of the daughters produced by the fast fission of 238U so it certainly could contribute to the shoulder. RENO observes the largest shoulder in the neutrino flux and cites the largest contribution from the fission of 238U. To account for the entire shoulder the isotopes dominating the shoulder region would have to be 4 times larger in JEFF-3.1.1 and 2 times larger in ENDF/B-VII.1 Hayes et al. (2015). Thus it appears that 3) likely makes some contribution to the shoulder.
Schreckenbach’s measurements were carried out using the thermal flux of the ILL reactor while the 3 measurements observing the shoulder were carried out at PWRs. Is it possible that the harder neutron flux spectrum in a PWR relative to the one at ILL could produce more fission products that create the shoulder? While there appear to be large fluctuations Cowan et al. (1961, 1963, 1966, 1970) in the ratio of symmetric to asymmetric fission the average over the epithermal resonances is quite compatible with what is measured with a thermal flux. The lone exception might be 239Pu that has an isolated and prominent fission resonance at 0.3 eV. Fission of this resonance must play a larger role in the neutron spectrum of a power reactor than is the case for fission at thermal energies. Thus 4) could make a contribution to the bump. The possibility of an error in the ILL beta spectrum measurements must also be entertained. In the discussion of possibility 2) it was pointed out that using the ILL beta spectrum measurements and properly accounting for transitions can only account for half of the shoulder. This raises the possibility that these measured beta spectra are not correct. Certainly the measurements were not easy and the spectrometer employed Mampe et al. (1978) was complex. Further the signal to background in bump region was 2.5/1 and it is not clear how the background subtraction was carried out. One should not dismiss the possibility of error in the ILL beta spectra. A high statistics measurement of the neutrino flux at a research reactor fueled with highly-enriched uranium (HEU) will produce neutrinos only via the fission of 235U and should settle some of the issues raised above.
Assuming that the Daya Bay result on the bump holds, we can ask the question, which fissile isotope does it come from? To demonstrate how a multi-reactor deployment of a 5 ton detector can elucidate this question, we compare the following four types of reactors: a Daya Bay like pressurized water reactor (DYB), a pressurized water reactor with 1/3 of reactor-grade MOX fuel (MOX3), a research reactor like the BR2 in Belgium running on highly enriched uranium (BR2) and a fast breeder reactor like the Fast Breeder Test Reactor (FBTR) in India. For DYB the fission fraction an reactor characteristics correspond to values of the actual data taking period at Daya Bay Zhong (2014), while for the others, we used semi-realistic models in terms of reactor power, reactor up-time and detector distance. Specifically, the fission fractions in the four fissile isotopes for the 1/3 MOX are based on a 3D, pin-level 1/8-core simulation Erickson (2015). For BR2 we make the simplifying assumption that all fissions take place in 235U and we have tested that a few percent of fission in other isotopes does not change the results. For the FBTR we take the core simulation performed for a full size Indian Fast Breeder from Ref. Glaser and Ramana (2007) as proxy. We assume that there is no breeding blanket and we neglect fission in the even plutonium isotopes which overall contribute about 5% of fissions. The reactor parameters and fission rates are summarized in Tab. 2.
| Reactor | power | stand-off | duty factor | 235U | 238U | 239Pu | 241Pu | Events |
| [MW] | [m] | |||||||
| DYB | 2 800 | 25 | 1 | 0.586 | 0.076 | 0.288 | 0.05 | 2,188,000 |
| MOX3 | 3 200 | 25 | 1 | 0.51 | 0.066 | 0.39 | 0.031 | 2,402,000 |
| BR2 | 60 | 5.5 | 0.4 | 1 | 0 | 0 | 0 | 297,000 |
| FBTR | 60 | 10 | 0.4 | 0.0093 | 0.10 | 0.71 | 0.11 | 95,000 |
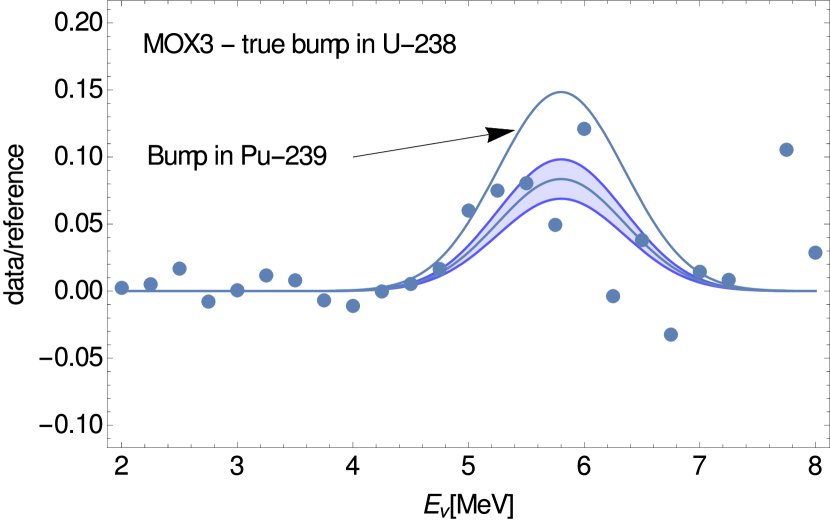
For the following analysis we extract the shape, position and amplitude of the bump from the Daya Bay data Zhong (2014). We use as reference spectrum for 235U, 239Pu and 241Pu the ones from Ref. Huber (2011) and for 238U the spectrum from Ref. Mueller et al. (2011). The bump appears relative to these reference spectra and therefore any uncertainties in the reference spectra itself will make it harder to detect the bump. We will use the uncertainties as quoted in Ref. Huber (2011) for 235U, 239Pu and 241Pu and assume a flat 10% error for 238U. Note, that the reference spectra provide, except for the bump, an excellent description of the Daya Bay data. We now can artificially choose to put the bump into one isotope while ensuring to reproduce the right amplitude in Daya Bay. We simulate data for a 5 ton detector with a 40% detection efficiency and 1 year data taking. We impose random fluctuations for counting statistics and separately for the underlying systematic uncertainty of the reference spectra. In Fig. 1 we show the result of one of these simulated experiments at MOX3 with the true bump in 238U. The shaded region indicates the range from the fit and for comparison we show the expectation for MOX3 if the bump were in 239Pu.
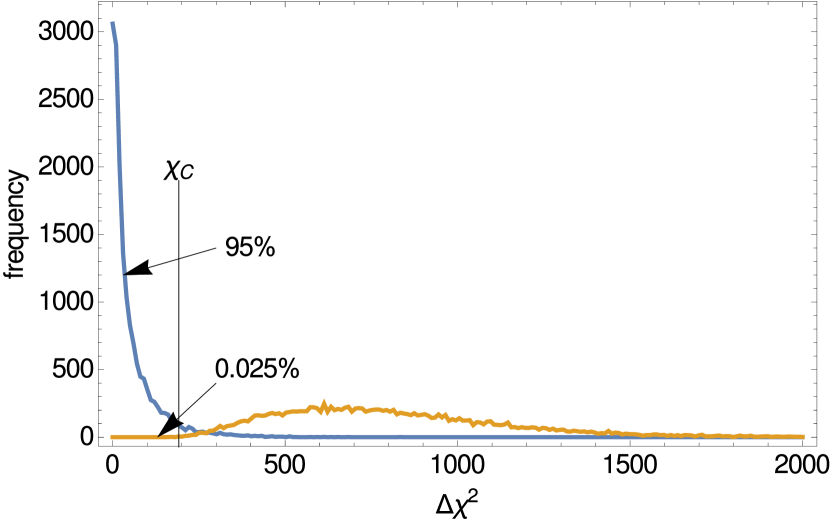
We then in turn fit this data with the bump being in 235U and then in 238U etc. and compute a difference, where we leave the total event rate as a free parameter. This exercise is repeated 16,000 times, and we thus obtain a distributions for the and their differences . For instance in Fig. 2 we show the distribution for the true bump in 238U and the blue histogram is the result if we fit the data with the correct bump. The reason for the non-zero in this case is the systematic uncertainty of the reference spectra. The orange histogram is obtained by fitting this data with the bump being in 239Pu. is defined by requiring that 95% of all cases in the blue histogram are below this value222In other words, for this hypothesis test, we set the error of the 1st kind to 5%, that is we reject the true null hypothesis in 5% of all cases., in this example . Next, we look how many cases in the orange histogram also fall below 333This corresponds to the error of the 2nd kind, that is we accept the null hypothesis although it is wrong. The complement of this number corresponds to the power of the test., which in this example are 4 out of 16,000 or 0.025%. That is in only 0.025% cases we would conclude (wrongly) that 239Pu contains the bump, whereas in 95% of the cases we would conclude (correctly) that the bump is in 238U. In other words with an efficiency of 95% we can reject the bump being in 239Pu at 3.67 standard deviations.
| MOX3 | ||||
|---|---|---|---|---|
| Fit/True | 235U | 238U | 239Pu | 241Pu |
| 235U | - | |||
| 238U | - | 3.8 | 0.6 | |
| 239Pu | 3.7 | - | ||
| 241Pu | 0.7 | - | ||
| FBTR | ||||
|---|---|---|---|---|
| Fit/True | 235U | 238U | 239Pu | 241Pu |
| 235U | - | |||
| 238U | - | 3.8 | 1.1 | |
| 239Pu | 3.6 | - | ||
| 241Pu | 1.1 | - | ||
We repeat this exercise for each type of reactor and all 16 combinations of true and fitted bump being in a given isotope. Clearly, DYB will see the same signal no matter which isotope contains the bump as per definition of this analysis, it serves to set the size and position of the bump. The BR2 will see a very strong signal for a bump () if the bump is in 235U and see no bump if it is in any of the other isotopes. To diagnose the case where the bump is in 238U or either in 239Pu or in 241Pu requires reactors with increased plutonium and/or 238U fission fractions like MOX3 and FBTR. The resulting rejection power is shown in Tab. 3.
All cases can be identified with better than 3 standard deviations except the distinction between the bump being in 238U versus 241Pu, where the combination MOX3 and FBTR can reach about . Note that at this point this analysis is limited by the systematic uncertainty of the underlying reference spectra. However, the very same measurements will be able to deliver very precise new reference spectra and thus the ultimate sensitivity will be significantly higher. However, this analysis requires a very detailed reactor modeling to determine the uncertainties of the fission fractions. There are examples in the literature, e.g. Ref. Jones et al. (2012), and a similar exercise needs to be repeated for the specific reactor in question. It also obvious that at least one reactor with a high plutonium content needs to be added.
A similar analysis was presented recently in Ref. Buck et al. (2015) where the focus was on a comparison of regular PWRs and research reactors running on HEU, providing a clean 235U signal. The results presented here agree reasonably well with those of Ref. Buck et al. (2015), but we also show that reactor with very different plutonium concentrations will be required to untangle the bump. A major technical difference between the two analyses is that here we fully account for the current uncertainties of the reference spectra, whereas in Ref. Buck et al. (2015) a smooth interpolation through the bump region is used, which is equivalent to assuming that reference spectra will have very significantly improved by the time this measurement is perform. Thus, in reality the sensitivity will be in-between the results of those two analyses.
III Non-linear effects in reactor fluxes
In Ref. Huber and Jaffke (2015) the effect of neutron capture isotopes on the antineutrino spectrum is investigated and corrections of up to 1% for PWRs and several per cent for naval reactors are found in the low-energy neutrino flux. Candidate isotopes can be found by looking at isotopes which can undergo (two neutrino) double-beta decay: fission fragments are generally produced a few beta decays away from stability and they will decay in their mass chain down to the first stable isotope they encounter, e.g. for the mass chain this will be 100Mo. The next isotope in this chain is 100Tc which itself beta decays with an endpoint of 3.2 MeV, well above IBD threshold, however it can not be produced by beta decay of 100Mo due to nucleon-pairing effects, that is why 100Mo only double-beta decays. Thus production of 100Tc via beta decay is impossible and its direct fission yield is negligible. However, 99Tc is not blocked by a double-beta decay isotope and thus is produced as a result of beta decays along the mass chain. Again thanks to pairing effects, 99Tc has a sizable neutron capture cross section of about 17 b which yields 100Tc, which in turn contributes to the low-energy end of the neutrino spectrum. Under some simplifying assumption the rate of 99Tc production is proportional to the neutron flux, , but the capture rate to 100Tc is proportional to neutron flux and the rate of 99Tc production and as a result the rate of 100Tc production is proportional to , that is it has a non-linear dependence on the neutron flux in contrast to regular fission fragments which have a linear dependence. There is a simple analytic theory for the size of the resulting correction, however this is accurate only within 50%. For a more precise calculation a detailed reactor burn-up calculation is required and these detailed results are presented in Ref. Huber and Jaffke (2015).
IV Summary
Nuclear reactors have been the workhorse of neutrino physics from it’s very beginning as an experimental science Cowan et al. (1956) and much has been learned about neutrino properties from a series of experiments spanning many decades. Recently, a very precise determination of has been achieved by using reactors as a neutrino source and employing the comparison of data obtained with near and far detectors, which essentially obviates the need to understand the reactor neutrino flux.
Till 2011 reactor antineutrino fluxes appeared to be well understood at the level of about 2% uncertainty, but as outlined here and elsewhere, this confidence was mistaken. As often with complex problems, the closer one looks the larger the uncertainty becomes. Predicting the inverse beta decay event rate with a reactor as neutrino source is extraordinarily complex as it requires a quantitative understanding of reactor physics to determine the neutron flux and fission rates. From this information together with the fission yields the isotopic composition of the reactor needs to be determined. For each isotope a detailed understanding of its various beta-decay branches is required and since about 30–40% of all neutrinos in the relevant energy regime are from forbidden decays, the details of nuclear structure can not be avoided. Also, there is a number of low-energy effects related to isotopes which have comparatively long half-lives giving rise the non-equilibrium correction. These same isotopes also contribute to neutrino emissions from spent nuclear fuel, which, if spent fuel is present on site, have to be accounted for. More recently also non-linear effects in form of neutron capture isotopes have been pointed out which will greatly complicate the comparison of data from different reactors.
The precise measurements obtained at the near detectors of several experiments also clearly highlight the limitations of our understanding of reactor neutrino fluxes: the 5 MeV bump remains a conundrum. We explored certain experimental tests which could be performed as was done in Ref. Buck et al. (2015) and it is clear that even just assigning the responsible fissile isotope requires a continued effort. The prediction of non-linear isotopes can be verified by measuring the abundance of the stable end-point isotopes. A series of close-range reactor measurements is planned, which will add further information about reactor antineutrino fluxes, but is worthwhile to point out that with the Daya Bay data set a very precise measurement is available. The vicissitudes encountered close to a reactor, that is a lack of overburden and reactor related backgrounds, will make it a challenge to achieve comparable precision.
A central role in this tale is played by the beta spectrum measurements performed by Schreckenbach et al. in the 1980s. They constitute the single point of failure for many predictions and thus the question is: Can these measurements be reproduced with similar precision? We did not touch on efforts to improve the data on beta decays of the individual isotopes by using totally active gamma spectroscopy, see for instance Ref. Zakari-Issoufou et al. (2015), or the uncertainties inherent in fission yields. Efforts to improve nuclear data bases will be very beneficial to the issues outlined here. It will require a broad and sustained effort by many communities to unravel the riddle of the reactor neutrino flux, with potentially large discoveries to be made.
Acknowledgements.
I would like to thank G. Garvey for collaboration on an early version of this manuscript and A. Erickson for providing the fission rates for the MOX case studied here. This work was in part supported by the U.S. Department of Energy under award DE-SC0013632.References
- Mention et al. (2011) G. Mention et al., Phys.Rev. D83, 073006 (2011), eprint 1101.2755.
- An et al. (2015) F. P. An et al. (Daya Bay) (2015), eprint 1508.04233.
- An et al. (2012) F. An et al. (DAYA-BAY Collaboration), Phys.Rev.Lett. 108, 171803 (2012), eprint 1203.1669.
- Ahn et al. (2012) J. Ahn et al. (RENO collaboration), Phys.Rev.Lett. 108, 191802 (2012), eprint 1204.0626.
- Abe et al. (2012) Y. Abe et al. (DOUBLE-CHOOZ Collaboration), Phys.Rev.Lett. 108, 131801 (2012), eprint 1112.6353.
- Von Feilitzsch et al. (1982) F. Von Feilitzsch, A. Hahn, and K. Schreckenbach, Phys.Lett. B118, 162 (1982).
- Schreckenbach et al. (1985) K. Schreckenbach, G. Colvin, W. Gelletly, and F. Von Feilitzsch, Phys.Lett. B160, 325 (1985).
- Hahn et al. (1989) A. Hahn, K. Schreckenbach, G. Colvin, B. Krusche, W. Gelletly, et al., Phys.Lett. B218, 365 (1989).
- Carter et al. (1959) R. E. Carter, F. Reines, J. J. Wagner, and M. E. Wyman, Phys. Rev. 113, 280 (1959).
- Haag et al. (2014a) N. Haag, A. Gütlein, M. Hofmann, L. Oberauer, W. Potzel, K. Schreckenbach, and F. Wagner, Phys. Rev. Lett. 112, 122501 (2014a), eprint 1312.5601.
- Fallot et al. (2012) M. Fallot, S. Cormon, M. Estienne, A. Algora, V. Bui, et al., Phys.Rev.Lett. 109, 202504 (2012), eprint 1208.3877.
- Hayes et al. (2015) A. C. Hayes, J. L. Friar, G. T. Garvey, D. Ibeling, G. Jungman, T. Kawano, and R. W. Mills, Phys. Rev. D92, 033015 (2015), eprint 1506.00583.
- Abazajian et al. (2012) K. Abazajian, M. Acero, S. Agarwalla, A. Aguilar-Arevalo, C. Albright, et al. (2012), eprint 1204.5379.
- Christensen et al. (2014) E. Christensen, P. Huber, P. Jaffke, and T. Shea, Phys.Rev.Lett. 113, 042503 (2014), eprint 1403.7065.
- Borovoi and Mikaelyan (1978) A. A. Borovoi and L. A. Mikaelyan, Soviet Atomic Energy 44, 589 (1978).
- Korovkin et al. (1988) V. A. Korovkin et al., Soviet Atomic Energy pp. 712–718 (1988).
- Klimov et al. (1990) Y. V. Klimov et al., Sov. J. Nucl. Phys. 51, 225 (1990).
- Bernstein et al. (2008) A. Bernstein, N. Bowden, A. Misner, and T. Palmer, J.Appl.Phys. 103, 074905 (2008), eprint 0804.4723.
- Araki et al. (2005) T. Araki et al., Nature 436, 499 (2005).
- Gando et al. (2013) A. Gando et al. (KamLAND), Phys. Rev. D88, 033001 (2013), eprint 1303.4667.
- Agostini et al. (2015) M. Agostini et al. (Borexino), Phys. Rev. D92, 031101 (2015), eprint 1506.04610.
- Šràmek et al. (2013) O. Šràmek, W. F. McDonough, E. Kite, V. Lekic, S. Dye, and S. Zhong, Earth and Planetary Science Letters 361, 356 (2013).
- Han et al. (2015) R. Han, Y.-F. Li, L. Zhan, W. F. McDonough, and J. Cao (2015), eprint 1510.01523.
- Kopeikin et al. (2004) V. Kopeikin, L. Mikaelyan, and V. Sinev, Phys.Atom.Nucl. 67, 1892 (2004), eprint hep-ph/0410100.
- Mueller et al. (2011) T. A. Mueller et al., Phys. Rev. C 83, 054615 (2011), eprint 1101.2663.
- Haag et al. (2014b) N. Haag, A. Gütlein, M. Hofmann, L. Oberauer, W. Potzel, K. Schreckenbach, and F. Wagner, Phys. Rev. Lett. 112, 122501 (2014b), eprint 1312.5601.
- Huber (2011) P. Huber, Phys.Rev. C84, 024617 (2011), eprint 1106.0687.
- Hayes et al. (2013) A. Hayes, J. Friar, G. Garvey, and G. Jonkmans, Phys.Rev.Lett. 112, 202501 (2013), eprint 1309.4146.
- Wietfeldt and Greene (2011) F. E. Wietfeldt and G. L. Greene, Rev. Mod. Phys. 83, 1173 (2011).
- Christensen et al. (2015) E. Christensen, P. Huber, and P. Jaffke, Science and Global Security 23, 20 (2015), eprint 1312.1959.
- JEF (2009) Tech. Rep. 6287, NEA (2009).
- England and Rider (1994) T. R. England and B. Rider, ENDF-349 Evaluation and Compilation of Fission Product Yields: 1993 (1994).
- (33) http://www.nndc.bnl.gov/ensdf/.
- Dwyer and Langford (2015) D. A. Dwyer and T. J. Langford, Phys. Rev. Lett. 114, 012502 (2015), eprint 1407.1281.
- Chadwick (2011) M. B. Chadwick, Nucl. Data Sheets 112, 2887 (2011).
- Cowan et al. (1961) G. A. Cowan, A. Turkevich, and C. I. Browne, Phys. Rev. 122, 1286 (1961).
- Cowan et al. (1963) G. A. Cowan, B. P. Bayhurst, and R. J. Prestwood, Phys. Rev. 130, 2380 (1963).
- Cowan et al. (1966) G. A. Cowan, B. P. Bayhurst, R. J. Prestwood, J. S. Gilmore, and G. Knobeloch, Phys. Rev. 144, 979 (1966).
- Cowan et al. (1970) G. A. Cowan, B. P. Bayhurst, R. J. Prestwood, J. S. Gilmore, and G. Knobeloch, Phys. Rev. C 2, 615 (1970).
- Mampe et al. (1978) W. Mampe, K. Schreckenbach, P. Jeuch, B. Maier, F. Braumandl, J.Larysz, and T. von Egidy, Nucl. Inst. and Meth. 154, 127 (1978).
- Zhong (2014) W. Zhong, in ICHEP (2014).
- Erickson (2015) A. Erickson (2015), private communication.
- Glaser and Ramana (2007) A. Glaser and M. V. Ramana, Science and Global Security 15, 85 (2007).
- Jones et al. (2012) C. L. Jones, A. Bernstein, J. M. Conrad, Z. Djurcic, M. Fallot, L. Giot, G. Keefer, A. Onillon, and L. Winslow, Phys. Rev. D86, 012001 (2012), eprint 1109.5379.
- Buck et al. (2015) C. Buck, A. P. Collin, J. Haser, and M. Lindner (2015), eprint 1512.06656.
- Huber and Jaffke (2015) P. Huber and P. Jaffke (2015), eprint 1510.08948.
- Cowan et al. (1956) C. L. Cowan, F. Reines, F. B. Harrison, H. W. Kruse, and A. D. McGuire, Science 124, 103 (1956).
- Zakari-Issoufou et al. (2015) A. A. Zakari-Issoufou et al. (IGISOL), Phys. Rev. Lett. 115, 102503 (2015), eprint 1504.05812.