G11.20.3: The Young Remnant of a Stripped-Envelope Supernova
Abstract
We present results of a 400-ks Chandra observation of the young shell supernova remnant (SNR) G11.20.3, containing a pulsar and pulsar-wind nebula (PWN). We measure a mean expansion rate for the shell since 2000 of % yr-1, implying an age between 1400 and 2400 yr, and making G11.20.3 one of the youngest core-collapse SNRs in the Galaxy. However, we find very high absorption (), confirming near-IR determinations and ruling out a claimed association with the possible historical SN of 386 CE. The PWN shows strong jets and a faint torus within a larger, more diffuse region of radio emission and nonthermal X-rays. Central soft thermal X-ray emission is anticorrelated with the PWN; that, and more detailed morphological evidence, indicates that the reverse shock has already reheated all ejecta and compressed the PWN. The pulsar characteristic energy-loss timescale is well in excess of the remnant age, and we suggest that the bright jets have been produced since the recompression. The relatively pronounced shell and diffuse hard X-ray emission in the interior, enhanced at the inner edge of the shell, indicate that the immediate circumstellar medium into which G11.20.3 is expanding was quite anisotropic. We propose a possible origin for G11.20.3 in a stripped-envelope progenitor that had lost almost all its envelope mass, in an anisotropic wind or due to binary interaction, leaving a compact core whose fast winds swept previously lost mass into a dense irregular shell, and which exploded as a Type cIIb or Ibc supernova.
Subject headings:
ISM: individual objects (G11.20.3) — ISM: supernova remnants — X-rays: ISM1. Introduction
The remnants of core-collapse supernovae (CC SNRs) contain a wealth of information on the progenitor system, the supernova (SN) event, and the surrounding material. Young CC SNRs show the clearest imprint of the SN itself and the composition of the ejecta. If a neutron star left behind acts as a pulsar, it can inflate a pulsar-wind nebula (PWN) in the midst of the expanding ejecta. Young PWNe are of great interest in their own right, as they exhibit the particles and magnetic field generated in the relativistic pulsar outflow and modified in a relativistic wind termination shock. However, the PWN can also act as a probe of the innermost material ejected in the supernova.
The youngest CC SNR in the Galaxy, Cas A, contains a neutron star which unfortunately does not function as a pulsar, while the youngest PWN in the Galaxy, the Crab Nebula, shows only very indirect evidence for the surrounding SNR shell that ought to contain it (see Hester 2008 for a review). The other historical SNRs, Kepler, Tycho, SN 1006, RCW 86 (= SN 185 CE; Williams et al. 2011) and G1.9+0.3 (the latter only quasi-historical, as the SN event was not observed at Earth due to obscuration around 1900 when it would have been seen), all appear to be remnants of thermonuclear, Type Ia events. For years it was thought that the next youngest historical CC SNR was a bright shell radio source, G11.20.3; in fact, one of the present authors (Reynolds et al., 1994) used ROSAT observations to claim support for its association with a possible supernova in CE 386 (Stephenson & Green 2002), as well as arguing for a Type Ia origin. Both these assertions have turned out to be incorrect.
G11.20.3 has been identified as a potential historical SNR since at least the first well-resolved imaging observations at radio (VLA, resolution) and X-ray (Einstein HRI) wavelengths (Downes, 1984), where it was argued that its high radio surface brightness and symmetrical well-defined shell structure indicated youth. An identification with the CE 386 event was proposed, but an even younger age was also suggested. Green et al. (1988) observed G11.20.3 with the VLA with resolution at two frequencies, and argued on morphological grounds that G11.20.3 resembled Cas A much more than Tycho or Kepler, in particular in the clumpy structure and lack of a sharp outer boundary. They reinterpreted an H I absorption spectrum of Becker et al. (1985) to estimate a distance of about 5 kpc, and also supported an association with the CE 386 event. More recent distance estimates range from 4.4 kpc (Green, 2004) to 5.5–7 kpc (Minter et al., 2008). (Below, we use a distance of 5 kpc but also consider variations between 4.4 and 7 kpc.)
The question of the SN type giving rise to G11.20.3 was definitively settled with the discovery with ASCA of the PWN (Vasisht et al., 1996) and the 65 ms pulsar (Torii et al., 1997). However, the measured spindown (Torii et al., 1999) gave a characteristic age of about 20,000 yr, implying that the pulsar was born spinning at nearly its present period (so is a poor age indicator). Best values for the pulsar period and period derivative were obtained with RXTE (see the Fermi Ephemerides database111 http://fermi.gsfc.nasa.gov/ssc/data/access/lat/ephems/index.html): ms and s s-1, giving yr and spindown luminosity erg s-1.
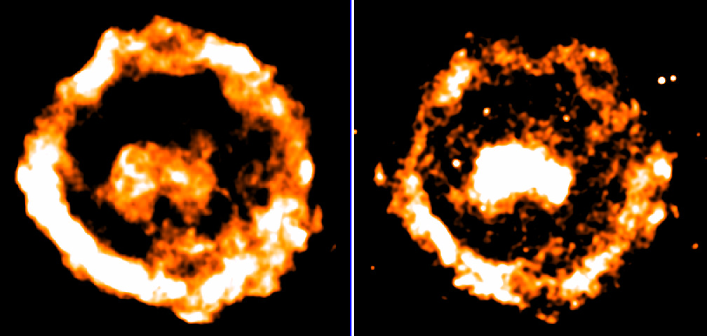
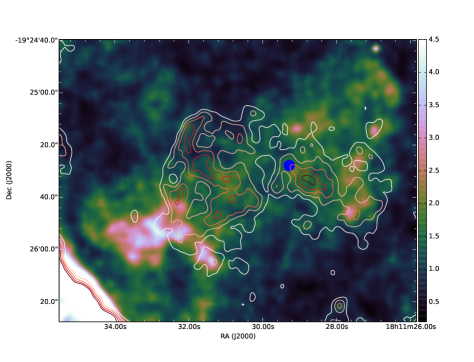
Further radio spectral studies (Kothes & Reich, 2001) confirmed the presence of a flat-spectrum radio core ( with ) with observations between 4.85 and 32 GHz, using the Effelsberg 100-m telescope. The most detailed radio observations of G11.20.3 were those of Tam et al. (2002) and Tam & Roberts (2003) with the VLA. Tam et al. (2002) reported a PWN spectral index of and a shell spectrum with , from archival VLA observations. The highest resolution imaging of the PWN radio structure was reported in Roberts et al. (2003). The radio image shows loops and arcs of radio emission most prominent to the northeast (Figures 1, 2, and 3). While the pulsar dominates the X-ray image, it is not detectable in the radio image. This is consistent with the upper limit of 0.1 mJy on the pulsed flux obtained from deep 1.9 GHz radio searches with the Green Bank Telescope (H. Al Noori, private communication).
G11.20.3 was an early target of the Chandra X-ray Observatory. Kaspi et al. (2001) showed that the pulsar was within of the geometric center of the remnant, providing additional evidence that the pulsar spindown age greatly overestimated the true age of the pulsar and remnant. Roberts et al. (2003) analyzed the morphology and spectrum of the shell and PWN, in comparison with high-resolution radio data. They focused primarily on the PWN, showing the radio counterpart, and pointing out small-scale changes in X-ray morphology between observations in August and October 2000. Spectral analysis showed that a plane-shock model did a reasonable job of describing the brightest (SE) portion of the shell, with keV and an ionization timescale of about cm-3 s. However, a hard excess was present, which they described with a model of synchrotron emission from a power-law electron spectrum with an exponential cutoff, requiring a rolloff frequency (the characteristic synchrotron frequency emitted by electrons with the e-folding energy of the exponential cutoff) of about Hz. A further Chandra observation of 60 ks was obtained in 2003, confirming variability of the PWN (Roberts et al., 2004). X-ray emission from the PWN was found to consist of bright jets and much fainter, more diffuse emission mostly filling the radio PWN (Roberts et al., 2005).
G11.20.3 was reported as an infrared source in the IRAS catalogue of Arendt (1989), but this was probably unrelated emission from an H II region (Reach et al., 2006). Reach et al. (2006) detected G11.20.3 with Spitzer in the GLIMPSE survey of the Galactic plane with the IRAC instrument. Only faint filamentary emission in a few spots was detected, primarily at the longer wavelengths (5.8 and 8 m). However, at 24 m, Spitzer MIPS observations show a bright, complete shell corresponding well to the radio and X-ray structure and attributed to emission from collisionally heated grains (Pinheiro Gonçalves et al., 2011; Andersen et al., 2011). Recent near-IR observations (Koo et al. 2007; Moon et al. 2009) show [Fe II] emission at 1.644 m from the bright SE shell and the fainter NW shell as well as in several knots surrounding the PWN. The outer shell emission may represent a mixture of ejecta and shocked circumstellar medium (CSM). The interior emission shows Doppler shifts of up to 1000 km s-1, and is interpreted as inner ejecta (Moon et al. 2009) in undecelerated expansion. More spatially-localized emission from molecular hydrogen is also present (Koo et al., 2007; Froebrich et al., 2015), with several H2 filaments located outside the radio boundary of the remnant. The recent detection of broad CO lines provides additional evidence for the presence of shocked molecular gas in G11.20.3 (Kilpatrick et al., 2016).
G11.20.3 shows expansion at radio and near-IR wavelengths. Tam & Roberts (2003) derived radio expansion rates of yr-1 and yr-1 at 20 and 6 cm, respectively, while Koo et al. (2007) found the SE [Fe II] filament to be expanding at yr-1. While the errors are large, these rates imply undecelerated ages (that is, upper limits) of 4,000 – 7,000 yr, confirming the relative youth of G11.20.3.
G11.20.3 presents various interesting problems for the evolution of SNRs and their massive-star progenitors. Chevalier (2005) included it in a group of remnants of Type IIL/b supernovae, a class of supernovae which have lost most of their hydrogen envelopes at the time of explosion, implying pre-explosion mass loss of at least several . He interpreted the observations as supporting a SN IIL/b event in which the shell’s reverse shock has not yet reached the PWN. If G11.20.3 originated in such a supernova, the current SNR blast wave should be encountering modified CSM, perhaps in a steady-state wind with . The large extent of the PWN relative to the shell has been used as evidence that the reverse shock has not quite reached the PWN yet (Tam et al., 2002), but the nature of central thermal X-ray emission (see Figure 1 in Roberts et al., 2003) is not at all clear. So even basic questions concerning this important remnant are not definitively answered: What is the actual age? Is it encountering stellar-wind material, undisturbed interstellar medium (ISM), or something else? Where is the reverse shock? Is there evidence in X-rays for ejecta emission, whose abundances might contain clues to the progenitor mass? We address these questions below with a ks Chandra observation.
2. X-Ray Observations
Chandra deep observations of G11.20.3 (catalog ) took place in 2013 May and September (Table 1), with the remnant located on the ACIS S3 CCD chip. All data have been reprocessed with CIAO v4.6 and CALDB v4.6.3, and screened for periods of high particle background. Very Faint mode was used as the surface brightness of G11.20.3 (catalog ) is low, allowing for an efficient rejection of particle background. The total effective exposure time is 388 ks ( in May and in September). Observations in May consist of one long (173 ks) pointing in its first week, and two shorter pointings (combined exposure of 121 ks) in its last week. This makes it possible to study the short-term variability of the PWN. Earlier observations from 2000 and 2003 (Table 1) have also been used for investigation of the long-term variability of the PWN and for measuring the remnant’s expansion. The same processing steps were followed as for the 2013 observations. The earliest observation from 2000 August was done in Faint mode, so its particle background is higher than for other datasets.
| Date | Observation ID | Roll Angle | Effective exposure time |
|---|---|---|---|
| (deg) | (ks) | ||
| 2000 Aug 06 | 780 | 267 | 19 |
| 2000 Oct 15 | 781 | 273 | 10 |
| 2000 Oct 15 | 2322 | 273 | 4.6 |
| 2003 May 10 | 3909 | 95 | 14 |
| 2003 Jun 27 | 3910 | 209 | 14 |
| 2003 Aug 01 | 3911 | 258 | 7.3 |
| 2003 Sep 08 | 3912 | 270 | 15 |
| 2013 May 05–07 | 14831 | 95 | 173 |
| 2013 May 25–26 | 14830 | 98 | 58 |
| 2013 May 26–27 | 14832 | 98 | 63 |
| 2013 Sep 07 | 15652 | 270 | 48 |
| 2013 Sep 08–09 | 16323 | 270 | 46 |
We aligned the 2013 observations to match the reference frame of the longest pointing from early May (Obs. ID 14831). Most detected X-rays are produced by G11.20.3 (catalog ), so we smoothed the 2013 May 5–7 data with the multiscale partitioning method of Krishnamurthy et al. (2010), and then used the method described in § 7 to align the other 2013 pointings. The coordinate transformation used involves only simple translations, without any rotation or change in the physical scale. Alignment of the 2000 and 2003 observations to the 2013 reference frame was done simultaneously with the measurement of the remnant’s expansion (as described in § 7). This involves change in the physical scale but not rotation.
3. Radio Observations
The Very Large Array observed the field containing G11.20.3 in 2001–2002 at 20 cm, 6 cm, and 3.5 cm. The 20 cm and 6 cm observations and reduction are described in Tam & Roberts (2003) and were used to measure the expansion of the remnant. Since the PWN has a significantly flatter spectrum than the shell, it is more prominent at 3.5 cm, and we use those data for the morphological comparisons described here. The same image was previously used in Roberts et al. (2003).
A four-pointing mosaic centered on the remnant was used with the pointings separated by half a primary beamwidth. The bandwidth was 100 MHz which, after flagging and averaging the data sets, had an effective central frequency of 8459.4 MHz. The observations were interleaved with the observations at 20 cm and 6 cm presented in Tam & Roberts (2003) so as to maximize the hour angle coverage. Each pointing of the mosaic had exposures of roughly 27 min in the DnC Array, 18 min in the C array, 13 min in the CnB array, and 31 min in the BnA array. The data processing was performed using standard procedures within the MIRIAD package (Sault & Killeen, 1999)222See http://www.atnf.csiro.au/computing/software/miriad in mosaic and multifrequency synthesis mode. We performed calibration and editing on each data set individually, before combining all the data. The primary gains were determined using 3C 286 and 3C 48, and phase calibrations were made from observations of 1820-254 (J2000.0). Imaging was performed with Robust weighting as a compromise between maximized signal-to-noise ratio and resolution. We utilized the maximum entropy method algorithm for deconvolution (Cornwell et al., 1999) and applied self-calibration iteratively to improve phase and amplitude calibrations. The final image is corrected for primary-beam attenuation and has a synthesized beam of . This image was then further smoothed with various kernels to bring out specific features to compare with X-ray images.
4. Pulsar-Wind Nebula
Roberts et al. (2003) and Tam et al. (2002) presented the basic properties of the PWN at radio and X-ray wavelengths. The central radio emission shown in Fig. 1 has a spectral index of , while the mean spectral index of the shell is , although there are spatial variations. While the extents of the radio and X-ray PWN are comparable, the interior structures differ substantially (Fig. 2). We estimate the length of the X-ray jets to be about ; they do not have clear radio counterparts. The jet widths are of order . (At 5 kpc, cm.) The radio emission is mainly in filamentary arcs and loops; the outermost loop to the NE appears to bound the X-ray jet.
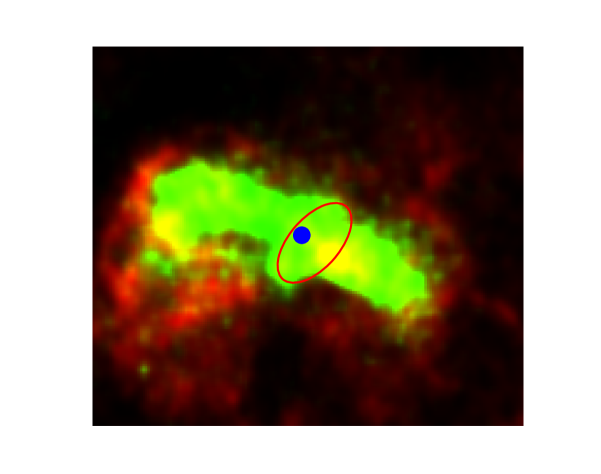
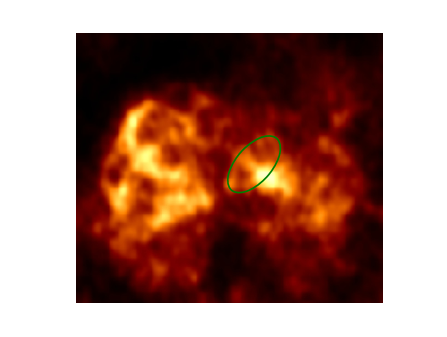
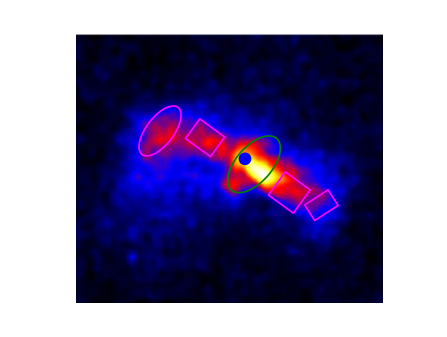
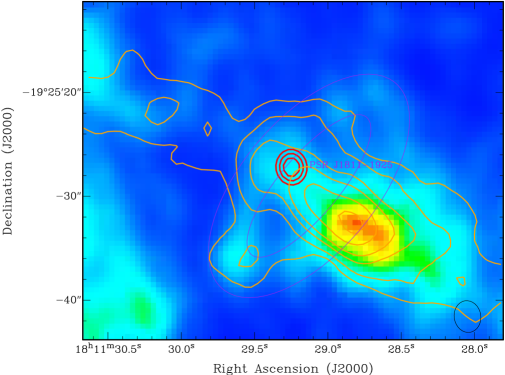
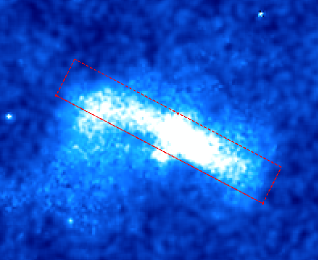
In Figure 3 we compare the structures of the X-ray and radio PWN. While the outer parts are clearly different, both show small scale structure near the pulsar which are similar in extent and overall shape, and are reminiscent of the torus+jet structures seen in the X-ray emission of other PWNe (e.g., Ng & Romani, 2004). What is extraordinary is that these structures are seen in radio as well as in X-rays. Figure 4 shows a close-up of this radio emission, with X-ray contours. There is no evidence of point source emission mJy, consistent with the pulsed upper limits. The putative radio torus is inclined to the line of sight, with a semi-major axis of and an apparent axial ratio of about 2 to 1; a circle in projection would have an axis tilted at to the plane of the sky. The breadth of the torus appears quite narrow, and is unresolved in the 3.5 cm image produced with Robust weighting. To better constrain the thickness of the torus, we created an image with uniform weighting which is less sensitive to larger structures but has a synthesized beam of where the torus thickness may be barely resolved. We put an upper limit on the size of the brightest knots in the torus of corresponding to a physical size of pc at the nominal 5 kpc distance. The radio image also shows a clear inner jet-like structure to the Southwest, with the brightest spot coincident with the brightest time-averaged emission in the X-rays.
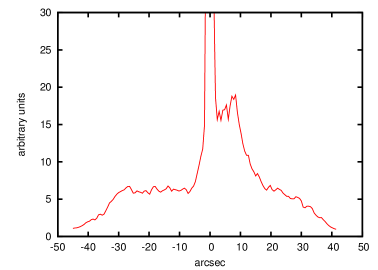
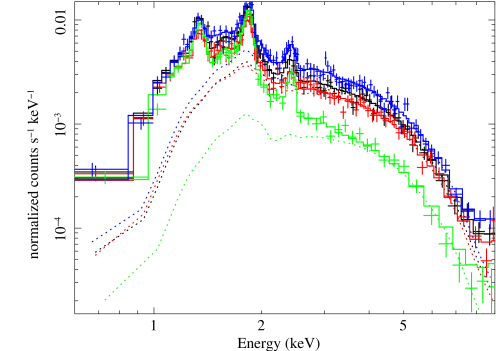
The X-ray jet contains bright knots to the SW (more clearly visible in Fig. 7), while the surface brightness is more uniform to the NE. Figure 5 shows that the mean brightness of the knots is about three times that of the NE jet. These knots have a hard spectrum with a photon index of (errors are 90% confidence intervals). Spectra of selected jet regions (in magenta in Fig. 3) are shown in Figure 6. At low energies, these spectra are dominated by thermal emission produced in the interior of G11.20.3 (and discussed in the next section), while at high energies, nonthermal emission from the jets swamps the much softer thermal interior emission. We used a plane shock with solar abundances together with a power law to model these spectra (plus an additional multicomponent model for the background). The model fits shown in Figure 6 are the result of a joint fit to all four spectra with the power-law index assumed constant along the jets, but allowing for variations in absorption. The value of is , so overall the PWN has a significantly softer spectrum than the bright knots near the pulsar torus. With allowed to vary among regions, we obtain , , , and (moving from the NE to the SW ends of the jet), with the C-statistic value decreasing by only 1.6 relative to the fit with constant throughout the jets. Applying the likelihood ratio test (Cash, 1979), we find that variations in are not statistically significant, so there is no spectral softening along the X-ray jets as one moves away from the pulsar. This constrains the magnetic-field strength and age of the jets (which may be less than the age of G11.20.3). Absence of softening is also consistent with the comparable extents of radio and X-ray nebulae.
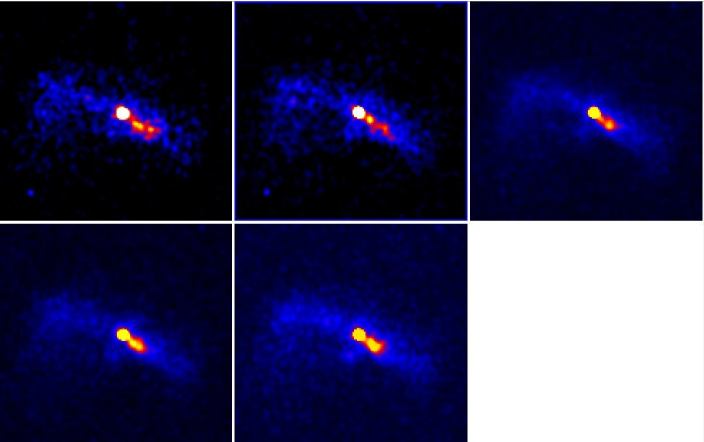
The brighter structures in the PWN clearly change on a timescale of weeks to years (Fig. 7). No systematic motion is apparent, however; the bright knots remain in roughly the same position while substantial brightness changes occur. The ends of the jets do not appear to expand over the 13-year period covered (Fig. 8). We measured expansion of the end of the NE jet using the same method as for expansion of the shell (see § 7 for more details), except that here expansion is measured relative to the pulsar, and we used only high-energy (3.3–8 keV) photons in order to avoid contamination from soft thermal emission that becomes important at low energies (Fig. 6). The end of the NE jet contracted inward (instead of expanding) by % (errors are 90% confidence intervals) during the 11.6 yr that separate the mean epochs of the images shown in Figure 8. (The quoted errors do not include systematic effects introduced by smoothing of long observations from 2013, so this contraction might be underestimated.) The contraction rate is % yr-1, or arcsec yr-1 at the sharp end where the NE jet terminates. There are not enough high energy photons at the end of the SW jet to measure its motion reliably, but a joint fit to both ends of the jets, using regions shown in Figure 8 and assuming a uniform expansion, yields contraction of %, fully consistent with contraction of both jets between 2000–2003 and 2013. Because of the poor photon statistics, it is not clear at this time whether this apparent contraction is caused by systematic long term motions of the ends of the jets, or whether it reflects more complex temporal and morphological variability similar to what is found closer to the pulsar. Long-term variations in the pulsar activity might be responsible for this contraction, or the jets might be hydrodynamically unstable. Alternatively, since, as we argue below, the reverse shock has already arrived at the center and reheated all the ejecta, this interaction may have produced more complex PWN dynamics.
5. Thermal and Nonthermal Interior Emission
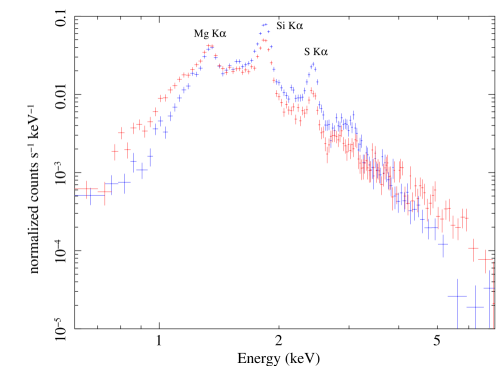
G11.20.3 contains an anomalous bar of interior X-ray emission, running roughly from SE to NW. Its spectrum, from a region close to the PWN but excluding the X-ray jets (and shown in the center of Fig. 11), is compared with the NW region of the shell in Figure 9. It is clearly thermal, with a soft excess compared to the shell, but also with excess emission above about 3 keV, which we attribute to contamination from the outer, fainter parts of the PWN. The PWN appears to occupy a cavity in that bar of thermal emission. Figure 10 compares the soft X-ray image in the Mg K line with the 3.5-cm radio image. A brighter rim can be seen at the SE edge of the PWN. Comparison of the X-ray PWN with the thermal X-ray image (Fig. 11) confirms this conclusion.
The clear interaction of the PWN with the thermal emission indicates that that material is in the remnant interior, and not just projected from the front or back face of the shell. That is, material all the way in to the PWN has been reheated by the reverse shock. This is an important clue to the evolutionary state of G11.20.3, indicating that that state is quite advanced, and suggesting that nearly all the SN ejecta have been shocked by now.
We find no evidence for enhanced abundances in the interior of G11.20.3. While there is a soft excess in the central bar spectrum (Fig. 9), the abundances of Mg, Si, and S whose lines dominate X-ray spectra are not appreciably different than elsewhere in the remnant. It is likely that the X-ray spectrum of the central bar is dominated by the swept-up ambient gas and not the SN ejecta. In view of the advanced evolutionary stage of the remnant, the shocked ejecta must be present there as well, but apparently they do not emit as efficiently as the swept-up ambient medium (at least at X-ray energies high enough for photons to effectively penetrate the intervening ISM).
Contrasting morphologies of G11.20.3 in very soft (0.59 – 0.82 keV) and very hard (5 – 8 keV) X-rays are shown in Figure 12. The very soft, predominantly thermal X-ray emission at the center lacks limb-brightened rims seen in the Mg K line (Fig. 10), while at very high energies nearly all X-rays there come from the PWN and the pulsar. There is a shell visible in hard X-rays but its diameter is substantially smaller than the overall X-ray size of G11.20.3. Within this shell, hard diffuse emission fills the remnant’s interior. This hard X-ray shell roughly coincides with the inner edge of the remnant’s shell, but does not match it well on small spatial scales. Apparently, this interior emission is produced within a spatially-distinct region within G11.20.3. In order to produce such hard ( keV) photons, either hot thermal plasma with a temperature of several keV or nonthermal X-rays are required. There is no trace of the Fe K line in X-ray spectra, so it is possible that this emission is of nonthermal origin. But irrespective of its (thermal or nonthermal) origin, the presence of a very hard X-ray shell in the interior of a dynamically evolved remnant such as G11.20.3 is quite unexpected.
6. G11.20.3 and a Possible SN in CE 386
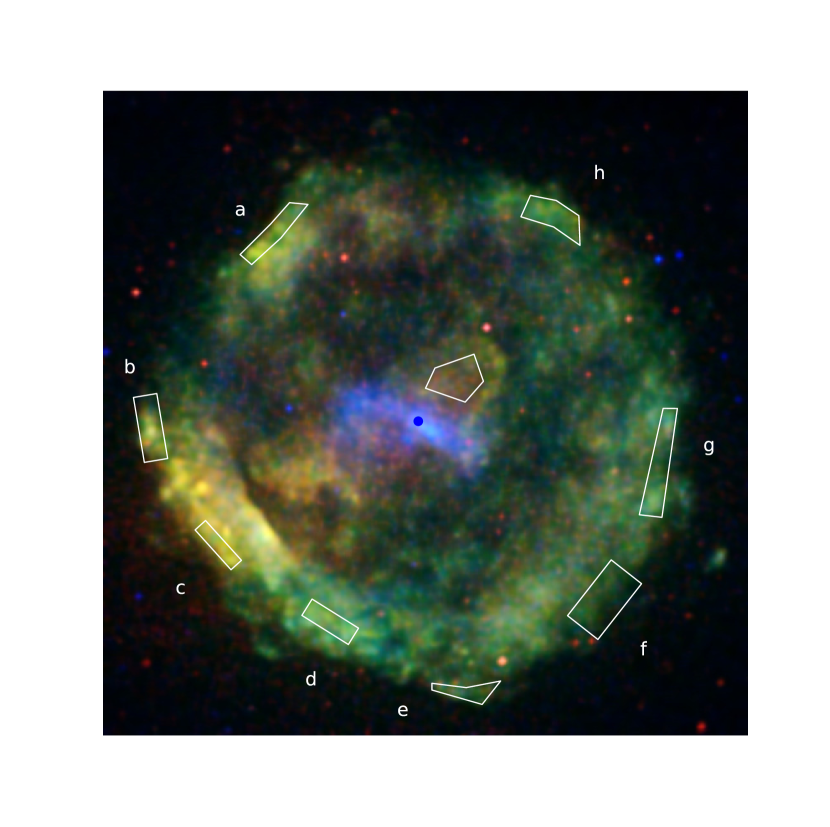
Lee et al. (2013) found very high extinction (–) in their study of 3 IR-bright rims in the SE and S. At 5 kpc distance, the SN would have been fainter than , clearly not compatible with historical reports of a possible SN in CE 386 for even the most luminous SNe. A typical CC SN () could not have been seen by naked eye even if were as low as reported by Lee et al. (2013) in a few spatially localized regions in the SE. We demonstrate here that absorption is high not only in the SE and S, ruling out association of G11.20.3 with a possible SN 386.
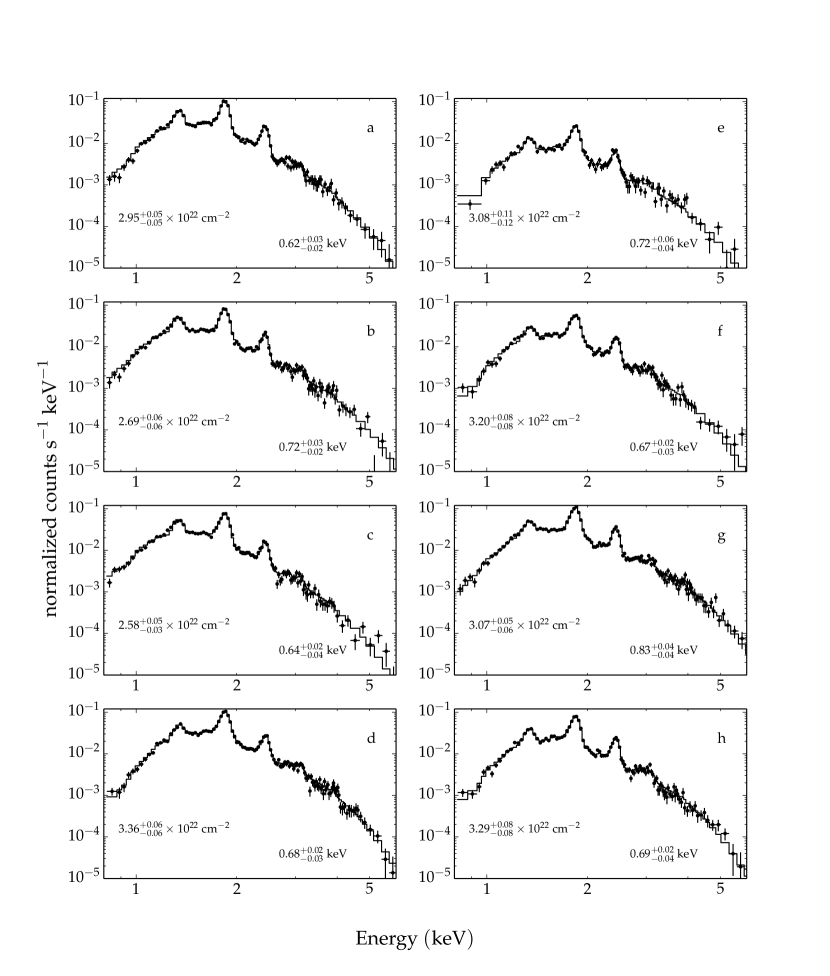
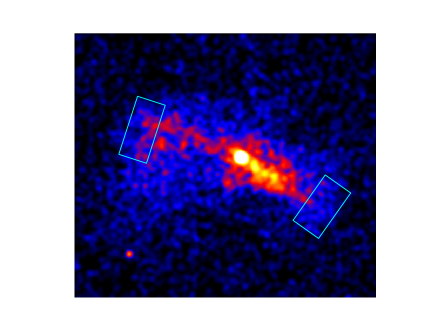
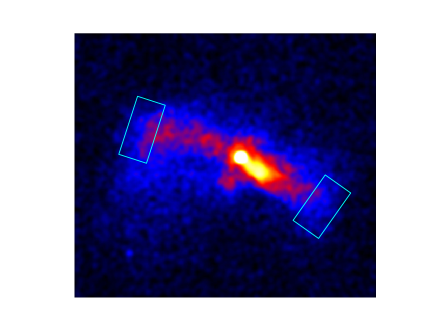
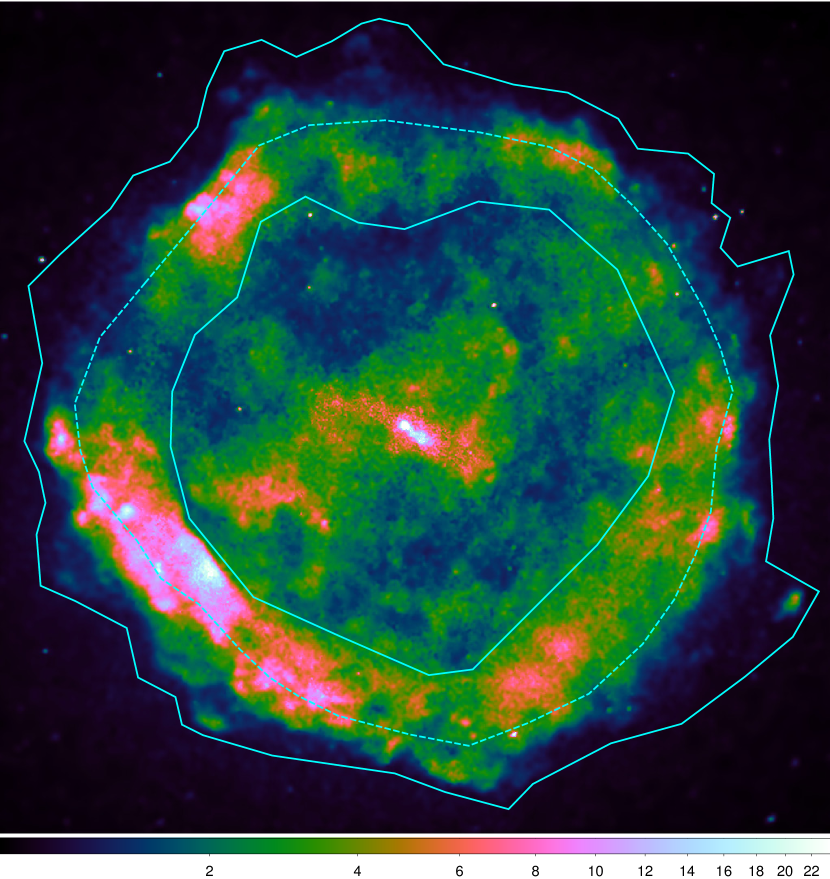
We analyzed X-ray spectra of 8 outer shell sections (see Fig. 11) by fitting them with a plane shock model (vpshock model in XSPEC) with atomic data from AtomDB (Smith et al., 2001; Foster et al., 2012). We assumed solar abundances as given by Grevesse & Sauval (1998) except for Mg, Si, and S whose abundances have been allowed to vary in our fits. As shown in Figure 13, the fitted values of hydrogen column density vary from cm-2 to cm-2, with the least amount of absorption found in the E and SE (regions b and c, consistent with the soft X-ray excess seen there in Figure 11). (Near the pulsar, we find slightly lower (– cm-2) absorption from fits to the spectra in Figure 6, but we consider them less reliable in view of the mixed thermal and nonthermal nature of these interior spectra, and with the thermal interior emission not as well understood as the outer shell emission.) In order to convert from to , we assume the same dust-to-gas mass ratio and the same dust properties as in the dust model of Weingartner & Draine (2001) with , so . This gives in the range from to across the entire remnant, confirming the high absorption derived from IR observations.
Our optical extinction estimates depend on a number of uncertain assumptions, but this is unlikely to affect our conclusions about the non-association of G11.20.3 with a possible SN 386. We assumed solar abundances of Grevesse & Sauval (1998) for both absorbing and X-ray emitting gas, the same solar abundance set used by Weingartner & Draine (2001) in their dust models constrained by observations of dust in the solar vicinity. Since in the inner Galaxy metal abundances are higher than in the solar neighborhood, this leads to an overestimate of (at the high absorption of interest here, heavy elements alone, and not H and He, are responsible for X-ray absorption). But for the same degree of heavy element depletion onto dust expected in the diffuse ISM across the entire Galaxy, remains the same.
Our neglect of X-ray scattering by dust leads to overestimation of both and but this effect is difficult to quantify for spatially-extended sources such as G11.20.3. Reynolds et al. (2009) found a 25% reduction in for the much more compact and much more heavily absorbed ( cm-2) remnant G1.9+0.3 by modeling its dust-scattered X-ray halo. But even such a large and unrealistic reduction in would not make a typical CC SN visible without a telescope at 5 kpc distance. Most likely, this reduction is quite modest for G11.20.3, as our estimates of in regions c and d, and , do not exceed the – found by Lee et al. (2013) in this region of the remnant. (In principle, IR-based estimates of optical extinction should be more reliable than our X-ray-based estimates, but currently there are still uncertainties in atomic data for the [Fe II] transitions used by Lee et al. (2013) to estimate IR extinction (Giannini et al., 2015; Koo & Lee, 2015).)
Recent SNe within the inner Galaxy, such as those that produced G11.20.3 and the youngest known Galactic SNR G1.9+0.3, were too heavily absorbed to be detected at optical wavelengths. If the guest star of 386 were indeed a supernova, it must have been not so distant and heavily absorbed. Lack of a suitable candidate remnant associated with this guest star casts serious doubts about its identification as a supernova event.
7. Shell Expansion
Chandra observed G11.20.3 (catalog ) in 2000 (Epoch I observations), 2003 (Epoch II), and 2013 (Epoch III), over a timespan of nearly 13 yr. This time baseline is long enough to measure expansion of the remnant reliably. We first measured the overall expansion using a variation of the method described in Carlton et al. (2011) (see also Vink, 2008). From the merged 2013 May Chandra data, we extracted a spectral cube, in size, that included counts from the entire remnant in the 0.6–8 keV energy range (spectral channels 41–552). Event positions were binned to about of the ACIS pixel size, so one image pixel is . With spatial pixels, the area encompasses the entire remnant, including the outlying outer knots. Spectral channels were binned by a factor of 4. The 2013 May data cube was then smoothed with the spectro-spatial method of Krishnamurthy et al. (2010), varying a penalty parameter that controls the amount of smoothing. Smoothed datacubes were summed over spectral channels to yield smoothed 0.6–8 keV images. We used these images as a model for the surface brightness of G11.20.3 (catalog ) at Epoch III (see Figure 14 for a model with the penalty parameter of 0.015). These model images (after background subtraction) were then fit to the unsmoothed 0.6–8 keV images from earlier epochs (i.e., shrunk to fit) using the maximum likelihood method (C-statistic; Cash, 1979). We excluded the remnant’s interior in these fits as shown in Figure 14. We also excluded poorly exposed outer sections of the shell at Epoch II. Several point sources were masked out. Spatial variations in effective exposure times were taken into account by correcting model images with the help of monochromatic ( keV) exposure maps. For each observation from Epochs I and II, there are four free parameters in this model: a physical scaling factor, a surface-brightness scaling factor, and image shifts in right ascension and declination . These image shifts allow correction of any misalignment of individual pointings due to the Chandra external astrometric errors (mean error of ; Rots, 2009). They might also be nonzero for perfectly aligned observations in the presence of asymmetric expansion. In this case, expansion measurements reported here provide us with the mean expansion rate of the remnant.
Since our model images only approximate the true surface brightness distribution, model uncertainties contribute to errors in measured expansion rates. We took these systematic effects into account by using the 0.6–8 keV image from 2013 September as the control image. In the 0.32 yr time baseline from 2013 May to September, we expect a negligible (only %) expansion of the remnant. But fits to the 2013 September image, allowing only for changes in the physical scaling and surface brightness factors, revealed systematic trends with the amount of smoothing. Increased smoothing broadens the outer boundary of the remnant, so the model must be shrunk to match unsmoothed data. As the magnitude of this systematic effect is expected to be dependent on the model alone, the physical scaling factor derived from fitting the 2013 September image was used to correct the measured Epoch I and II scaling factors. We verified that the corrected scaling factors showed no significant variations with the amount of smoothing (except for either grossly inadequate or excessive smoothing).
| Baseline | Observation ID | aaBaseline length. | bbAlignment error in right ascension. | ccAlignment error in declination. | ddModel surface brightness scaling. | ExpansioneeValues in brackets are before correction for systematic effects. | Expansion RateeeValues in brackets are before correction for systematic effects. |
|---|---|---|---|---|---|---|---|
| (yr) | (arcsec) | (%) | (% yr-1) | ||||
| 2013 May – 2013 Sep | 0.32 | ||||||
| 2003 – 2013 May | 3909 | 10.01 | 0.043 | 0.054 | |||
| 3910 | 9.88 | 0.043 | 0.053 | ||||
| 3911 | 9.79 | 0.065 | 0.082 | ||||
| 3912 | 9.68 | 0.042 | 0.054 | ||||
| 9.85 | () | () | |||||
| 9.85 | |||||||
| 2000 – 2013 May | 780 | 12.77 | 0.038 | 0.046 | |||
| 781 | 12.58 | 0.050 | 0.056 | ||||
| 2322 | 12.58 | 0.070 | 0.079 | ||||
| 12.69 | () | () | |||||
| 12.69 | |||||||
| (2000+2003) – 2013 May | |||||||
Note. — All errors are .
The measured expansion rates are listed in Table 2 for a model with the penalty parameter of 0.015, together with the alignment errors, surface scaling factors, and physical scaling factors. The mean error on displacements among individual observations is . The surface brightness scaling factors are larger than unity because we used monochromatic exposure maps that do not take into account the continuing decrease in time of the Chandra low-energy sensitivity. The chosen penalty parameter leads to a reasonably smooth model image (Figure 14) without producing any appreciable bias in measured scaling factors. The Epoch I and II observations were fit independently, then corrected for the bias. Errors were added in quadratures. A larger (by %) expansion is found for the Epoch I observations, in agreement with expectations based on the lengths of the time baselines. The corrected expansion rates for Epochs I and II are within measurement errors. Their weighted average is % yr-1.
The inner boundary of the shell is quite sharp in several locations, offering us an opportunity to search for possible variations in expansion across the shell. We divided the shell into inner and outer sections (Figure 14), and measured their expansion rates. The model is based on all 2013 data, and we used the same (0.015) penalty parameter in order to avoid biasing expansion measurements. The Epoch I and II observations were fit simultaneously, assuming constant expansion rates. We refit the whole shell again to verify that this measurement method is consistent with the more rigorous procedure described above. There is excellent agreement between the two methods, as the overall shell expansion is % yr-1 (Table 3). (Errors listed in Table 3 do not include systematic effects.)
| Region | Observation ID | Expansion RateaaErrors do not include model uncertainties. | |||
|---|---|---|---|---|---|
| (arcsec) | (% yr-1) | ||||
| Whole Shell | 3909 | 0.040 | 0.042 | ||
| 3910 | 0.038 | 0.047 | |||
| 3911 | 0.063 | 0.074 | |||
| 3912 | 0.044 | 0.056 | |||
| 780 | 0.036 | 0.045 | |||
| 781 | 0.050 | 0.054 | |||
| 2322 | 0.063 | 0.091 | |||
| Outer Shell | 3909 | 0.054 | 0.056 | ||
| 3910 | 0.061 | 0.066 | |||
| 3911 | 0.075 | 0.082 | |||
| 3912 | 0.067 | 0.061 | |||
| 780 | 0.051 | 0.056 | |||
| 781 | 0.065 | 0.066 | |||
| 2322 | 0.089 | 0.090 | |||
| Inner Shell | 3909 | 0.060 | 0.063 | ||
| 3910 | 0.048 | 0.060 | |||
| 3911 | 0.126 | 0.076 | |||
| 3912 | 0.057 | 0.085 | |||
| 780 | 0.048 | 0.065 | |||
| 781 | 0.058 | 0.067 | |||
| 2322 | 0.088 | 0.099 | |||
Note. — The same notation used as in Table 2.
We detect expansion in both the outer and the inner shell (Table 3). The outer shell expansion rate is % yr-1, marginally faster than for the whole shell. Expansion of the inner shell appears slower by nearly , % yr-1, but the errors are large. No differences in expansion rates are expected in the Sedov phase for remnants expanding either into uniform ambient medium or into the progenitor wind. But the sharp inner edge seen in G11.20.3 (catalog ) is not expected in Sedov models, so any differences in the inner and outer shell expansion rates are of considerable interest for understanding the complex dynamics of the remnant.
Expansion of G11.20.3 (catalog ) at radio wavelengths was determined by comparison of 2001–2002 and 1984–1985 VLA observations at 20 cm and 6 cm (Tam & Roberts, 2003). Our newly-determined expansion rate is in better agreement with the 6 cm rate of % yr-1 than with % yr-1 measured at 20 cm (errors quoted here are the rms deviation about the weighted mean of individual measurements along the remnant’s circumference). As discussed by Tam & Roberts (2003), it is not clear why the radio expansion measurements at 20 cm and 6 cm do not match each other better, but significant and hard to quantify systematic effects might be important in radio interferometric observations. Expansion rates measured with Chandra are less susceptible to systematic errors than the radio rates, so we consider them more reliable.
At the shell’s outer radius of pc (here is the distance in units of 5 kpc), the mean blast wave speed becomes km s-1. (We assumed here that the blast wave radius coincides with the shell’s outer radius, but there is a possibility that the blast wave has already propagated farther out into a low-density ambient medium (Chevalier, 2005). In this case, the blast wave could have also encountered much denser gas in several directions beyond the shell, accounting for the presence of outlying H2 filaments (Koo et al., 2007). However, the absence of radio or X-ray emission would then be hard to explain.) The distance to G11.20.3 (catalog ) has been estimated from H I absorption measurements, ranging from 4.4 kpc (assuming circular Galactic rotation; Green, 2004) to 5.5 – 7 kpc (allowing for noncircular motions; Minter et al., 2008). When combined with uncertainties in the expansion rate measurements, is somewhere within 700–1200 km s-1, corresponding to a mean shock temperature of – keV. This is consistent with X-ray spectra. Vasisht et al. (1996) reported an electron temperature of 0.8 keV by modeling the ASCA spectrum of G11.20.3 (catalog ) with the nonequilibrium ionization spectral model of Masai (1984), while Roberts et al. (2003) found a lower electron temperature of 0.6 keV in the SE using the 2000 Chandra data in combination with vpshock and srcut models in XSPEC (Reynolds & Keohane, 1999; Borkowski et al., 2001). For the small regions shown in Figure 11, our spectral fits result in temperatures ranging from 0.6 keV to 0.8 keV (Fig. 13). We find an intermediate temperature of 0.7 keV by fitting spectra of the inner and outer shell with an APEC-based plane shock model plus a power law component to account for the excess of high-energy photons seen in X-ray spectra. (It is not clear at this time whether this excess is of thermal or nonthermal origin, but the temperature of the bulk of X-ray emitting gas depends only weakly on how this excess is modeled.) The mean shock temperature is expected to be higher than the electron temperature in young SNRs because of the preferential heating of ions in fast collisionless shocks, so there is no obvious conflict between the measured expansion rate and temperature of the X-ray emitting gas for distances between 4.4 and 7 kpc. If kpc then very fast ( km s-1) shocks might be present in G11.20.3 (catalog ).
8. Origin of the Ambient Medium and Age of G11.20.3
The measured expansion rate of % yr-1 allows us to place constraints on the remnant’s age . For a blast wave radius increasing as , , and . The measured expansion rate is equal to , so yr. The upper limit to the remnant’s age is 3600 yr for undecelerated () expansion, but significant deceleration must have taken place in G11.20.3 (catalog ) because of its advanced dynamical age where nearly all of the SN ejecta have been shocked by now. We use self-similar Sedov models to estimate the deceleration parameter . For expansion into uniform ISM, and yr. This might be considered as the lower limit to the remnant’s age. But Chevalier (2005) suggested that the ambient medium in G11.20.3 (catalog ) is of circumstellar origin, and was ejected prior to the SN explosion by its progenitor. For CSM with , produced by steady-state mass loss, and increases by 5/3 to yr. The unknown density distribution of the ambient medium affects our estimates of the remnant’s age to a larger degree than the modest (at most 20%) errors in the measured expansion rates.
Single low-mass CC progenitors do not have strong stellar winds and they do not lose appreciable amounts of mass prior to their explosions. In this case, after passage through a weak stellar wind containing very little mass, the blast wave is expected to expand into the ISM, assumed here to be uniform. (Alternatively, expansion might be into a uniform but low density bubble blown by a fast wind during the main-sequence stage of the progenitor’s evolution.) At the Sedov stage of evolution, the swept-up ISM mass must be significantly larger than the ejecta mass. The mass of X-ray emitting gas in G11.20.3 can be estimated from the X-ray emission measure although results are sensitive to (assumed to be between 4.4 and 7 kpc). At kpc, we obtain cm-3 by fitting an X-ray Sedov model with the mean shock temperature of keV (corresponding to a shock speed of 720 km s-1) to the shell spectrum, and scaling it up by 30% to account for the missing shell emission from the remnant’s center. (The spectral fits are not statistically acceptable, but our goal here is just to obtain rough estimates for . In the spatially-integrated X-ray Sedov models available in XSPEC, the amount of collisionless electron heating at the blast wave, , is assumed not to vary with time, but we considered it as a free parameter in view of our poor knowledge of how electrons are heated in fast collisionless shocks. Electrons are subsequently heated downstream of the blast wave through Coulomb collisions with hot ions, so post-shock electron temperatures depend on the assumed and fitted and ionization timescale . See Borkowski et al. (2001) for more details about these Sedov models.) With pc, the preshock density is 4 cm-3, and the mass of X-ray emitting gas is only 11 . Since the ejecta mass must be more than 6 even for the least massive () CC progenitor, , and the remnant cannot be in the Sedov stage of the evolution. In disagreement with observations, the reverse shock is unlikely to propagate all the way to the center for such a dynamically young remnant. Somewhat better agreement arises if G11.20.3 (catalog ) were much farther away than 4.4 kpc. From X-ray Sedov model fits with keV, we find that is nearly independent of the assumed distance. (When model parameters do not depend on , . But here , and the increased X-ray emissivity of the Sedov model at higher blast wave speeds leads to an approximately constant .) This implies that and , so cm-3 and . At 7 kpc, cm-3 and the total mass of the X-ray emitting gas is about 22 . The ejecta mass comprises of at least of this amount, so the remnant might still not be fully in the Sedov evolutionary stage.
Progenitors significantly more massive than can lose the 10–20 present in G11.20.3 (catalog ). For a single progenitor, this might occur through strong stellar winds, while in close binaries mass loss is further enhanced through tidal interactions. In the Sedov solution with a steady-state stellar wind with (or , where , is the mean mass per hydrogen atom in atomic mass units, and is the proton mass), the emission measure is equal to (for cosmic abundances ). Just as for a uniform ambient medium, the mass of X-ray emitting gas and the ambient density (i.e., or ) can be found by estimating and . Since an X-ray Sedov wind model is not available in XSPEC, we assumed plane-parallel geometry but unequal electron and ion temperatures and used the plane shock models npshock and vnpshock in XSPEC in our estimates of (the X-ray fitting procedure is the same as described above). The estimated emission measures are again around cm-3, but the preshock densities are about half as large ( cm-3 at 4.4 kpc, and cm-3 at 7 kpc) and masses are 50% higher (15–30 ) than for the uniform ambient medium. These lower density and higher mass estimates are caused by differences in the model postshock density distributions (density drops more slowly with decreasing radius in the Sedov wind model than in the standard Sedov model). The wind strength is (where g cm-1), corresponding to yr-1 and km s-1. This is at the upper range of mass-loss rates inferred for Type IIL and IIb SNe (Chevalier, 2009; Smith, 2014).
The post-shock density increases linearly with radius in the Sedov wind model. This results in an X-ray shell with the surface brightness profile of (we assumed here that the X-ray emissivity scales as , and normalized the brightness to a peak of 1). The maximum surface brightness peaks at a rather small () radius, and the shell is not very distinct (the central surface brightness is lower than the peak by only ). Such a thick and indistinct shell is clearly inconsistent with the observations, since the X-ray shell in G11.20.3 (catalog ) is quite prominent and not overly broad. The density must drop quite rapidly toward the center, as evidenced by the sharp inner shell edge at several locations within the remnant. This means that the shocked masses have been overestimated, and preshock densities underestimated when using the Sedov wind model. A wind-like () density distribution for the CSM appears unlikely even if one allows for departures from the Sedov wind model. (This self-similar model is only asymptotically valid in the limit when the shocked ejecta mass is negligible compared to the shocked ambient mass, while young remnants such as G11.20.3 (catalog ) might still be at earlier evolutionary stages). In order to keep fixed while making the shell more prominent than in the Sedov wind model, a decrease in the swept-up mass and an increase in the preshock density would have been required. These two requirements are mutually exclusive under a steady-state mass loss hypothesis. Note that these estimates of preshock densities and shocked CSM masses rely on the assumption that most of the X-ray emission is produced by the swept-up CSM. This assumption is justified given the lack of evidence for enrichment in heavy elements anywhere within the remnant, even in its interior. The shocked ejecta contribution to X-rays might be nonnegligible, but very likely it is not dominant. The CSM in G11.20.3 (catalog ), if present, is likely to have a more complex density distribution than described by a steady-state stellar wind.
A CSM origin for the swept-up gas in G11.20.3 (catalog ) still remains viable although its ambient density distribution is not well described by a steady-state stellar wind. The absence of a sharp and well-defined outer boundary of the remnant might result if the blast wave had already overrun the slow wind of the SN progenitor. But this will not make the X-ray emitting shell more prominent than in the Sedov wind model, and aside from a few isolated outer knots, no widespread X-ray or radio emission is seen beyond the outer shell boundary. A subenergetic explosion might also be required since the shell velocity is rather low. Alternatively, the progenitor’s wind might have been less dense at the very final stages of its evolution prior to the SN, with a significant fraction of mass lost yr before the explosion through a dense and slow outflow. The wind density is generally expected to drop with time when a single massive progenitor moves from red to blue across the HR diagram because of heavy mass loss. The mass-loss history becomes more complex and less understood in close binaries, but steady-state mass loss becomes even less likely. If the progenitor loses enough material to expose its helium core (or nearly expose it with a residual hydrogen envelope still present), a radiatively-driven fast wind is expected to sweep material ejected through slow and dense winds in the prior evolutionary stages into dense shells. The blast wave in G11.20.3 (catalog ) might be now moving through undisturbed CSM lost yr ago when the mass loss rate was much higher than immediately prior to the explosion. Alternatively, the blast wave might be propagating through a dense swept-up shell or it might have already exited into much more tenuous gas located beyond its outer boundary. In either case, the remnant’s dynamics becomes complex, and its understanding requires reliance on hydrodynamical simulations. Within the framework of such future investigations, the measured expansion of the shell is expected to provide refined constraints on the remnant’s age and SN explosion properties.
The strongest evidence for a CSM (as opposed to ISM) origin of the swept-up ambient medium is the presence of strongly asymmetric soft thermal emission in the interior of G11.20.3 (catalog ). Its asymmetric morphology argues strongly against an ISM origin, as this requires a highly improbable density distribution centered around the explosion site. Strongly asymmetric mass loss provides a natural explanation for this interior emission. Such interior emission might become prominent in SNR 1987A once its blast wave envelops its famous bright inner ring, if this ring marks the inner edge of a much larger torus. Another example is provided by the dusty torus in the red supergiant (RSG) WOH G64 in the Large Magellanic Cloud (Ohnaka et al., 2008). With an initial main-sequence mass of 25 and with a total ejected mass of 3–9 , this RSG has already lost a significant fraction of its mass through a highly asymmetric outflow. Such a massive and asymmetric outflow is expected in close binary systems because of tidal effects, although firm evidence for the presence of a binary companion in WOH G64 is still lacking (Levesque et al., 2009). Rotation might also result in a strongly asymmetric outflow even for a single SN progenitor, and both rapid rotation (Chiţă et al., 2008) and binarity (Podsiadlowski et al., 1991) have been invoked as the origin of the observed CSM asymmetry in SNR 1987A.
Extreme asymmetry is expected if most mass was lost by the progenitor when it was undergoing Roche-lobe overflow. A possible detection of a close binary companion to SN 2011dh by Folatelli et al. (2014) suggests that this is how mass was lost by the progenitor of this nearby Type IIb SN. According to the binary evolution model of Benvenuto et al. (2013), confirmed by detection of the companion, the progenitor underwent several episodes of high mass-transfer Roche-lobe overflow. The most recent transfer took place yr prior to the explosion, so massive and asymmetric CSM is expected to be present in SN 2011dh at pc-scale distances from the explosion site.
Systematic theoretical investigations of effects that strongly asymmetric outflows imprint on both SNe and SNRs are lacking. Exploratory 2D hydrodynamical simulations with a strongly asymmetric wind in the context of a Type Ia explosion indicate that the interior emission seen in Kepler’s SNR can be explained in this framework (Burkey et al., 2013). Like Kepler’s SNR for Type Ia explosions, G11.20.3 (catalog ) becomes important for understanding the origin of asymmetric mass loss in CC SNe. The pulsar wind at its center probes the interior of the remnant, while the shocked thermal gas and IR emission provide information about both the shocked ambient gas and the shocked ejecta. There is much to learn by studying G11.20.3 (catalog ) in more detail, but it becomes obvious that multidimensional hydrodynamical simulations are necessary to make further progress. Although Kaplan & Moon (2006) found no IR counterpart to the pulsar that might be expected in the presence of a surviving binary companion bound to the pulsar, the binary could have been disrupted by the explosion. Just as for SNR 1987A, the origin of the CSM asymmetry remains unclear at this time.
9. Pulsar-Wind Nebula Analysis
The confirmation of a young age for G11.20.3, even though it cannot be the result of an event in CE 386, supports the conclusion that the pulsar was born at nearly its present period. For a constant braking index , the true age of the pulsar is given by
| (1) |
Taking a typical braking index of 2.5 and an age estimate of 2000 yr, we find ms, consistent with the estimate of Torii et al. (1999), and implying an initial energy erg, for a moment of inertia of g cm2. Spindown with constant magnetic field and braking index also gives the time-dependence of pulsar luminosity by
| (2) |
with the slowing-down timescale given by
| (3) |
That is, the power input into the PWN from the pulsar has been roughly constant since the supernova.
We can attempt to interpret the brightness ratio between the NE jet and the bright knots in the SW jet as Doppler boosting. For synchrotron emission with photon index , the jet/counterjet brightness ratio, for jets making an angle with the line of sight and traveling at speed , is
| (4) |
where for a continuous jet and for discrete blobs (Lind & Blandford, 1985). We estimate from the torus aspect ratio, and a brightness ratio of 3. Using the expression for a continuous jet, and taking the overall PWN photon index of 1.78, we obtain . Using the knot value of , we find ; and for the discrete blob exponent (with ), we obtain Thus mildly relativistic flow could produce the X-ray brightness ratio we see, as well as account for a similar brightness asymmetry seen at radio wavelengths. These values of are quite typical for pulsar torus/jet models (Ng & Romani, 2004). For , the sky-plane speed would be yr-1, thus requiring about 8 yr to reach the ends of the jet. From standard synchrotron expressions, a magnetic field of less than about 140 G would result in a synchrotron-loss time of 8 yr or greater for electrons radiating 8 keV photons. However, the flow would need to decelerate rapidly downstream of the bright knots, as the jet does not appear to expand (barring some peculiar behavior of magnetic field, such as its rapid disappearance). Rapid deceleration is in fact a consequence of the spherical MHD model of Kennel & Coroniti (1984), though the geometry here is clearly more complex. Some kind of magnetic braking may be involved (Komissarov & Lyubarsky, 2004), as seems to be required in other cases as well. In any case, we can rule out that the knots are moving with anything like ; they would need to be stationary structures such as internal shocks, through which fluid passes.
We point out that while extrapolations of the PWN X-ray power-law spectrum back to the radio result in a “break” frequency of 8 GHz with a change in slope of about 0.5, the expected value for synchrotron losses in a homogeneous source with constant electron injection, this feature in G11.20.3 is unlikely to be due to losses, as it would require a magnetic field strength of about 3 mG for an assumed remnant age of 2000 yr. This value would imply a loss time for 8 keV-emitting electrons less than the 8 yr estimated above by , or about a month, so that the jets could not possibly extend as far as they are observed without clear spectral steepening.
In our interpretation, the PWN has already been compressed by the return of the reverse shock. However, unlike most other PWNe, the much longer pulsar slowdown timescale for G11.20.3 means that the pulsar energy input is about the same as its initial value, rather than far weaker, which is more typical. We interpret the more extended radio and X-ray nebulae as the remnants of the pre-reverse-shock PWN, and the X-ray jets as more recently produced features. The integrated spectrum can then be quite complex (Reynolds & Chevalier, 1984), with multiple bends and breaks between radio and X-rays, even without invoking intrinsic spectral structure in the electron distribution produced at the original pulsar-wind termination shock.
Chevalier (2005) estimates a minimum nonthermal energy for the PWN in G11.20.3 which implies a minimum pressure of about dyn cm-2. While he approximates the PWN as a sphere, the estimate is unlikely to be dramatically in error. It implies a magnetic field of order 50 G, implying an energy loss timescale of about 36 yr for 8 keV-emitting electrons. This in turn requires a mean flow velocity of about 20,000 km s-1 to avoid producing spectral steepening at the jet ends – less than our inferred transrelativistic speeds for Doppler boosting in the knots, but inconsistent with the absence of outward motion of jet ends. This minimum pressure is, however, about two orders of magnitude below the pressure to be expected in the remnant interior if all the SN energy has been thermalized (see below). We discuss this discrepancy in the following section.
10. Discussion and Conclusions
The high visual extinction toward G11.20.3, obtained both from [Fe II] observations (Lee et al., 2013) and from our absorption measurements toward the PWN and the shell, definitively rules out the association of G11.20.3 with any naked-eye event seen on Earth, in particular with the CE 386 event, unfortunately removing G11.20.3 from the short list of SNRs with known ages. However, our mean shell expansion rate of % yr-1 gives an age in a comparable range, for a plausible range of expansion parameter between 0.4 and 2/3, of 1400 – 2400 yr – comparable to the 1629 yr resulting from the CE 386 association. We confirm that G11.20.3 is one of the three or four youngest shell CC remnants in the Galaxy – perhaps third, behind Cas A and Kes 75 (containing a young pulsar, with spindown age 1700 yr; Mereghetti et al. 2002, Livingstone et al. 2006).
In the PWN, we have identified a torus-like structure in radio and X-rays. Such structures are commonly seen in PWNe, but only in X-rays; a sharply defined radio torus jet is unique to G11.20.3. Furthermore, the jet in G11.20.3 completely dominates the torus – in fact, the bulk of the X-ray PWN emission is from the jet, unlike most PWNe with jet/torus structure. We attribute this characteristic to the very long pulsar slowdown timescale, so that the pulsar energy input is almost the same as at birth. Mildly relativistic outflow could explain the brightness asymmetry between SW and NE jets, though this interpretation is not without problems.
Our X-ray spatial analysis shows several anomalous features for a shell SNR. The presence of significant asymmetric interior emission requires significant departures from the simple self-similar driven wave or Sedov evolutionary phases. The sharp inner edge of the outer shell and the hard X-ray emission found near this edge are unexplained in any simple picture. No sharp X-ray rims are found, unlike all young Type Ia remnants, where they are found to have nonthermal spectra and indicate significant magnetic-field amplification (Parizot et al., 2006). (Some CC remnants also show these rims, such as Cas A and the X-ray-synchrotron-dominated remnants G347.30.5 (RX J1713.73946) and G266.21.2 (RX J0852.04622). See Reynolds et al. (2012) for discussion and references.)
The X-ray spectrum of the shell can be reasonably well described by a thermal, plane-shock model with temperatures of 0.6 – 0.8 keV, consistent with inferred shock velocities ranging from 700 km s-1 (at 4.4 kpc; Green, 2004) to 1100 km s-1 (at the largest allowed distance of 7 kpc; Minter et al., 2008) that are required to account for the measured expansion of the shell. The emission measures from fits with a more-sophisticated X-ray Sedov model indicate a mass of X-ray emitting gas of about , too low for the remnant to be fully in the Sedov stage of evolution into a uniform medium. The bar of central emission running at roughly position angles (100∘ – 280∘) has a thermal spectrum, with no clear evidence for enhanced abundances. The presence of thermal emission near the center of the remnant, and clear morphological correspondences between the inner thermal emission and the PWN, indicate that the reverse shock has already returned to the center and re-shocked all the SN ejecta. Since it is expected (e.g., Chevalier, 2005) that G11.20.3 is expanding into a stellar wind, a reanalysis of the spectrum for a wind model increases the inferred shocked mass to 15 – 30 . However, the predicted morphology of a remnant running into a uniform density profile is not consistent with the sharp shell we observe. The assumption of a smooth, spherically symmetric wind CSM is apparently far too simple to explain what we see in G11.20.3.
We summarize here the scenario we propose for this complex object. We adopt Chevalier’s (2005) classification of G11.20.3 as resulting from a category of supernovae exploding after losing most of their envelopes (several solar masses) prior to explosion. Such substantial mass loss is likely to be quite asymmetric, perhaps due to a binary companion, and we invoke the possibility of a disk wind.
After the explosion, the supernova blast wave has encountered this lost mass, both radially and azimuthally inhomogeneous, and has by now swept up of order 10 solar masses. The density currently just ahead of the blast wave is quite low, resulting in a diffuse rather than sharp outer edge of shell emission. The reverse shock has moved all the way back to the center, reheating all ejecta, but CSM inhomogeneities have left characteristic imprints, such as the sharp inner edges of the outer shell visible in some locations and the limb-brightened hard X-ray emission in the remnant’s interior. We interpret the presence of hard X-rays near the inner edge of the remnant’s outer shell as evidence for an abrupt change in the density distribution of the ambient CSM. This is consistent with the sharp inner edge of the shell. The shocked low-density gas in the interior of the remnant, including the bulk of the SN ejecta, does not radiate as efficiently as the much denser material in the outer shell, so it is difficult to detect its faint thermal X-ray emission against the bright shell. Only the most dense shocked ambient gas is visible in thermal X-rays as the anomalous bar of interior emission. X-ray emission from the more tenuous gas is clearly seen only at high photon energies where gas in the shell radiates less efficiently because of its low (0.6 – 0.8 keV) temperature. This emission might be of nonthermal origin. (Electrons radiating 8-keV synchrotron photons can survive for yr if G, as might be true in the low-density interior. Internal diffuse X-ray synchrotron emission is also seen in the comparably-aged remnant RCW 86 [Williams et al. 2011], a remnant thought to result from a cavity explosion.) Shocked ejecta have been unambiguously detected only in some very dense clumps which have cooled and are the source of the observed [Fe II] near-IR emission. The pulsar was born with a very low velocity and is still near the remnant center. The PWN it produced has been compressed by the return of the reverse shock, but in a fairly symmetrical fashion. The pulsar continues to inject relativistic fluid into the PWN, in a jet/torus configuration in which the jets, rather than the torus, are the most apparent.
This scenario can accommodate most of what is known about G11.20.3, but leaves many important questions unanswered. Most prominent is the nature of the mass lost: evidently its spatial distribution is uneven in all respects. The inferred density discontinuity in the CSM density distribution points to a major change in the nature of mass loss after ejection of the bulk of the stellar envelope in slow and dense outflows. It is possible that the progenitor was a compact blue star at the time of the explosion, with only a residual hydrogen envelope left on top of its nearly stripped helium core. This would have resulted in a (compact) cIIb SN (Chevalier & Soderberg, 2010) instead of a IIL or an (extended) eIIb SN expected for much larger red or yellow supergiant progenitors that suffered substantial but not so extreme mass loss. Alternatively, the entire H envelope might have been stripped, and the SN was of Type Ibc. Most Type cIIb/Ibc SNe arise from explosions of tidally-stripped binary progenitors with main-sequence masses less than rather than from explosions of the classical Wolf-Rayet stars originating in more massive stars (Smith, 2014). The progenitor of G11.20.3 was likely a low-mass He star in a close binary system, possibly with a residual H envelope still present as inferred and modeled for the Type cIIb SN 2008ax (Chevalier & Soderberg, 2010; Folatelli et al., 2015). Such compact progenitors of Type cIIb/Ibc SNe lose mass in fast stellar winds that compress denser and more slowly moving material ejected in the prior evolutionary stages into dense shells, with the low-density shocked fast wind filling the interiors of these shells. Their strong ultraviolet radiation heats dust that is present in these shells. Progenitor systems similar to what we infer for G11.20.3, consisting of a low-mass He star, a binary companion that is necessary to strip the H envelope, and a compact IR-emitting shell, are likely present among many compact circumstellar bubbles discovered by Spitzer that are powered by massive stars (Wachter et al., 2010; Gvaramadze et al., 2010; Flagey et al., 2014).
The nature of interior material is, however, still debatable. While CSM in a disk is a likely arrangement for strongly asymmetric dense CSM swept up by the fast wind of a stripped-envelope progenitor, it is also possible that this material is highly asymmetric ejecta. While spectral analysis does not show obvious heavy-element enhancements anywhere in G11.20.3, a mixture of shocked CSM and ejecta might not show clear spectral signatures, particularly if the ejecta were much cooler than the CSM. A mechanism for producing such asymmetric ejecta is unknown at this time.
The thermal pressure in the outer shell is several dyn cm-2, and we expect a comparable central pressure if all the SN energy has been thermalized. The estimate of a central thermal pressure of at least dyn cm-2, which results from the assumption that only mild pressure variations are present within the interior of G11.20.3, causes serious difficulties in interpreting the PWN. We showed above that the minimum (equipartition) nonthermal pressure in the PWN is two orders of magnitude less. Now there is no guarantee that equipartition must hold. However, if the magnetic energy dominates, bringing the PWN pressure up to the central thermal pressure would require a magnetic-field strength of about 0.6 mG, in which synchrotron lifetimes of 8 keV-emitting electrons would be only one year – clearly at odds with the lack of spectral steepening in the jets (which are 2 – 3 lt-yr long). The maximum magnetic-field strength consistent with that constraint is about 0.2 mG, providing only one-tenth the required pressure. If the PWN is particle-dominated, not an impossibility, the magnetic-field strength is basically unconstrained. 3-D relativistic MHD simulations (Porth et al., 2014) show that magnetic dissipation can lower the magnetic energy to a small fraction of the particle energy. These simulations also show that a young PWN is a complex object, with strong departures from symmetry in magnetic-field strength and (to some extent) in pressure, so all conclusions drawn from assumptions of spherical symmetry should be regarded as provisional.
The high external pressure also implies a pulsar-wind termination shock radius given by
| (5) |
or about , far smaller than the size of the torus – but given the drastic oversimplifications (mainly spherical symmetry) under which this simple estimate is obtained, perhaps this is not a concern. In any case, the inner edge of the torus, where the shock would be located, could well be at a much smaller radius.
The inferred thermal pressure, while high, implies a low explosion energy for a distance of 4.4 kpc: erg. (We accounted for the kinetic energy of the shell in our estimates of the explosion energy but it is a minor (20%–25%) contribution to the total energy budget.) This estimate scales with the volume, or more accurately, erg; at 7 kpc it rises by about a factor of 4, more consistent with a typical CC explosion. It is possible that the outer shell we observe is not the outermost extremity of the SNR. In addition to a few obvious knots at larger radii, it is possible that hot thermal material is able to “leak” through the shell in spots, where if the density is sufficiently low it might not be readily detectable in X-rays or infrared. However, it would be more difficult to hide such material from a deep radio image, so it would be worthwhile to revisit G11.20.3 with the greatly enhanced capabilities of the JVLA to (among other goals) search for such a halo. If present, this halo might also shed light on the origin of outlying H2 filaments found by Koo et al. (2007). It is possible that these filaments mark locations where the blast wave has encountered much denser than average material after breaking through the shell.
The ejecta of a stripped-envelope SN contain little (if any) H, while dense CSM swept up by the blast wave consists mostly of H. The shocked CSM and the shocked ejecta in G11.20.3 can be distinguished by the presence or absence of H lines in their near-IR spectra and by their kinematics. Koo et al. (2007) detected the Br line in a spectrum of the brightest emission filament in the SE, and H2 emission lines in a spectrum of a spatially-localized region in the S, so the emission there comes mostly from shocked CSM. Highly blueshifted ( km s-1) knots near the center are devoid of H (Moon et al., 2009), consistent with ejecta of a stripped-envelope SN. The shocked, H-rich CSM has been accelerated by the blast wave, but its velocity is expected to be at most one or two hundred km s-1, far less than the km s-1 found for the H-poor ejecta. Moon et al. (2009) proposed that the ejecta are rich in Fe, but other elements such as He might still be dominant. (The upper limit to the strength of the He I 1.083 m line cited by Moon et al. (2009) is not particularly constraining.) Deeper spectra are needed in order to learn more about the composition of the IR-emitting ejecta, but we predict that little (if any) H will be found within the SN ejecta.
Further understanding of this interesting object will require multi-dimensional hydrodynamic simulations, which can test some of the features of our proposed scenario. Additional observational efforts in radio and in near-IR are the most likely to cast additional light. A search for a possible surviving binary companion would be quite challenging but, if successful, would be a major advance. G11.20.3 serves as additional evidence, if any were needed, that supernovae, and their remnants, are fundamentally three-dimensional objects, and their full understanding will require three-dimensional theory.
References
- Andersen et al. (2011) Andersen, M., Rho, J., Reach, W. T., Hewitt, J. W., & Bernard, J. P. 2011, ApJ, 742, 7
- Arendt (1989) Arendt, R. G. 1989, ApJS, 70, 181
- Arnaud (1996) Arnaud, K. A. 1996, in Astronomical Data Analysis and Systems V, eds. G. Jacoby & J. Barnes, ASP Conf. Series, v.101, 17
- Becker et al. (1985) Becker, R. H., Markert, T., & Donahue, M. 1985, ApJ, 296, 461
- Benvenuto et al. (2013) Benvenuto, O. G., Bersten, M. C., & Nomoto, K. 2013, ApJ, 762, 74
- Borkowski et al. (2001) Borkowski, K. J., Lyerly, W. J., & Reynolds, S. P. 2001, ApJ, 548, 820
- Burkey et al. (2013) Burkey, M., Reynolds, S. P., Borkowski, K. J., & Blondin, J. M. 2013, ApJ, 764:63
- Carlton et al. (2011) Carlton, A. K., Borkowski, K. J., Reynolds, S. P., et al. 2011, ApJ, 2011, 737:L22
- Cash (1979) Cash, W. 1979, ApJ, 228, 939
- Chevalier (2005) Chevalier, R. A. 2005, ApJ, 619, 839
- Chevalier (2009) Chevalier, R. A. 2009, in Proc. Space Telescope Science Institute Symposium Series No. 20, Eds. M. Livio & E. Villaver (Cambridge University Press), 199
- Chevalier & Soderberg (2010) Chevalier, R. A., & Soderberg, A. M. 2010, ApJ, 711, L40
- Chiţă et al. (2008) Chiţă, S. M., Langer, N., van Marle, A. J., García-Segura, G., & Heger, A. 2008, A&A, 488, L37
- Cornwell et al. (1999) Cornwell, T., Braun, R., & Briggs, D. S. 1999, Synthesis Imaging in Radio Astronomy II, 180, 151
- Downes (1984) Downes, A. 1984, MNRAS, 210, 845
- Flagey et al. (2014) Flagey, N., Noriega-Crespo, A., Petric, A., & Geballe, T. R. 2014, AJ, 148, 34
- Folatelli et al. (2014) Folatelli, G., Bersten, M. C., Benvenuto, O. G., et al. 2014, ApJ, 793:L22
- Folatelli et al. (2015) Folatelli, G., Bersten, M. C., Kuncarayakti, H., et al. 2015, ApJ, 811:147
- Foster et al. (2012) Foster, A. R., Ji, L., Smith, R. K., & Brickhouse, N. S. 2012, ApJ, 756, 128
- Froebrich et al. (2015) Froebrich, D., Makin, S. V., Davis, C. J., et al. 2015, MNRAS, 454, 2586
- Giannini et al. (2015) Giannini, T., Antoniucci, S., Nisini, B., et al. 2015, ApJ, 798:33
- Green (2004) Green, D. A. 2004, BASI, 32, 335
- Green (2011) Green, D. A. 2011, BASI, 39, 289
- Green et al. (1988) Green, D. A., Gull, S. F., Tan, S. M., & Simon, A. J. B. 1988, MNRAS, 231, 735
- Grevesse & Sauval (1998) Grevesse, N., & Sauval, A. J. 1998, Space Sci. Rev., 85, 1
- Gvaramadze et al. (2010) Gvaramadze, V. V., Kniazev, A. Y., & Fabrika, S. 2010, MNRAS, 405, 1047
- Hester (2008) Hester, J. J. 2008, ARA&A, 46, 127
- Kaplan & Moon (2006) Kaplan, D. L., & Moon. D.-S. 2006, ApJ, 644, 1056
- Kaspi et al. (2001) Kaspi, V. M., Roberts, M. S. E., Vasisht, G., et al. 2001, ApJ, 560, 371
- Kennel & Coroniti (1984) Kennel, C. F., & Coroniti, F. V. 1984, ApJ, 283, 694
- Kilpatrick et al. (2016) Kilpatrick, C. D., Bieging, J. H., & Rieke, G. H. 2016, ApJ, 816:1
- Komissarov & Lyubarsky (2004) Komissarov, S. S., & Lyubarsky, Y. E. 2004, MNRAS, 349, 779
- Koo & Lee (2015) Koo, B.-C., & Lee, Y.-H. 2015, PKAS, in Proc. 12th Asia-Pacific Regional IAU Meeting (arXiv:1502.00048)
- Koo et al. (2007) Koo, B.-C., Moon, D.-S., Lee, H.-G., et al. 2007, ApJ, 657, 308
- Kothes & Reich (2001) Kothes, R., & Reich, W. 2001, A&A, 372, 607
- Krishnamurthy et al. (2010) Krishnamurthy, K., Raginsky, M., & Willett, R. 2010, SIAM J. Imaging Sci., 3, 619
- Lee et al. (2013) Lee, H.-G., Moon, D.-S., Koo, B.-C., et al. 2013, ApJ, 770, 143
- Levesque et al. (2009) Levesque, E. M., Massey, P., Plez, B, & Olsen, K. A. G. 2009, AJ, 137, 4744
- Lind & Blandford (1985) Lind, K., & Blandford, R. D. 1985, ApJ, 295, 358
- Livingstone et al. (2006) Livingstone, M. A., Kaspi, V. M., Gotthelf, E. V., & Kuiper, L. 2006, ApJ, 647, 1286
- Masai (1984) Masai, K., 1984, J. Quant. Spectrosc. Rad. Transf., 51, 211
- Mereghetti et al. (2002) Mereghetti, S., Bandiera, R., Bocchino, F., & Israel, G. L. 2002, ApJ, 574, 873
- Minter et al. (2008) Minter, A. H., Camilo, F., Ransom, S. M., Halpern, J. P., & Zimmerman, N. 2008, ApJ, 676, 1189
- Moon et al. (2009) Moon, D.-S., Koo, B.-C., Lee, H.-G., et al. 2009, ApJ, 703, L81
- Ng & Romani (2004) Ng, C.-Y., & Romani, R. W. 2004, ApJ, 601, 479
- Ohnaka et al. (2008) Ohnaka, K., Driebe, T., Hofmann, K.-H., Weigelt, G., & Wittkowski, M. 2008, A&A, 484, 371
- Parizot et al. (2006) Parizot, E., Marcowith, A., Ballet, J., & Gallant, Y. A. 2006, A&A, 453, 387
- Pinheiro Gonçalves et al. (2011) Pinheiro Gonçalves, D., Noriega-Crespo, A., Paladini, R., Martin, P. G., & Carey, S. J. 2011, AJ, 142, 47
- Podsiadlowski et al. (1991) Podsiadlowski, P., Fabian, A. C., & Stevens, I. R. 1991, Nature, 354, 43
- Porth et al. (2014) Porth, O., Komissarov, S. S., & Keppens, R. 2014, MNRAS, 438, 278
- Reach et al. (2006) Reach, W. T., Rho, J., Tappe, A., et al. 2006, AJ, 131, 1479
- Reynolds et al. (2009) Reynolds, S. P., Borkowski, K. J., Green, D. A., et al. 2009, ApJ, 695, L149
- Reynolds & Chevalier (1984) Reynolds, S. P., & Chevalier, R. A. 1984, ApJ, 278, 630
- Reynolds et al. (2012) Reynolds, S. P., Gaensler, B. M., & Bocchino, F. 2012, SpSciRev, 166, 231
- Reynolds & Keohane (1999) Reynolds, S. P., & Keohane, J. W. 1999, ApJ, 525, 368
- Reynolds et al. (1994) Reynolds, S. P., Lyutikov, M., Blandford, R. D., & Seward, F. D. 1994, MNRAS, 271, L1
- Roberts et al. (2005) Roberts, M. S. E., Lyutikov, M., Gaensler, B. M., et al. 2005, in “X-Ray and Radio Connections” (eds. L.O. Sjouwerman and K.K. Dyer), published electronically by NRAO (http://www.aoc.nrao.edu/events/xraydio)
- Roberts et al. (2004) Roberts, M. S. E., Lyutikov, M., Kaspi, V. M., & Tam, C. R. 2004, BAAS, 36, 1522
- Roberts et al. (2003) Roberts, M. S. E., Tam, C. R., Kaspi, V. M., et al. 2003, ApJ, 588, 992
- Rots (2009) Rots, A. 2009, Determining the Astrometric Error in CSC Source Positions, http://cxc.harvard.edu/csc/memos/files/Rots_CSCAstrometricError.pdf
- Salmon et al. (2014) Salmon, J., Harmany, Z., Deladalle, C.-A., & Willett, R. 2014, J. Math. Imaging Vis., 48, 279
- Sault & Killeen (1999) Sault, R. J., & Killeen, N. E. B. 1999, The MIRIAD User’s Guide (Sydney: ATNF)
- Smith (2014) Smith, N. 2014, ARA&A, 52, 487
- Smith et al. (2001) Smith, R. K., Brickhouse, N. S., Liedahl, D. A., & Raymond, J. C. 2001, ApJ, 556, L91
- Stephenson & Green (2002) Stephenson, F. R., & Green, D. A. 2002, Historical Supernovae and their Remnants (Oxford: Oxford University Press)
- Tam & Roberts (2003) Tam, C., & Roberts, M. S. E. 2003, ApJ, 598, L27
- Tam et al. (2002) Tam, C., Roberts, M. S. E., & Kaspi, V. M. 2001, ApJ, 572, 202
- Torii et al. (1997) Torii, K., Tsunemi, H., Dotani, T., & Mitsuda, K. 1997, ApJ, 489, L145
- Torii et al. (1999) Torii, K., Tsunemi, H., Dotani, T., et al. 1999, ApJ, 523, L69
- Vasisht et al. (1996) Vasisht, G., Aoki, T., Dotani, T., Kulkarni, S. R., & Nagase, F. 1996, ApJ, 456, L59
- Vink (2008) Vink, J. 2008, ApJ, 689, 231
- Wachter et al. (2010) Wachter, S., Mauerhan, J. C., Van Dyk, S. D., et al. 2010, AJ, 139, 2330
- Weingartner & Draine (2001) Weingartner, J. C., & Draine, B. T. 2001, ApJ, 548, 296
- Williams et al. (2011) Williams, B. J., Blair, W. P., Blondin, J. M., et al. 2011, ApJ, 741:96