Diffuse Low-Ionization Gas in the Galactic Halo Casts Doubts on WHIM Detections
Abstract
In this Letter we demonstrate that the two claims of OVII K absorption lines from Warm Hot Intergalactic Medium (WHIM) along the lines of sight to the blazars H 2356-309 (Buote et al., 2009; Fang et al., 2010) and Mkn 501 (Ren, Fang & Buote, 2014) are likely misidentifications of the OII K line produced by a diffuse Low-Ionization Metal Medium in the Galaxy’s Interstellar and Circum-Galactic mediums. We perform detailed modeling of all the available high signal-to-noise Chandra LETG and XMM-Newton RGS spectra of H 2356-309 and Mkn 501 and demonstrate that the WHIM absorption along these two sightlines is statistically not required. Our results, however, do not rule out a small contribution from the OVII K absorber along the line of sight to H 2356-309. In our model the temperature of the putative WHIM filament is T K and the OVII column density is N cm-2, twenty times smaller than the OVII column density previously reported, and now more consistent with the expectations from cosmological hydrodynamical simulations.
keywords:
Absorption Lines, ISM, Galaxy, WHIM1 Introduction
According to all hydro-dynamical simulation for structure formation run in the framework of a CDM Cosmology, large concentrations of galaxies are the best tracers of the filamentary web of dark-matter that our local Universe is made of. Embedded into these filaments of shining ordinary matter (stars in galaxies), should be hidden the, still to be found, largest reservoir of baryons in the local Universe: the so called Warm-Hot Intergalactic Medium (WHIM: e.g Cen & Ostriker, 2006). This, metal enriched (through galaxy-IGM feedback), otherwise primordial, medium should have temperatures in the range logT (in K), and very low baryon densities cm-3. At such temperatures, H and He are mostly fully ionized (and so very difficult to detect), and the most abundant metal, oxygen, is mainly present in its stable He-like form: OVII. The strongest bound-bound transition of the OVII ion is the K at Å, and should thus imprint absorption lines in the soft X-ray spectra of background objects whose lines of sight cross one or more WHIM filaments between us and the target. However, these lines are expected to be extremely weak. Expected OVII column densities along a random line of sight crossing a WHIM filament, are Nfew cm-2 (e.g. Cen & Fang, 2006), giving rise to redshifted OVII K absorption lines with EW mÅ. For these reasons detecting the WHIM has proven to be very challenging. The few detections so far, for the majority of the WHIM at logT, are either highly controversial (e.g. Nicastro et al., 2005a,b), or single-line and low statistical significance (e.g. Mathur, Weinberg & Chen, 2003, Nicastro, 2010, Zappacosta, 2012).
Perhaps the only exception that seemed to have gathered the largest consensus (e.g. Tananbaum et al., 2014) despite the large - compared to typical WHIM expectations - EW and associated OVII column density reported by the authors (EW= mÅ), is the proposed detection of a single-line (OVII K) WHIM filament at the redshift of the Sculptor Wall, reported by Buote et al. (2009: hereinafter B09) and Fang et al. (2010: hereinafter F10) along the line of sight to the blazar H 2356-309. Recently, the same authors reported yet another evidence for a new OVII K WHIM absorber, again at , along the line of sight to the blazar Mkn 501 (Ren, Fang & Buote, 2014: hereinafter RFB14). Indeed, the OVII K resonant line shifts to Å at , a redshift consistent with both the and intervals at which the Sculptor Wall and the Hercules Supercluster cross the lines of sight to H 2356-309 and Mkn 501, respectively. For this reason B09, F10 and RFB14, identified the lines detected in the LETG and RGS spectra of these two blazars at Å (the average and maximum semi-dispersion of the two measurements in the LETG and RGS spectra of H 2356-309, respectively: F10) and Å (RFB14), as redshifted OVII K imprinted by two WHIM filaments permeating the two large scale structures of galaxies, the Sculptor Wall and the Hercules Superstructures.
In a companion paper (Nicastro et al., 2015: hereinafter N15), we present a systematic study of the cold and mildly ionized Interstellar (ISM) and Circum-Galactic (CGM) medium of our Galaxy through the modeling of the OI K ( Å), OII K ( Å) and OII K ( Å) absorption lines imprinted by our Galaxy’s ISM/CGM in the spectra of two distinct samples of Galactic and extragalactic sources. In particular, the OII K transition, firstly identified by Gatuzz et al., (2013a,b), is the weak (oscillator strength , Behar, private communication) inner shell transition of the N-like (7 electrons) ion of oxygen. This line is hinted at in 9 of the 20 Galactic X-ray Binary (XRB) spectra and 8 out of the 29 AGN spectra of the N15 sample, and has an average rest-frame wavelength of Å. The 8 AGNs of the N15 sample, in whose spectra the OII K absorption line is hinted at, include the two blazars H 2356-309 (, Jones et al., 2009) and Mkn 501 (, Falco et al., 2000), for which the same line had been instead identified as intervening OVII K absorption tracing WHIM filaments (B09, F10 and RFB14).
Here we re-analyze all the available high resolution X-ray spectra of the two sightlines towards H 2356-309 and Mkn 501 and demonstrate that, even for these two sightlines, the most likely identification of the Å line is indeed that of a OII K transition imprinted by a large amount of Low-Ionization Metal Medium (LIMM) that permeates the halo of our Galaxy, at large distances from the Galactic plane and perhaps up to the Galaxy’s CGM (N15). This, at least for the line of sight to H 2356-309 (the only one for which both the K and K transitions of OII are detectables) does not completely rule out a possible contribution, at exactly the same wavelengths, by redshifted OVII K, but dramatically limits it to an OVII column density more than ten times lower than that claimed by B09 and F10.
2 Data Reduction and Analysis
We reduced and analyzed archival HRC-LETG and RGS data of the two blazars H 2356-309 and Mkn 501. The data of H 2356-309 include 11 HRC-LETG observations and 9 XMM-RGS observations, while Mkn 501 has only 6 XMM-RGS observations. All data were reduced with the latest versions of the XMM-Newton and Chandra data reduction and analysis softwares (“Science Analysis System”, Gabriel et al., 2004 - SAS - v. 13.5.0, and “Chandra Interactive Analysis of Observation”, Fruscione & Siemiginowska, 1999 - CIAO - v. 4.6.1) and calibrations (automatically set according to the given observation, for XMM-Newton data, and CALDB v. 4.6.2 for Chandra). We followed the appropriate XMM-Newton and Chandra data reduction/analysis threads and documentation to extract “cleaned” (excluding periods of high background) LETG and RGS spectra and responses for all observations and co-added their spectra to maximize the SNRE (we also checked, a-posteriori, that all the results of our fitting procedures to the co-added spectra of H 2356-309 and Mkn 501 where confirmed by simultaneous fitting of the individual spectra of the two sources).
The final spectra of our two targets total 193 ks (Mkn 501, XMM-RGS), 649 ks (H 2356-309, XMM-RGS) and 466 ks (H 2356-309, HRC-LETG).
2.1 Spectral Fitting
We used the fitting package Sherpa, in CIAO (Freeman, Doe & Siemignowska, 1999) to perform spectral fitting of the RGS and LETG spectra of our targets, in the 6-30 Å (RGS) and 6-50 Å (LETG) intervals, with the main aim to disentangle local (i.e. ) absorption from our own Galaxy’s ISM/CGM, from intervening absorption from putative WHIM filaments along the lines of sight to our two targets.
Following the procedure described in N15, we first modeled the continuum of our targets with a power-law (model xspowerlaw in Sherpa) attenuated by neutral absorption (the XSPEC-native model xstbabs in Sherpa: Wilms, Allen & McCray, 2000). The best-fitting pure-continuum statistics for our three spectra are (LETG spectrum of H 2356-309), (RGS1+RGS2 spectra of H 2356-309) and (RGS1+RGS2 spectra of Mkn 501).
Figure 1 shows the 21.5-24 Å portions of the best-fitting pure-continuum model residuals (in standard deviations) of the LETG and RGS spectra of H 2356-309 and MKn 501. In the RGS panels, the green segments mark the spectral intervals where the presence of RGS instrumental features (bad pixels) hamper the search for unresolved absorption lines.
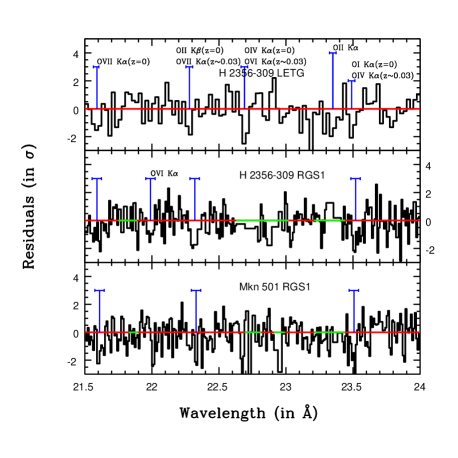
Once a reasonable description of the broad-band continuum was obtained, we then proceded to search for, and model, the possible presence of unresolved (FWHM km s-1 and FWHM km s-1 at Å, for the RGS and the LETG, respectively) absorption lines in the 18-24 Å band. To first identify candidate unresolved absorption lines and then confirm their identification in this spectral range we followed the procedure described in Nicastro et al. (2013). This procedure yielded the results summarized in Table 1 (line IDs are also labeled in Figure 1). For all the lines, we report only statistical errors at the the 1 significance level.
| Equivalent | Local ID | ID | |
| Width | |||
| in Å | in mÅ | ||
| H 2356-309 HRC-LETG | |||
| OI K | OIV K | ||
| OII K | N/A | ||
| OIV K | OVI K | ||
| OII K | OVII K | ||
| 22.02 (Frozen) | (at 3) | OVI K | N/A |
| OVII K | N/A | ||
| a19.21 (Frozen) | (at 3) | N/A | OVII K |
| H 2356-309 RGS | |||
| OI K | OIV K | ||
| OII K | OVII K | ||
| OVI K | N/A | ||
| OVII K N/A | |||
| a19.25 (Frozen) | (at 3) | N/A | OVII K |
| Mkn 501 RGS | |||
| OI K | OIV K | ||
| OII K | OVII K | ||
| OVI K | N/A | ||
| OVII K N/A | |||
| a19.26 (Frozen) | (at 3) | N/A | OVII K |
a For each spectrum, OVII K 3 upper limits are given at the redshift of the putative OVII K WHIM line, as derived from the best-fitting position of the line at Å.
2.2 Results for H 2356-309
The 18-24 Å LETG spectrum of H 2356-309 shows the presence of 5 unresolved absorption lines, which can all be identified as local transitions imprinted by a wide ionization range of oxygen ions in our Galaxy’s multi-phase ISM. In particular, the LETG data of H 2356-309 hint at the OI K (2.5), OII K (2.3) and K (2), OIV K (2.9) and OVII K (2.3) transitions (Fig. 1, top panel). The RGS data of H 2356-309 confirm the presence of the local OI K, OII K and OVII K absorption lines (detected at statistical significances of 3.4, 2.8 and 2.8, respectively) and hint at the presence of a OVI K line (only 1.6), but cannot safely detect either the OII K or the OIV K lines, due to the presence of instrumental features at the relevant wavelengths (Fig. 1, middle panel, green horizontal segments). 111The inclusion in the analysis of these RSS regions heavily affected by the presence of instrumental features, does not change our results and consequent conclusions . Two of these lines, the OVII K and the line at (LETG) or (RGS) (Table 1) were also reported by B09 and F10 (who use the same LETG data that we use here), who identified the second of these lines as an OVII K absorber at imprinted by an intervening WHIM filament at a redshift consistent with that where the Sculptor Wall concentration of galaxies crosses our line of sight to H 2356-309. The line at detected in the LETG spectrum (not detectable in the RGS spectrum because of an overlapping instrumental feature) and identifiable with local OIV K absorption, was not reported instead by F15, though the line is clearly visible in the 20-23.5 Å portion of the spectrum that FN15 show in their Fig. 4.
2.3 Results for Mkn 501
The 18-24 Å LETG spectrum of Mkn 501 hints at the presence of the same 4 unresolved absorption lines that are detected in the RGS spectrum of H 2356-309, and that can be identified as local transitions imprinted by OI K (4.2), OII K (2.8), OVI K (2.2) and OVII K (3.2) transitions (Fig. 1, bottom panel). As for the RGS spectrum of H 2356-309, the RGS spectrum of Mkn 501 cannot detect either the local OII K or OIV K lines, due to the presence of instrumental features at the relevant wavelengths (Fig. 1, bottom panel, green horizontal segments).
Also in the case of the RGS spectrum of Mkn 501, the OVII K line and the line at (RGS) (Table 1) were already reported by RFB14 (using the same RGS data that we use here), who, again, identified the second of these lines as an OVII K absorber at (consistent with the source systemic redshift) imprinted by an intervening WHIM filament at a redshift consistent with that where the Hercules Supercluster concentration of galaxies crosses our line of sight to Mkn 501.
3 Discussion
3.1 The -WHIM versus -LIMM Conspiracy
From the possible identifications listed in columns 3 and 4 of Table 1, it is evident that 3 of the 6 different lines detected (or hinted at) in the LETG and RGS spectra of H 2356-309 and Mkn 501 have unambiguous identifications. These are, the OVII K (LETG and RGS), OVI K (RGS only in H 2356-309, where also LETG is available, but consistent with the 30 mÅ 3 LETG EW upper limit at that position) and OII K (LETG only, because the RGS spectrum is blocked by an instrumental feature at those wavelengths), and can only be imprinted by a multiphase ISM/CGM, with one or more high-ionization component producing OVI and OVII absorption and a low-ionization component producing OII (and OI) absorption.
However, the 3 remaining lines have ambiguous identification. They could all be imprinted by a multi-phase mildly ionized medium in the Galaxy’s ISM/CGM (with dominant OI-IV ions), but could also be identifiable with transitions imprinted by hotter medium, dominated by OVI-VII ions. This is because the OVII K, OVI K and OIV K transitions, at overlap with the rest frame wavelengths of the OII K, OIV K and OI K transitions, respectively, expected to be imprinted by the Galaxy’s Low-Ionization and Medium-Ionization Metal Mediums (LIMM - e.g. N15 and references therein - and MIMM).
To discriminate between these two possibilities for these 3 absorption lines, we make use of two different versions of our PHotoionized Absorber Spectral Engine (PHASE, Krongold et al., 2003) code: one photo-ionized, for the ISM/CGM of our Galaxy (galabs model hereinafter: see N15 for details), needed to model at least the three lines with unambiguous ISM/CGM identification, and one hybridly-ionized and optimized for the WHIM (whimabs model, hereinafter: see, e.g., Zappacosta et al., 2010), to attempt to model at least part of the three controversial and ambiguous lines.
The LETG and RGS data of H 2356-309 have SNRE=13 (LETG) and 26 (RGS) at 22 Å, much larger, when combined, than the SNRE=24 of the RGS spectrum of Mkn 501. Moreover, the combined LETG and RGS spectrum of H 2356-309, detects 6 different lines (5 in the LETG and 3 in the RGS, 2 of which in common with the LETG), compared to the 4 lines detected in the lower S/N RGS spectrum of Mkn 501. H 2356-309 is therefore the best suited target to test our physically self-consistent ISM/CGM versus WHIM models.
3.2 The ISM/CGM Modeling
To verify whether all the 6 different lines detected (or hint at) in the LETG and RGS spectra of H 2356-309 could be modeled by absorption due to our own Galaxy multi-phase ISM/CGM, we followed the procedure we used in N15. Namely, we model simultaneously the 6-50 Å LETG and the 6-30 Å RGS1 and RGS2 data of H 2356-309 with a continuum model consisting of a powerlaw (native xspec model xspowerlaw in Sherpa) attenuated by the column of neutral Galactic gas (XSPEC native model xstbabs in Sherpa, and add to each of the three spectra (LETG, RGS1 and RGS2) a number of galabs components till all the lines detected at single-line statistical significance could be adequately modeled. For each galabs component we link all parameters to a single variable value in the 3 spectra, except the redshift that is allowed to vary by km s-1 from spectrum to spectrum, to allow for line misalignment within instrument resolution elements. This procedure required three different galabs components: (a) a low-ionization component, with a temperature of T K and a poorly constrained Doppler parameter km s-1 (the LIMM: dubbed Warm Ionized Metal Medium in N15), that models well the lines at and 23.35 Å, identified as OI K (best-fitting LIMM EW mÅ versus best-fitting Gaussian EW) and OII K (EW mÅ versus EW mÅ) transitions, but is able to reproduce only half of the Å line, as OII K (EW mÅ versus EW mÅ); (b) a warmer mildly ionized ISM/CGM component with T K and b km s-1 (the MIMM), modeling less than half of the Å line with the OIV K transitions (EW mÅ versus EW mÅ); (c) a hot ISM/CGM component, with T K and b km s-1 (hereinafter High-Ionization Metal Medium: HIMM), that models about 2/3 of the Å line, identified as OVII K (EW mÅ versus EW mÅ), but fails to model the OVI K line hinted at a single-line statistical significance of only in the RGS1 spectrum.
Fig. 2 shows the 21-24 Åportions of the LETG spectrum of H 2356-309, with superimposed the best-fitting ISM/CGM model (Model-B) including the LIMM, the MIMM and the HIMM (top panel). The EWs of the 5 lines modeled by the three galabs components, are consistent, within their 1 uncertainties, with the best-fitting EWs obtained with Model-A and listed in Table 1, but the best-fitting values of the OII K, OIV K and OVII K are all lower than the those obtained with Model-A (single-line Gaussian fit). This could simply reflect the fact that the photo-ionization-equilibrium models that we use are not a sufficiently accurate description of the gas physics, but it might also indicate that additional components are needed. For example, for the unmodeled OVI K line at Å and the not fully modeled OVII K, a fourth, ISM/CGM phase could be present, with a degree of ionization in between that of the MIMM and the HIMM, while for the partly unmodeled OII K OIV K an extragalactic intervening WHIM component may be needed, with temperature such to be dominated by OVI and OVII ions.
We conclude that the 3-phase ISM/CGM Model-B reproduces in a statistically satisfactory way the combined LETG and RGS data of H 2356-309, but leaves some room for (statistically not required: for 5332 dof) intervening WHIM absorption, filling in the 1/3 missing line opacity at the wavelengths of the OII K and the half missing opacity at the wavelengths of the OIV K, with the OVII K and OVI K transitions, respectively.
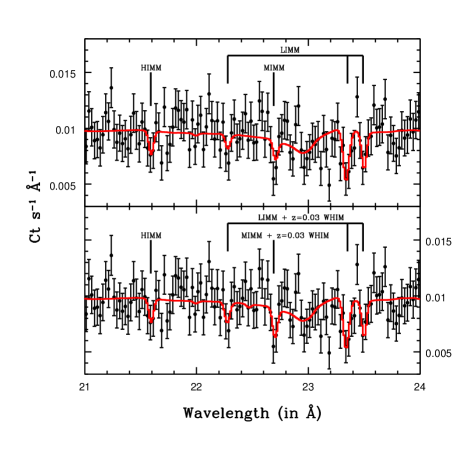
3.3 The ISM-WHIM Modeling
To verify the need for an additional WHIM component, we added a whimabs’ hybrid-ionization component to our best-fit ISM/CGM 3-phase Model-B, and re-fitted the data leaving the temperature, equivalent hydrogen column density, and Doppler parameter of the gas, free to vary and constraining its redshift to vary only between (Model-C). This yielded a negligible improve in statistics (only for 3 additional degree of freedom over the initial 115, in the 21-24 Å spectral interval), a best-fitting redshift of the putative WHIM filament of , a temperature T K, a Doppler parameter km s-1 and an oxygen column density of N cm-2, in much better agreement with theoretical expectations for the WHIM than the implausible large oxygen column reported by F15 (N cm-2 for their best fitting km s-1). The whimabs component fills in the missing opacities at the wavelengths of the OII K and OIV K transitions, with OVII K and OVI K absorption, and the best-fitting Model-C molds well the 5 absorption lines detected in the LETG+RGS spectrum of H 2356-309 (Fig. 2, bottom panel). Table 2 lists, for these 5 lines, the best-fitting Model-C EWs, together with the corresponding best-fitting Model-A EWs already reported in Table 1.
| Local ID | ID | Model-C | Model-A |
|---|---|---|---|
| Equivalent Width | Equivalent Width | ||
| in mÅ | in mÅ | ||
| OI K | — | 20 | |
| OII K | — | 27 | |
| OIV K | OVI K | 20 | |
| OII K | OVII K | 18 | |
| OVII K | — | 10 |
3.4 Comparison with the N15 Sample
OII absorption is ubiquitously detected through its strongest K transition, along virtually all Galactic and extragalactic lines of sight of the N15 samples. The 8 times weaker K transition is hinted at in 9 out of the 20 lines of sight and 9 out of 21 extragalactic lines of sight of the N15 samples. This absorption line is detected with average equivalent widths mÅ (down to a 3 detectability threshold of mÅ) and mÅ (down to a looser - because of the lower S/N of the AGN spectra - 3 detectability threshold of 80 mÅ), for the Galactic and extragalactic sources, respectively (N15).
The N15 sample of extragalactic sources includes the two blazars H 2356-309 and Mkn 501, whose LETG and RGS data we also reanalyze here. In our re-analysis of all the high-resolution X-ray spectra available for these two targets, for the absorption line at Å, we measure and mÅ, for H 2356-309 and Mkn 501, respectively, fully consistent with the average EWOIIKβ measured in our samples of Galactic and/or extragalactic lines of sight in N15.
Based on this comparison, we conclude that the Å absorption line observed in the spectra of H 2356-309 and Mkn 501 is likely to be produced entirely by OII K absorption.
4 Conclusions
In this work we reanalyze all the available high-resolution X-ray spectra of the two blazars H 2356-309 and Mkn 501, for which claims of intervening WHIM absorptions were presented by B09, F10 and RFB14.
We demonstrate that the presence of metal absorption from the diffuse LIMM in the Galaxy’s ISM/CGM, casts serious doubts on these two OVII K WHIM detection claims (B09, F10, RFB14). In particular, we show that the most likely identification for this putative OVII K WHIM line, is instead that of the K transition of OII, imprinted by the Galaxy’s LIMM (N15).
For the case of H 2356-309, for which we dispose of combined Chandra LETG and XMM-Newton RGS data that allow us to detect 5 absorption lines between 21-24 Å, at single-line significance , we conclude that any redshifted () OVII K WHIM contribution to the unavoidable presence of an OII K absorber at Å, must be lower than N cm-2 (for km s-1), in much better agreement with theoretical expectations for the WHIM, than the implausible large oxygen column reported by F15 (N cm-2 for their best fitting km s-1).
5 Acknowledgements
We thank the anonymous referee for the useful comments that helped improving the paper. FN and FS acknowledge support from INAF-PRIN grant 1.05.01.98.10.
References
- [\citeauthoryearBuote et al.2009] Buote, D.A. et al., 2009, ApJ, 695, 1351: B09
- [\citeauthoryearCen & Ostriker2006] Cen, R. & Ostriker, J.P., 2006, 650, 560
- [\citeauthoryearFang et al.2010] Fang, T. et al., 2010, ApJ, 714, 1715: F10
- [\citeauthoryearFalco et al.2000] Falco, E. et al., 2000, “The Updated Zwicky Catalog (UZC)”, vol 1., p. 1
- [\citeauthoryearFreeman, Doe & Siemiginowska1999] Freeman, P., Doe S. & Siemiginowska A., 1999, SPIE, 4477, 76
- [\citeauthoryearFruscione & Siemignowska1999] Fruscione A. & Siemiginowska A., 1999 STIN, 9906596
- [\citeauthoryearGabriel et al.2004] Gabriel C. et al., 2004, ASPC, 314, 759
- [\citeauthoryearGatuzz et al.2013a] Gatuzz, E. et al., 2013, ApJ, 768, 60 (2013a)
- [\citeauthoryearGatuzz et al.2013b] Gatuzz, E. et al., 2013, ApJ, 778, 83 (2013b)
- [\citeauthoryearGupta et al.2012] Gupta, A. et al., 2012, ApJ, 756, L8
- [\citeauthoryearJones et al.2009] Jones, D.H. et al., 2009, “The 6dF Galaxy Survey Data Release 3”, vol. 1, p. 1
- [\citeauthoryearKrongold et al.2003] Krongold, Y. et al., 2003, ApJ, 597, 832
- [\citeauthoryearMathur, Weinberg & Chen2003] Mathur, S., Weinberg, D.H. & Chen, X., 2003, ApJ, 582, 82
- [\citeauthoryearNicastro et al.2015] Nicastro, F. et al., 2015, MNRAS, submitted: N15
- [\citeauthoryearNicastro et al.2005a] Nicastro, F. et al., 2005, Nature, 433, 495 (2005a)
- [\citeauthoryearNicastro et al.2005b] Nicastro et al., 2005, ApJ, 629, 700 (2005b)
- [\citeauthoryearNicastro et al.2010] Nicastro, F. et al., 2010, ApJ, 715, 854
- [\citeauthoryearRen, Fang & Buote2014] Ren, B., Fang, T. & Buote, D.A., 2014, ApJ, 782, L6: RFB14
- [\citeauthoryearTananbaum et al.2014] Tananbaum, H. et al., 2014, RPPh, Volume 77, Issue 6, article id. 066902: rXiv:1405.7847
- [\citeauthoryearYao et al.2009] Wilms, J., Allen, A., & McCray, R., 2000, ApJ, 542, 914
- [\citeauthoryearZappacosta et al.2012] Zappacosta L., Nicastro, F., Krongold, Y. & Maiolino, R., 2012, ApJ, 753, 137
- [\citeauthoryearZappacosta et al.2010] Zappacosta, L. et al., 2010, ApJ, 717, 74