From 3D static order to 2D dynamic correlations in the tetragonal double perovskite \ceSr2CuWO6
Abstract
\ceSr2CuWO6is a tetragonal () double perovskite with diamagnetic W6+ (5d0) and (Jahn-Teller-active) Cu2+ (3) in a rocksalt-ordered arrangement on the B sites, modelling an anisotropic fcc-lattice antiferromagnet with . We have studied the magnetic structure, dynamics and thermodynamic properties of this material above and below the Néel-ordering transition at K. Muon spin relaxation spectroscopy, neutron diffraction and neutron spectroscopy experiments show that the transition at on heating is from static 3D type-2 antiferromagnetism to 2D dynamic correlations that remain detectable up to 100 K. Above the muon relaxation is described by a compressed exponential decay, revealing a strong correlation between the spin fluctuation rate and the 2D correlation length. The low-temperature muon data and the entropy release around as obtained from the heat capacity data point to small magnetic domains, probably of the order of 60 Å. We note that the material behaves more like a quasi-2D square lattice antiferromagnet than could be expected considering its structure only. A possible explanation might lie in the unusual strong spin-orbit-coupled magnetism of the W 5 levels, as the dominant exchange interaction is via the Cu-O-W-O-Cu pathway.
pacs:
I Introduction
Double perovskite Mott-Hubbard insulators have attracted much attention because of their interesting, often geometrically frustrated, magnetic topologies as well as the orbital degrees of freedom associated with high symmetry of the magnetic metal-ion environment Chen et al. (2010). These features are exemplified by the -site rocksalt-ordered double perovskites in which one of the -sites contain orbitally-degenerate or transition metal ions with strong spin-orbit coupling ( Mo5+, Ru6+, Re6+, Os7+ and W5+), which can be modelled as fcc lattices of antiferromagnetically-coupled spin-orbital moments with near-neighbour and next-nearest neighbour interactions Witczak-Krempa et al. (2013). Against this backdrop the double perovskites \ceBa2CuWO6 and \ceSr2CuWO6 Blasse (1965) provide model systems containing ( perhaps by now reassuringly familiar) antiferromagnetically-coupled Cu2+ spin moments, the W cations being in the nominally non-magnetic 6+ state Blasse (1965); Gateshki et al. (2003); Vasala et al. (2012a). The Ba-analogue (\ceBa2CuWO6) has previously been shown to have a long-range ordered type-2 Néelground state with K Todate et al. (2007), but because of the absence of any anomaly or field-cooled zero-field cooled splittings in the magnetic susceptibility \ceSr2CuWO6 was put forward as a potential quantum spin liquid Vasala et al. (2012a).
Sr2CuWO6 undergoes a Jahn-Teller distortion from cubic () to tetragonal () at 920∘C, leading to an elongation of the -axis ( for the body-centered tetragonal cell) Gateshki et al. (2003). At 670∘C there is a further transition from to with a modest rotation of the octahedra around the -axis, leading to the structure shown in Fig. 1. Subsequent studies on the magnetic properties of \ceSr2CuWO6 have focussed on the phase. The magnetic Cu2+ orbital is aligned in the plane, causing some anisotropy between the in-plane and out-of-plane exchange constants. Figure 1 shows the four most important exchange interaction pathways; and are via Cu-O-O-Cu (90∘) bonds in-plane and out-of plane respectively. and are via the Cu-O-W-O-Cu (180∘) pathways in the plane and along the -axis, respectively. As remarked earlier Vasala et al. (2012a), there is potential for geometrical frustration due to competing interactions along the different pathways. A recent SR experiment has shown that there is long-range order below K Vasala et al. (2014), roughly an order of magnitude below the Weiss temperature. In the same study the exchange constants are estimated using DFT calculations combined with O K-edge X-ray absorption spectroscopy, yielding (strongest first): meV, meV, meV and meV Vasala et al. (2014). While this is at first sight consistent with the crystallographic structure, the implied 3D antiferromagnetism is difficult to reconcile with the magnetic properties which have previously been suggested to point to quasi-2D magnetism Vasala et al. (2014).

The Mermin-Wagner theorem Mermin and Wagner (1966) forbids magnetic ordering for for any layered system where the interactions between spins are strictly in the plane and short-ranged. In the case of the 2D square lattice of spins with antiferromagnetic near-neighbour interactions the ground state is expected to be long-range (Néel) ordered Manousakis (1991) and in all known cases a 3D Néel-ordered state sets in at some finite temperature due to 3D interlayer interactions, which are often orders of magnitude smaller than the dominant in-plane exchange interactions Keimer et al. (1992). Reduced ordered moments due to quantum fluctuations have been observed in physical realisations including copper formate tetradeuterate (CFTD) Rønnow et al. (2001). The spin-wave dispersion exhibits distinctive non-classical features indicative of emergent quasiparticle excitations Dalla Piazza et al. (2015). Furthermore, in many of these systems, including \ceLa2CuO4 Keimer et al. (1992), \ceSr2CuO2Cl2 Greven et al. (1995) and CFTD Rønnow et al. (1999), strong dynamic correlations have been found to persist far above the ordering temperature. Long-ranged 2D dynamic correlations in the planes, above , have been hypothesised to explain the absence of any clear signatures of Néel ordering in the bulk magnetism in \ceSr2CuWO6 Vasala et al. (2014).
Notwithstanding all the work being carried out on \ceSr2CuWO6, the magnetic ground state order is not yet known, nor is there any other than circumstantial evidence of dynamic correlations above the Néeltemperature. This paper addresses both aspects with the aid of neutron powder diffraction, neutron spectroscopy, muon spectroscopy and heat capacity measurements. The experimental results confirm earlier suggestions that this material behaves like a quasi-2D antiferromagnet. An attempt is made to reconcile this behaviour with the apparently solidly 3D magnetic topology of this model system without invoking the concepts of geometrical frustration, which we argue do not play a role in \ceSr2CuWO6.
II Experimental Details
Sr2CuWO6 was synthesised using standard solid state techniques. Stoichiometric quantities of \ceSrCO3, \ceCuO and \ceWO3 were ground in an agate mortar in air, before being pressed into a pellet and calcined at °C for two hours in air. The resulting compound was re-pelleted, then sintered at °C (again in air) for hours. The product was characterised using powder X-ray diffraction, and the sintering step was repeated until phase purity was achieved.
DC magnetic susceptibility measurements took place on a Quantum Design MPMS between K and K. Magnetization was measured as a function of temperature at a range of fields up to T.
Heat capacity was measured on a Quantum Design PPMS, at temperatures between 2 and 300 K with 0.2 K steps between 20 and 30 K. A thin square pellet ( mm by mm, mass mg) of sintered \ceSr2CuWO6was affixed using Apiezon N grease (Dow Corning). The heat capacity of the grease was measured prior to the heat capacity of sample + grease, so that the heat capacity of the small sample could be extracted.
High-resolution neutron diffraction was carried out in the D2B beamline at the ILL on a g sample in a cylindrical vanadium can. At K the neutron diffraction data collected at wavelengths Å (germanium monochromator reflection) and Å ( reflection) were refined together. At K a wavelength of Å was used, and at K Å. The uncollimated neutron beam was used with maximum slit openings.
The X-ray and neutron diffraction data were refined using the GSAS/ExpGUILarson and Von Dreele (1994); Toby (2001) software. Magnetic analysis of neutron diffraction was carried out using Fullprof Rodríguez-Carvajal (1993) and the Bilbao Crystallographic Server .
Muon spin relaxation spectroscopy was carried out on the MuSR beamline at ISIS. Powdered sample was placed in a disc-shaped holder, and measured across a range of temperatures from K to K and in longitudinal fields from G to G. Measurements for data presented here were taken for million positrons pos detected in each case. The polarization is calculated from the asymmetry using
| (1) |
where and is a factor correcting for slight differences in efficiency of detecting forwards () and backwards () emitted positions. Above 27 K was equated to the first data bin. Below 35 K it was clear from the sharp reduction of compared to the higher temperature data that significant muon relaxation took place even within the “” bin and hence for K a constant was used.
Finally, inelastic neutron spectroscopy measurements were done on the MARI beamline at ISIS on a g sample. The sample was placed in an aluminium foil envelope, which was rolled into annular configuration and placed in a 50 mm aluminium can. The incident energy was meV, and measurements were taken at temperatures between K and K, using the thin-tail CCR.
III Results
III.1 Bulk measurements
Magnetometry measurements indicate that the high-temperature state, above 100 K, is Curie-Weiss paramagnetic. The Curie constant emu mol-1 K-1 corresponds to an effective moment . The effective moment for Cu2+ is usually around and we do not have an explanation ready for the large effective moment observed here, except that perhaps there is some (minor) hybridisation between the Cu and W cations. This could cause an increased moment on the Cu (Cu3+ mixing in) as well as a small moment on the W, with W5+ mixing in. The Weiss temperature is K (Fig. 2). This differs from the Weiss constants of K and K previously reported by Vasala et al. Vasala et al. (2012b) and Iwanaga et al. Iwanaga et al. (1999), and is closer to the value of K reported by Blasse Blasse (1965). There is a broad maximum just below 100 K that has been associated with the build-up of short-ranged correlations Vasala et al. (2012b) and then again a slight upturn below 10 K that could be due to paramagnetic impurities. No anomalies and no splitting between field-cooled and zero-field-cooled data are observed. This has previously led to speculation that \ceSr2CuWO6 has a 2D spin-liquid magnetic ground state Vasala et al. (2012b).

Our initial heat capacity data did not reveal any magnetic anomalies in the heat capacity (Fig. 3). Following the muon spin relaxation spectroscopy experiment by Vasala et al. revealing a transition at 24 K, more detailed measurements were done between 21 and 28 K. These data revealed a very weak feature (Fig. 3(inset) and Fig. 4) and the entropy release at the transition (on heating through it from 20 to 26 K) is estimated at % of the total magnetic entropy of J K-1 mol-1 (Cu2+)-1 (Figure 4).


III.2 Structural probes

The room-temperature neutron diffraction pattern of \ceSr2CuWO6 is shown in Fig. 5. The pattern was refined in the space group , as described in previous studies Todate et al. (2007); Vasala et al. (2012b). Table 1 gives all details of the present refinement which is in good agreement with previous data. The data at K show a very small additional peak at Å-1 (Fig. 5(inset)). Comparison with a measurement at 50 K, as shown in the inset of Fig. 5, confirms that the reflection appearing at Å-1 is the only magnetic Bragg peak within the error bars of our measurements. The temperature dependence of the anisotropic displacement constants for Cu and W is anomalous though the 50 K data should not be considered here as that data is with poorer statistics. That only the of the Cu and W cations increases at low temperatures points to a magnetic effect, perhaps related to the small magnetic domains in the ordered state.
| T (K) | 3.5 | 50 | 300 |
|---|---|---|---|
| a (Å) | |||
| c (Å) | |||
| V (Å3) | |||
| Sr (0, 0.5, 0.25) | |||
| B (Å2) | |||
| Cu | |||
| B (Å2) | |||
| W | |||
| B (Å2) | |||
| O1 (x, y, 0) | |||
| x | |||
| y | |||
| B (Å2) | |||
| O2 (0, 0, z) | |||
| z | |||
| B (Å2) | |||
| (%) | |||
| (%) | |||
| (%) | |||
For comparison, the neutron diffraction pattern of \ceBa2CuWO6 in the magnetically-ordered state reveals two peaks Todate et al. (2007), the first like in \ceSr2CuWO6 at 0.68 Å-1, plus an additional reflection at 1.24 Å-1. The magnetic reflections in \ceBa2CuWO6 were indexed as and on a face-centred unit cell, corresponding to and in the body-centred tetragonal setting, respectively.
The magnetic structure implied by the peak at 0.68 Å-1 is the so-called type-2 structure, indexed by (magnetic space group ). This structure may be described as a series of antiferromagnetic planes stacked ferromagnetically along the direction (Fig. 6). As for the Ba analogue, the ordered moment is very small, , and its orientation could not be determined reliably.
While Vasala et al. did not observe any magnetic Bragg peaks in their low-temperature neutron diffraction data, they did correctly predict the magnetic structure to be of type-2 with the aid of ab-initio calculations combined with X-ray absorption-spectroscopy data Vasala et al. (2014).

III.3 Muon spin resonance
The previous SR study revealed a sharp magnetic transition and yielded the field strength at the muon site as a function of temperature below K Vasala et al. (2014). This transition is also observed in our data (Fig. 7) with a sharp drop in the polarization between 25 and 20 K. The present data, collected at the ISIS facility (which is a high-intensity pulsed source) is complementary to the data by Vasala et al. taken at the Paul Scherrer Institute (PSI); the time resolution at MuSR at ISIS is lower, but the muon relaxation can be followed over much longer time scales (up to s) due to the much higher number of muons implanted with each pulse/time frame. The muon source at PSI is a continuous source and therefore better suited for measurements requiring a high time resolution.
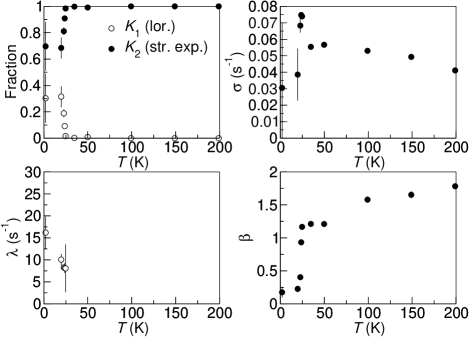
Between 20 and 200 K the muon relaxation can be fitted with a (phenomenological) linear combination of Lorentzian and stretched exponential decays;

| (2) |
with the additional constraint that . and are the Lorentzian and stretched/compressed exponential relaxation factors respectively, and is the stretching exponent - in the present case, with the relaxation is compressed exponential, approaching at high temperatures; would equate Gaussian relaxation as expected for a paramagnet Aharen et al. (2009). The results of the fits at temperatures between K and K are shown in Fig. 8. Down to 24.7 K, right above the ordering transition, the Lorentzian component remains close to zero and the relaxation is well modelled by the compressed exponential. As the system is cooled from 200 K there is a steady increase in and a gradual reduction in , providing evidence of a gradual slow-down of the spin dynamics that starts at temperatures far above .
Below K a significant contribution from fast Lorentzian relaxation can be seen, and the stretching exponent drops sharply to values below 1. Considering both the muon relaxation curves of Fig. 7 and the fit data of Fig. 8 it is clear that while the two components in Eqn. 2 accurately model two types of muon relaxation present in the sample above , this is no longer the case below 20 K. In the 3D-ordered state strongly damped oscillations are observed, but in this case not with sufficient resolution to determine the ordered moment as a function of temperature, as was done by Vasala et al. Vasala et al. (2014). The strong damping of the oscillations points to a wide distribution of local fields around the non-zero mean value. This is indicative of a fair amount of magnetic disorder, which may be due to the presence of many small magnetic domains, as we will see later. The relaxation to 1/3 of the initial polarisation shows that one-third of the moments are aligned parallel or antiparallel with the initial muon polarisation, as expected for static moments in a powder sample with no preferential crystallographic and therefore magnetic orientation.
III.4 Inelastic neutron scattering
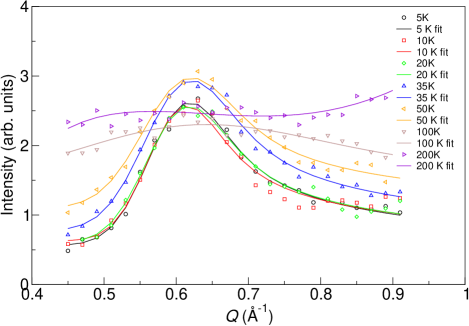
Inelastic neutron scattering measurements were carried out to characterise the dynamic magnetic correlations as a function of temperature. 30 meV neutrons were used (Å) and the neutron spectrum taken at 5 K is shown in Fig. 9. The two bands below Å-1, rising up to approximately 14 meV, are of magnetic origin – no structural reflections occur at these wave numbers. We focus in particular on the part of the magnetic dispersion rising up from approximately Å-1, where the reflection is located at the elastic line. In Fig. 10 the inelastic scattering in this area is shown as a function of temperature.
The energy window for neutrons at these short wave numbers is rather narrow regardless of the energy of the incident neutrons, but with 30 meV neutrons a significant section of the magnetic spin-wave dispersion and dynamic magnetic correlations can still be observed. The zero-energy-transfer origin of the dispersion, and center of mass, appears to be at about 0.62 Å-1, somewhat below the elastic magnetic reflection at 0.68 Å-1. Figure 11 shows the neutron scattering intensity integrated over energies from 4 to 6 meV and corrected for the magnetic form factor, showing the same mismatch. The reason for the mismatch is that the dispersion observed here does not correspond to the 3D spin-waves in the ordered phase. The energy scale of the 3D ordering is up to meV and the signal up to that energy is swamped by the elastic line and hence is invisible here. The dispersion observed here corresponds to 2D dynamic antiferromagnetic correlations - the energy scale of 14 meV ( K) is of the order of the in-plane magnetic exchange interactions. It is then not surprising that the dispersion curves remain practically unchanged on heating above the ordering transition, with strong correlations visible even at 50 K and still just about visible at 100 K.
The energy-integrated scattering shown in Fig. 11 exhibits a peak shape that is characteristic of 2D correlations in a powder sample, as described by Warren Warren (1941); Wills et al. (1999);
| (3) |
where
| (4) |
and
| (5) |
and Å is the neutron wavelength. The wave vector obtained from the fit Å-1 corresponds to the in-plane antiferromagnetic wave vector. Strickly speaking, the Warren function (Eq. 3) describes only the elastic scattering from short-ranged 2D correlations. In the present case we integrate over a small range of (relatively-low) inelastic energies as is in practice inevitable in diffuse neutron scattering. Here it is justified by the energy independence of the neutron-scattering cross section within and, where visible, outside the interval of energies included in the integral. Hence this data confirms that the magnetic correlations above are 2D (in the planes), and persist, if weakly, up to 100 K. The fits yield a lower limit to the correlation length as a function of temperature, shown in Fig. 12.


IV Discussion
The presence of 2D dynamic antiferromagnetic correlations above and up to K, as observed in the neutron spectra of Figs. 10 and 11, explains the absence of an anomaly at in the magnetic susceptibility. We can conclude that below the broad maximum in the magnetic susceptibility data (Fig. 2) at 100 K antiferromagnetic spin correlations start to grow as the temperature is lowered, while not far above 100 K Curie-Weiss paramagnetism sets in. The SR data show that there is a gradual slowing down of spin fluctuations with increasing 2D spatial correlations, but that the spins remain dynamic until cooled below .
These observations are also consistent with the very small peak that can just be discerned in the heat capacity data between 20 and 26 K, peaking at K. The (2D) magnetic wave vector in the 2D layers is and this leads to three distinct ways an ordered 2D layer can be stacked on the preceding one along the -axis: shifted by 1/2 a phase along the magnetic -vector, and rotated by 90∘ around the -axis. The entropy associated with the 2D- to 3D-ordering transition can then be calculated as follows: the total number of distinct configurations of 2D ordered layers . Hence the entropy of the 2D- to 3D-ordering transition as a function of is given by
| (6) |
where is the total number of magnetic spins in a sample grain or in the coherent volume. Note that we see from the approximate equation at the right-most side that this entropy is subextensive. If we assume that the coherent volume below the transition contains an equal number of spins along each crystallographic axis then the total magnetic entropy of that volume can be written as
| (7) |
and the ratio
| (8) |
The experimentally-obtained ratio of 0.003 (0.3%) (an upper limit) yields , which translates to an upper limit for the correlation length of 63 Å along the -axis and 81 Å in the plane. This is reassuringly close to the correlation length in the plane just above the transition (55 Å), as obtained from the Warren fits. It is also consistent with the fast muon relaxation to below , which points to small coherent antiferromagnetic domains in the low-temperature 3D-ordered phase. Given the degeneracy intrinsic to the type-2 magnetic ordering discussed earlier, these are likely to be domains, with the in-plane component of the magnetic vector variably aligned along the crystallographically-equivalent - and -axes.
The available data are fully consistent and readily explained by the presence of strong 2D correlations persisting above , in what could be described as a “2D thermal spin liquid” phase at intermediate temperatures. While this is in line with earlier proposals Vasala et al. (2014) it is not clear how this phase arises if the computational exchange constants Vasala et al. (2014) are correct – in particular if is indeed as strong as meV (49 K), 56% of the dominant exchange. This would not be a quasi-2D system and could be expected to show 3D Néel ordering around at least 50 K. Note that the two interpenetrating 3D sublattices arising from the and bonds only (Fig. 6) are not by themselves frustrated. When they order fully antiferromagnetically, each with a wave vector , there is a two-fold degeneracy arising from the relative phase of the two sublattices. Both degenerate states are type-2 antiferromagnetic, with the in-plane antiferromagnetic phase vector aligned along the or the axis. This degeneracy is not lifted by inclusion of the much weaker and because for each edge with antiferromagnetically aligned spins at the vertices there is a edge with ferromagnetically aligned spins.
Hence, the observed type-2 antiferromagnetism is consistent with the predicted exchange constants, but the dynamic correlations in the 2D thermal spin liquid state above are not. In the archetypical quasi-2D antiferromagnet \ceLa2CuO4 the ratio between the interplane exchange constant and the main in-plane exchange interaction . This is hugely different from the ratio between the predicted and for \ceSr2CuWO6, considering that the ratio of the Néeltemperature over in \ceLa2CuO4; 300 K / 1345 K , is only slightly less than over in \ceSr2CuWO6. Furthermore, the short-ranged correlations evident above in \ceSr2CuWO6 are 2D and strongly reminiscent of the magnetism in \ceLa2CuO4 above 300 K. Hence, it is very unlikely that the theoretically-predicted value for meV is correct.
One possible explanation for the computational overestimate lies in the role of the W 5 orbital. The W cations are part of the and interaction pathways and XAS by Vasala et al. Vasala et al. (2014) indicates that there is some overlap between the Cu 3 – O 2 bands and the W 5 – O 2 bands. It may then be of relevance that the magnetism of W 5 electrons in an octahedral crystal field is described by a Kugel-Khomski Hamiltonian in the limit of strong spin-orbit coupling, as described in detail by Gang-Chen et al.Chen et al. (2010). This gives rise to a magnetic Hamiltonian in which the exchange pathway itself depends on the orientation of the magnetic (spin-orbital) moments. Combined with the solid orbital ordering of the magnetic Cu2+ orbital in the plane, perhaps the strongly spin-orbit-coupled magnetism of the W cation causes a much greater difference between and interactions. This is something that might be worth exploring in further detail. Further neutron spectroscopy experiments, from which the exchange constants could be determined via spin-wave modelling, would also be beneficial but probably only if done using large single crystals which are presently not available.
With regards to the muon relaxation in the thermal spin liquid regime, it is worth noting that compressed exponential relaxation has been observed in other spin liquid phases, for example in \ceSrCr8Ga4O19 (SCGO) Uemura et al. (1994), herbertsmithite \ce(ZnCu3(OH)6Cl2) Mendels et al. (2007) and the double perovskite \ceBa2YMoO6 de Vries et al. (2013). In SCGO the compressed exponential approaches Gaussian () as the temperature is lowered and it is thought to arise from a dynamical and heterogeneous ground state with a mixture of unpaired spins and spins paired into spin-singlet dimers Uemura et al. (1994), so that any particular muon environment fluctuates between magnetic and non-magnetic at a time scale shorter than the muon lifetime. This inevitably gives rise to a lifetime faster than that observed for the other examples and in \ceSr2CuWO6 there is no evidence of spin-singlet dimers, as they would be manifest in neutron spectroscopy data as near-neighbour antiferromagnetic correlations only. This also rules out any fundamental similarity with the spin liquid states in herbertsmithite and \ceBa2YMoO6 as both states are thought to be dominated by near-neighbour spin-singlet de Vries et al. (2009) and spin-orbital singlet dimers de Vries et al. (2013), respectively. In \ceBa2YMoO6 the compressed exponential muon relaxation is the result of two distinct muon environments: those adjacent to unpaired (dangling) fluctuating spins and those sitting elsewhere in the material, surrounded by non-magnetic spin-orbital singlet pairs. Hence there is a rather large variety of scenarios that give rise to compressed exponential relaxation and they have to be considered case by case. No further parallels can be drawn between the case of \ceSr2CuWO6 and the others.
V Conclusions
Below 24 K the quasi-2D square lattice antiferromagnet \ceSr2CuWO6 freezes into a 3D-ordered Néel state with k-vector , pointing to type-2 antiferromagnetic order (magnetic space group ) as predicted previously based on X-ray absorption spectroscopy combined with computational studies Vasala et al. (2014). As often for quasi-2D antiferromagnets with , neutron spectroscopy shows that dynamic 2D correlations are detectable far above ; in this case up to K, a temperature that is comparable to the energy scale of the main exchange interaction estimated at K and coinciding with the maximum in the magnetic susceptibility. Furthermore, SR shows a pronounced slowing down taking place well before is reached on cooling.
The pronounced 2D character of the magnetism is however surprising in the light of the exchange constants one might expect considering the structure of \ceSr2CuWO6. Perhaps the spin-orbit coupling in the 5 band of the W cations on the dominant exchange interaction pathway, not taken into account in the reported calculations Vasala et al. (2014), can explain the large difference between in-plane and out-of-plane exchange interactions implied by the above observations.
Acknowledgements.
The authors thank EPSRC for Ph.D. student funding (OB), and the STFC and ILL for beam time.References
- Chen et al. (2010) G. Chen, R. Pereira, and L. Balents, Physical Review B 82, 174440 (2010).
- Witczak-Krempa et al. (2013) W. Witczak-Krempa, G. Chen, Y. B. Kim, and L. Balents, arXiv:1305.2193 (2013).
- Blasse (1965) G. Blasse, Journal of Inorganic and Nuclear Chemistry 27, 993 (1965).
- Gateshki et al. (2003) M. Gateshki, J. M. Igartua, and E. Hernández-Bocanegra, Journal of Physics: Condensed Matter 15, 6199 (2003).
- Vasala et al. (2012a) S. Vasala, J. Cheng, H. Yamauchi, J. B. Goodenough, and M. Karppinen, Chemistry of Materials 24, 2764–2774 (2012a).
- Todate et al. (2007) Y. Todate, W. Higemoto, K. Nishiyama, and K. Hirota, Journal of Physics and Chemistry of Solids 68, 2107 (2007).
- Vasala et al. (2014) S. Vasala, H. Saadaoui, E. Morenzoni, O. Chmaissem, T. Chan, J. Chen, Y. Hsu, H. Yamauchi, and M. Karppinen, Physical Review B 89, 134419 (2014).
- Mermin and Wagner (1966) N. D. Mermin and H. Wagner, Physical Review Letters 17, 1133 (1966).
- Manousakis (1991) E. Manousakis, Rev. Mod. Phys. 63, 1 (1991).
- Keimer et al. (1992) B. Keimer, N. Belk, R. J. Birgeneau, A. Cassanho, C. Y. Chen, M. Greven, M. A. Kastner, A. Aharony, Y. Endoh, R. W. Erwin, and G. Shirane, Phys. Rev. B 46, 14034 (1992).
- Rønnow et al. (2001) H. M. Rønnow, D. F. McMorrow, R. Coldea, A. Harrison, I. D. Youngson, T. G. Perring, G. Aeppli, O. Syljuåsen, K. Lefmann, and C. Rischel, Phys. Rev. Lett. 87, 037202 (2001).
- Dalla Piazza et al. (2015) B. Dalla Piazza, M. Mourigal, N. B. Christensen, G. J. Nilsen, P. Tregenna-Piggott, T. G. Perring, M. Enderle, D. F. McMorrow, D. A. Ivanov, and H. M. Rønnow, Nature Physics 11, 62 (2015).
- Greven et al. (1995) M. Greven, R. J. Birgeneau, Y. Endoh, M. A. Kastner, M. Matsuda, and G. Shirane, Zeitschrift für Physik B Condensed Matter 96, 465 (1995).
- Rønnow et al. (1999) H. M. Rønnow, D. F. McMorrow, and A. Harrison, Phys. Rev. Lett. 82, 3152 (1999).
- Larson and Von Dreele (1994) A. C. Larson and R. B. Von Dreele, General Structure Analysis System (GSAS), Tech. Rep. LAUR 86-748 (Los Alamos National Laboratory, 1994).
- Toby (2001) B. H. Toby, Journal of Applied Crystallography 34, 210 (2001).
- Rodríguez-Carvajal (1993) J. Rodríguez-Carvajal, Physica B: Condensed Matter 192, 55 (1993).
- (18) Positrons are emitted as a muon decay product. The direction of their emission is preferentially along the direction the muon spin pointed in at the time that muon decayed.
- Vasala et al. (2012b) S. Vasala, J. Cheng, H. Yamauchi, J. B. Goodenough, and M. Karppinen, Chemistry of Materials 24, 2764 (2012b).
- Iwanaga et al. (1999) D. Iwanaga, Y. Inaguma, and M. Itoh, Journal of Solid State Chemistry 147, 291 (1999).
- Aharen et al. (2009) T. Aharen, J. E. Greedan, F. Ning, T. Imai, V. Michaelis, S. Kroeker, H. Zhou, C. R. Wiebe, and L. M. D. Cranswick, Phys. Rev. B 80, 134423 (2009).
- Warren (1941) B. E. Warren, Physical Review 59, 693–698 (1941).
- Wills et al. (1999) A. S. Wills, N. P. Raju, C. Morin, and J. E. Greedan, Chemistry of Materials 11, 1936 (1999).
- Uemura et al. (1994) Y. J. Uemura, A. Keren, K. Kojima, L. P. Le, G. M. Luke, W. D. Wu, Y. Ajiro, T. Asano, Y. Kuriyama, M. Mekata, H. Kikuchi, and K. Kakurai, Phys. Rev. Lett. 73, 3306 (1994).
- Mendels et al. (2007) P. Mendels, F. Bert, M. A. de Vries, A. Olariu, A. Harrison, F. Duc, J. C. Trombe, J. S. Lord, A. Amato, and C. Baines, Physical Review Letters 98, 077204 (2007).
- de Vries et al. (2013) M. A. de Vries, J. O. Piatek, M. Misek, J. S. Lord, H. M. Rønnow, and J. G. Bos, New Journal of Physics 15, 043024 (2013).
- de Vries et al. (2009) M. A. de Vries, J. R. Stewart, P. P. Deen, J. O. Piatek, G. J. Nilsen, H. M. Rønnow, and A. Harrison, Physical Review Letters 103, 237201 (2009).