Vol.0 (2015) No.0, 000–000
22institutetext: Graduate University of the Chinese Academy of Sciences, No. 19A, Yuquan Road, Beijing 100049, China
Identification of Candidate Millisecond Pulsars from Fermi LAT Observations
Abstract
We report our detailed data analysis for 39 -ray sources selected from the 992 unassociated sources in the Fermi Large Area Telescope (LAT) third source catalog. The selection criteria, which were set for finding candidate millisecond pulsars (MSPs), are non-variables with curved spectra and 5∘ Galactic latitudes. From our analysis, 24 sources were found to be point-like sources not contaminated by background or nearby unknown sources. Three of them, J1544.61125, J1625.10021, and J1653.60158, have been previously studied, indicating that they are likely MSPs. The spectra of J0318.1+0252 and J2053.9+2922 do not have properties similar to that of known -ray MSPs, and we thus suggest that they are not MSPs. Analysis of archival X-ray data for most of the 24 sources were also conducted. Four sources were found with X-ray objects in their error circles, and 16 with no detection. The ratios between the -ray fluxes and X-ray fluxes or flux upper limits are generally lower than those of the known -ray MSPs, suggesting that if the -ray sources are MSPs, none of the X-ray objects are the counterparts. Deep X-ray or radio observations of these sources are needed in order to identify their MSP nature.
keywords:
stars: pulsars — stars: binaries — gamma rays: stars1 Introduction
The Fermi Gamma-Ray Space Telescope (Fermi), with its great capabilities, has revolutionized our view of the high-energy, -ray sky. Thus far, the detection of 3033 sources has been reported in the Fermi Large Area Telescope (LAT) third source catalog (Acero et al., 2015), which used 4 yr of science data (year 2008–2012) from Fermi LAT all-sky monitoring observations. Among the sources, most of them are Active Galactic Nuclei (AGN; Ackermann et al. 2015b) and in our Galaxy, the prominent class is pulsars. According to the second Fermi LAT catalog of -ray pulsars and public list of LAT-detected -ray pulsars111https://confluence.slac.stanford.edu/display/GLAMCOG/Public+List+of+LAT-Detected+Gamma-Ray+Pulsars, 161 pulsars have been detected with -ray pulsations and more than 20 new millisecond pulsars (MSPs) have been discovered due to Fermi LAT detection of them. These results have not only established pulsars as the main -ray sources in the Galaxy, which has long been suspected from the surveys of the sky with previous Gamma-Ray telescopes, for example the Compton Gamma-Ray Observatory (Thompson, 2008), but also helped significantly improve our studies of the pulsar population, in particular the MSPs.
MSPs are 109 yr old, fast spinning neutron stars, which have evolved from low-mass X-ray binaries by accreting from companions and thus gaining sufficient angular momentum (Alpar et al., 1982; Radhakrishnan & Srinivasan, 1982). Due to their relatively high efficiency of converting spin-down energy to -ray emission (because ; e.g., Abdo et al. 2013) and isotropic distribution in the sky, Fermi all-sky monitoring is a powerful tool for finding candidate new MSPs, although note that it is extremely difficult to identify them from blind searches for pulsation signals in the Fermi LAT data (e.g., Pletsch et al. 2012). One important result due to Fermi is the discovery of a significant number of eclipsing MSP binaries, namely black widows (Fruchter et al., 1988) and redbacks (Roberts, 2013). As pointed out by Roberts (2013), the number of such systems is increased by 6-times to 20. Moreover three redbacks, PSR J1023+0038 (Archibald et al., 2009), J18242452I (in the globular cluster M28; Papitto et al. 2013), and XSS J122704859 (Bassa et al., 2014), are also known as transitional pulsar binaries, which can switch between the states of having an accretion disk and being disk-free. How to explain the presence of these systems and their formation processes is an interesting question (Chen et al., 2013; Benvenuto et al., 2014).
Since approximately one third of Fermi LAT sources have not been identified or found with associations with any known objects (Acero et al., 2015) and pulsars are the prominent -ray sources, it is conceivable that a significant number of pulsars are among these un-associated sources. We have carried out a systematic study of them, aiming to identify MSPs among them. In this paper, we report target selection from the Fermi LAT third source catalog for candidate MSPs (101 sources were found; see Section 1.1) and results from data analysis for 39 of the selected targets. In Section 1.1, the detailed selection is provided, which is based on the properties of pulsars learned from Fermi studies. We present our analysis of the LAT data and archival X-ray data for the targets in Section 2. The results and discussion are given in Section 3.

1.1 Candidate target selection
From Fermi LAT observations, it has been learned that emission from pulsars is stable. This feature greatly helps the selection of them from the dominant AGN sources. The latter are strong variables at multi-wavelengths including -ray (e.g., Williamson et al. 2014). In addition, the Fermi -ray spectra of pulsars generally have a form of an exponentially cutoff power law with the cutoff energies at several GeV (Abdo et al., 2013), i.e., some degree of curvature in their spectra is one feature of their emission. For comparison, AGN generally have ‘straight’ power law spectra (e.g., Ackermann et al. 2015b).
We thus selected candidate MSP targets from the high Galactic sources in the LAT third source catalog, since MSPs generally have an isotropic distribution (Abdo et al., 2013). A Galactic latitude of was used, which helped avoid the crowded Galactic plane. Then requiring that the sources have variability indices less than 72.44 (99% confidence for a source not being a variable) and the curvature significances greater than 3 (Acero et al., 2015), 101 sources were selected from the LAT catalog. Their positions in the Galactic coordinates are shown in Figure 1. As can be seen, nearly 40% of them are located within Galactic longitudes of 30 degrees, implying a high concentration towards the Galactic center direction. Such a distribution suggests that they are likely associated with the Milky Way.
2 Data Analysis
2.1 Fermi LAT Data
LAT, one of the two main instruments onboard Fermi, is an imaging -ray telescope conducting all-sky survey in the energy range from 20 MeV to 300 GeV. It was designed such that -ray events are distinguished from the background events through measuring the direction, energy, and arrival time of each -ray photon (Atwood et al., 2009). In the analysis of this paper, the data for each target we used are selected from Fermi Pass 7 Reprocessed database within 15 deg of the target’s position. The time period spans from 2008 August 4 15:43:39 to 2015 January 22 16:08:17 (UTC; nearly 6.5 yrs), and the energy range is from 200 MeV to 300 GeV to avoid the relative large uncertainties of the instrument response function of the LAT in the low energy range. Following the recommendations of the LAT team, we selected events with zenith angles less than 100 deg to exclude possible contamination from the Earth’s limb.
2.1.1 Maximum Likelihood Analysis
For each of our targets, we performed a standard binned maximum likelihood analysis (Mattox et al., 1996) to the data using the LAT science tools software package v9r33p0. Based on the LAT third source catalog, all sources within 25 deg centered at the position of each target were included to make the source model. The spectral parameters of these sources are provided in the catalog. The spectral normalization parameters of the sources within 5 deg from each target, which were considered if they were detected with significance, were set free. All the other parameters were fixed at their catalog values. Considering the Galactic and the extragalactic diffuse emission, we added the model gll_iem_v05_rev1.fits and the spectrum file iso_source_v05.txt to the source model. The normalization parameters of the diffuse emission were left free as well.


We obtained the Test Statistic (TS) map of a 2 region centered at the position of each target. Defined as TS, where and respectively are the maximum likelihood values for a model without and with an additional source at a specified location (Abdo et al., 2010b), the square root of a TS value is approximately equal to the detection significance for a given source. By examining the TS map of each target, we identified ‘isolated’ point-like sources among them, which we defined not to be mixed with other unknown sources or located in a region with strong, extended emission. We considered them as ‘clean’ targets. We then ran gtfindsrc in the LAT software package to determine the accurate positions for these clean targets. Among the initially selected 39 sources, there are 27 such clean sources. They are listed in Tables 1 & 2. The best-fit positions we obtained are consistent with those provided in the LAT third source catalog within error circles.
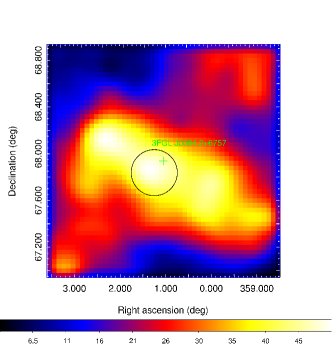
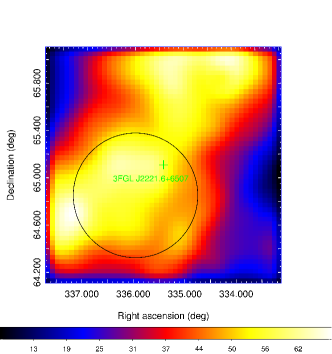
The other 12 sources are not clean point sources, as indicated by the TS maps we obtained. In Figure 2, two such examples are shown. They were found to be mixed with other unknown sources and/or located in a region with strong background. Further analysis of the groups of sources or the extended emission, which will help determine their true emission features, requires large amount of computing time. Therefore these 12 sources were excluded from our target list. To be complete, their spectral parameters provided in the LAT catalog are given here in Table 3. The spectra of J0004.2+6757 and J1827.7+1141 were fitted with a PL model, and the other 10 sources have spectra modeled with a LogParabola model,
| (1) |
where , , and are flux density, photon index, and the curvature, respectively. The energy was set such that errors on differential fluxes were minimal, and “Signif_curve” is the curvature significance estimated from likelihood values for a PL model or a LogParabola model.


2.1.2 Spectral Analysis
We extracted the -ray spectra for the clean point-like sources by performing two separate fits at their best-fit positions. First, We modeled each source with a simple power law (PL)
| (2) |
where is the normalization, is the photon index, and we set GeV. We evenly divided energy logarithmically from 0.1 to 300 GeV into 15 energy bands for the spectra analysis, and kept the photon index fixed to the value obtained from running gtlike at the best-fit position. For our results, only spectral data points with were kept. As mentioned above, pulsars generally have exponentially cutoff power-law spectra. We secondly repeated the analysis using a power law with an exponential cutoff (PLE)
| (3) |
where is the cutoff energy. By comparing results from the two spectral models, the curvature significance was obtained, which was estimated from , where and are the maximum likelihood values modeled with PLE and PL, respectively.
From this analysis, we found that for three sources, whose spectral results are given in Table 2, a PLE model is not significantly better than a PL one. Among them, J1601.9+2306 had a TS value from a PL model larger than that from a PLE. Their spectra are shown in Figure 4. We therefore excluded these three sources from our target list.
2.1.3 Variability Analysis
As a further check, we performed timing analysis of the LAT data for the 24 remaining sources. The time period from 2008 August 4 23:59:59 to 2014 December 31 23:59:57(UTC) was divided into 30-day intervals. We adopted the power law model leaving the photon index fixed at the value obtained in Section 2.1.2 and conducted likelihood analysis in each time bin at the best-fit position of each source. The light curves and TS curves were thus extracted. No significant flux variations were seen from the 30-day interval light curves, which are consistent with the results in the LAT third source catalog for them.


2.2 X-ray data analysis
We searched for possible X-ray counterparts to the 24 -ray sources. Among them, J1544.61125 has been studied at multiple wavelengths (including X-rays) and suggested to be a transitional MSP due to its similar emissional properties (Bogdanov & Halpern, 2015; Bogdanov, 2015), and J1625.10021 and J1653.60158 have been studied at X-ray energies and searched for potential optical/infrared counterparts (Kong et al., 2014; Hui et al., 2015). No analysis of their archival data was conducted. For each of the rest of the targets, its positional uncertainty region covered by any archival X-ray imaging data from XMM-Newton, Chandra, or Swift telescopes were searched and analyzed. We found that four -ray sources had X-ray sources in their uncertainty regions, 16 were covered by short Swift observations but with no detection of any X-ray sources.
For the detections, the Chandra data were reprocessed using the script chandra_repro in the Chandra Interactive Analysis Observation software (ciao 4.6). We used the source detection tool in ciao (celldetect) for source detection. A 10′′ radius cicular region centered at a source was used to extract the source’s photons, and a nearby source-free region with the same size was taken as the background. The source and background spectra were obtained with the ciao tool psextract. We used statistics in the spectral fitting.

Among the available Swift data for each target, we selected the dataset with the longest exposure time when there are multiple sets of data. The Swift XRT data were processed using the XRTDAS software included in the HEASOFT package (version 6.13) distributed by the High Energy Astrophysics Science Archive Research Center (HEASARC). For each observation, calibrated and cleaned PC-mode event files were produced with the xrtpipeline task. We used the ximage detection algorithm, detect, to locate X-ray point sources in the XRT images. The positions of the detected sources were then refined with using the task xrtcentroid of the XRTDAS package. We extracted photons from a circular region with 47\arcsec radius around a source and from a nearby source-free region with the same size as the background. We adopted the Cash Statistic (Cash, 1979) for spectral modelling due to the few net counts.
In the spectral fitting, due to the limited photon counts for most of our sources, only an absorbed power law was used as the model, where we fixed the absorption column density to the Galactic value (Dickey & Lockman, 1990) in the direction of each source. The obtained spectral parameters are given in Table 4. The power law photon indices range from for these sources and suggest that the X-ray emission is mostly non-thermal in nature. However, for the source J1627.8+3217, the power law model results in a large photon index, , which probably suggests a thermal scenario instead for this source. We thus also examined its spectrum with an absorbed blackbody model, where the absorption was fixed at the Galactic value. We found a temperature of with C = 5.9 for 3 degree of freedom (DoF). This model provides a more reasonable description of the data. For the source J2103.7-1113, two X-ray sources within the Fermi error circle were detected, and both were well described by an absorbed power law model.
For the non-detections, which resulted from short Swift observations, we estimated 3 upper limits on fluxes from the count rates using the webPIMMS222http://heasarc.gsfc.nasa.gov/cgi-bin/Tools/w3pimms/w3pimms.pl. An absorbed power law spectra with 1.7 photon index was assumed, and the absorption column density to a source was fixed at the Galactic value in the direction of the source (Dickey & Lockman, 1990). The flux upper limits for the Fermi sources are given in the Table 5.
3 Results and Discussion
Having analyzed the LAT data of 39 un-associated sources selected from the 3rd LAT source catalog, we found 27 clean point-like sources among them. Further requiring curvature significance in a spectrum, 24 sources were selected. Their spectral results are provided in Table 1. Among the 24 sources, J1544.61125 has been already well studied at multiple wavelengths, particularly X-rays, and suggested to be a transitional MSP (Bogdanov & Halpern, 2015; Bogdanov, 2015). The sources J1625.10021 and J1653.60158 have been studied as well and are listed as promising candidate MSPs (Hui et al., 2015). Moreover, an orbital period of 75 min was found for the second source from optical imaging, indicating its likely nature of being an MSP binary (Kong et al., 2014). These studies support our target selection and further data analysis selection.
Examining the obtained spectra, we note that since MSPs generally have -ray spectra with and in the ranges of 0.4–2.0 and 1.1–5.4 GeV respectively (see Abdo et al. 2013 for details), the sources J0318.10252 and J2053.92922 have the parameters of and 0.20.5, and GeV and GeV, respectively. The values, particularly for the first source, are not within the ranges defined from the known -ray MSPs. Their spectra are shown in Figure 4. As can be seen, the spectra have a fast drop in the low, 0.1–1 GeV energy range, not containing significant emission and thus making close to zero. Given the spectral property, they likely are not MSPs. In addition, the sources J0336.1+7500 and J2026.8+2813 appear to possibly have two components in their spectra, which are shown in Figure 5. We examined their TS maps and they are consistent with being point sources. Their TS maps at low (0.1–1.0 GeV) and high (1.0-300 GeV) energy ranges were also calculated, but no evidence was found from the TS maps for the cases such as the presence of an additional source in the region. These two sources are of interest for further investigation.
We note that source J1120.6+0713 was listed as an AGN in the first catalog of AGN detected by Fermi LAT (associated with CRATES J1120+0704; Abdo et al. 2010a), but it was not in the third catalog anymore (Ackermann et al., 2015a). The spectrum we obtained, which is shown in Figure 6, is well described by a PLE model. In addition, six sources in Table 1 were listed as promising dark matter subhalo candidates in Bertoni et al. (2015). The double identification is due to their selection criteria of non-variables with 20∘ Galactic latitudes (similar to ours) and curved spectra calculated from dark matter annihilation models. In any case, the likely MSPs J1544.61125 and J1625.10021 (see above) are in their list too, indicating the possibly high chance of identifying an MSP as a candidate dark matter subhalo. Information about possible nature of these sources is provided in Table 1.
Finally for the candidate MSPs in Table 1 that were covered by X-ray observations, we calculated their flux, which is defined as the total -ray flux in the energy range of 0.1–100 GeV (Abdo et al., 2013). The -ray–to–X-ray flux ratios (for the cases of having X-ray sources in the source field) or low limits on the flux ratios (for the cases of non-detection) were then estimated. The values are given in Table 4 and 5. For most of the known -ray MSPs, the ratios are in a range of 100–1000 (see Table 16 in Abdo et al. 2013). This property suggests that none of the X-ray sources listed in Table 4 are the counterparts. In addition, if we consider that the sources in Table 5 are MSPs, their low flux-ratio limits of 20–100 suggest that the X-ray observations are not sufficiently deep for detecting any X-ray counterparts. Further X-ray observations of them are needed in order to identify their MSP nature by finding X-ray counterparts.
Acknowledgements.
This research made use of the High Performance Computing Resource in the Core Facility for Advanced Research Computing at Shanghai Astronomical Observatory. This research was supported by the National Natural Science Foundation of China (11373055) and the Strategic Priority Research Program “The Emergence of Cosmological Structures” of the Chinese Academy of Sciences (Grant No. XDB09000000). Z.W. acknowledges the support by the CAS/SAFEA International Partnership Program for Creative Research Teams; J.V. by the Chinese Academy of Sciences President’s International Fellowship Initiative (CAS PIFI, Grant No. 2015PM059); and Y.X. by the Shanghai Natural Science Foundation for Youth (13ZR1464400) and the National Natural Science Foundation of China for Youth (11403075).References
- Abdo et al. (2010a) Abdo, A. A., et al. 2010a, ApJ, 714, 927
- Abdo et al. (2010b) —. 2010b, ApJS, 188, 405
- Abdo et al. (2013) —. 2013, ApJS, 208, 17
- Acero et al. (2015) Acero, F., et al. 2015, ApJS, 218, 23
- Ackermann et al. (2015a) Ackermann, M., Ajello, M., Atwood, W. B., & et al. 2015a, ApJ, 810, 14
- Ackermann et al. (2015b) Ackermann, M., et al. 2015b, ApJ, 810, 14
- Alpar et al. (1982) Alpar, M. A., Cheng, A. F., Ruderman, M. A., & Shaham, J. 1982, Nature, 300, 728
- Archibald et al. (2009) Archibald, A. M., et al. 2009, Science, 324, 1411
- Atwood et al. (2009) Atwood, W. B., et al. 2009, ApJ, 697, 1071
- Bassa et al. (2014) Bassa, C. G., et al. 2014, MNRAS, 441, 1825
- Benvenuto et al. (2014) Benvenuto, O. G., De Vito, M. A., & Horvath, J. E. 2014, ApJ, 786, L7
- Bertoni et al. (2015) Bertoni, B., Hooper, D., & Linden, T. 2015, J. Cosmology Astropart. Phys, 12, 35
- Bogdanov (2015) Bogdanov, S. 2015, ArXiv e-prints
- Bogdanov & Halpern (2015) Bogdanov, S., & Halpern, J. P. 2015, ApJ, 803, L27
- Cash (1979) Cash, W. 1979, ApJ, 228, 939
- Chen et al. (2013) Chen, H.-L., Chen, X., Tauris, T. M., & Han, Z. 2013, ApJ, 775, 27
- Dickey & Lockman (1990) Dickey, J. M., & Lockman, F. J. 1990, ARA&A, 28, 215
- Fruchter et al. (1988) Fruchter, A. S., Stinebring, D. R., & Taylor, J. H. 1988, Nature, 333, 237
- Hui et al. (2015) Hui, C. Y., et al. 2015, ApJ, 809, 68
- Kong et al. (2014) Kong, A. K. H., et al. 2014, ApJ, 794, L22
- Mattox et al. (1996) Mattox, J. R., et al. 1996, ApJ, 461, 396
- Papitto et al. (2013) Papitto, A., et al. 2013, Nature, 501, 517
- Pletsch et al. (2012) Pletsch, H. J., et al. 2012, Science, 338, 1314
- Radhakrishnan & Srinivasan (1982) Radhakrishnan, V., & Srinivasan, G. 1982, Current Science, 51, 1096
- Roberts (2013) Roberts, M. S. E. 2013, in IAU Symposium, Vol. 291, IAU Symposium, ed. J. van Leeuwen, 127–132
- Thompson (2008) Thompson, D. J. 2008, Reports on Progress in Physics, 71, 116901
- Williamson et al. (2014) Williamson, K. E., et al. 2014, ApJ, 789, 135
| Source name | Spectra model | Flux/ | Ec | TS | Signif_Curve | Comments | |
|---|---|---|---|---|---|---|---|
| (photons cm-2 s-1) | (GeV) | () | |||||
| J0212.1+5320 | PowerLaw | 14.5 0.9 | 2.17 0.04 | 848 | 9.11 | ||
| PLSuperExpCutoff | 10.8 0.9 | 1.3 0.1 | 2.6 0.5 | 924 | |||
| J0238.0+5237 | PowerLaw | 12 1 | 2.38 0.06 | 319 | 5.14 | ||
| PLSuperExpCutoff | 10 1 | 1.8 0.2 | 4 1 | 341 | |||
| J0312.10921 | PowerLaw | 6.0 0.8 | 2.26 0.08 | 190 | 5.13 | c-subhalo | |
| PLSuperExpCutoff | 4.0 0.8 | 1.2 0.3 | 2.0 0.6 | 211 | |||
| J0318.1+0252 | PowerLaw | 5.8 0.7 | 2.19 0.07 | 191 | 6.54 | c-subhalo | |
| PLSuperExpCutoff | 2.6 0.4 | 0.00 0.03 | 1.0 0.3 | 231 | non-MSP | ||
| J0336.1+7500 | PowerLaw | 9.5 0.8 | 2.24 0.05 | 389 | 6.67 | ||
| PLSuperExpCutoff | 7.1 0.8 | 1.5 0.2 | 3.0 0.8 | 431 | |||
| J0545.6+6019 | PowerLaw | 5.6 0.7 | 2.03 0.06 | 279 | 5.15 | ||
| PLSuperExpCutoff | 4.0 0.6 | 1.4 0.2 | 7 2 | 303 | |||
| J0758.61451 | PowerLaw | 7.5 0.9 | 2.32 0.07 | 212 | 4.91 | ||
| PLSuperExpCutoff | 5.2 0.9 | 1.4 0.3 | 2.3 0.8 | 234 | |||
| J0935.2+0903 | PowerLaw | 6.2 0.8 | 2.5 0.1 | 135 | 3.32 | ||
| PLSuperExpCutoff | 5.0 0.9 | 1.7 0.4 | 1.8 0.8 | 145 | |||
| J0953.71510 | PowerLaw | 5.4 0.6 | 2.13 0.07 | 227 | 6.73 | c-subhalo | |
| PLSuperExpCutoff | 2.1 0.6 | 0.6 0.4 | 1.5 0.4 | 269 | |||
| J1120.6+0713 | PowerLaw | 6.0 0.7 | 2.20 0.07 | 249 | 6.49 | AGN (?) | |
| PLSuperExpCutoff | 4.0 0.6 | 1.0 0.3 | 1.7 0.4 | 292 | |||
| J1225.9+2953 | PowerLaw | 7.0 0.7 | 2.11 0.06 | 436 | 6.59 | c-subhalo | |
| PLSuperExpCutoff | 4.7 0.7 | 1.3 0.2 | 3.3 0.8 | 469 | |||
| J1544.61125 | PowerLaw | 12 1 | 2.54 0.07 | 262 | 3.47 | c-MSP | |
| PLSuperExpCutoff | 11 1 | 2.1 0.2 | 3 2 | 27 | |||
| J1625.10021 | PowerLaw | 16.5 0.8 | 2.09 0.03 | 1261 | 13.16 | c-MSP | |
| PLSuperExpCutoff | 10.5 0.8 | 0.8 0.2 | 1.9 0.2 | 1433 | |||
| J1627.8+3217 | PowerLaw | 3.6 0.5 | 2.15 0.08 | 158 | 4.55 | ||
| PLSuperExpCutoff | 2.4 0.5 | 1.2 0.3 | 3 1 | 178 | |||
| J1653.60158 | PowerLaw | 31 1 | 2.32 0.03 | 1686 | 9.43 | c-MSP | |
| PLSuperExpCutoff | 27 1 | 1.75 0.08 | 3.3 0.5 | 1747 | |||
| J1730.6357 | PowerLaw | 7 1 | 2.17 0.08 | 124 | 4.49 | ||
| PLSuperExpCutoff | 4 1 | 1.1 0.4 | 3 1 | 143 | |||
| J1950.2+1215 | PowerLaw | 15 2 | 2.9 0.1 | 149 | 3.13 | ||
| PLSuperExpCutoff | 13 2 | 2.2 0.3 | 2 1 | 151 | |||
| J2026.8+2813 | PowerLaw | 10 1 | 2.57 0.09 | 87 | 4.91 | ||
| PLSuperExpCutoff | 7 2 | 0.9 0.6 | 0.9 0.3 | 111 | |||
| J2053.9+2922 | PowerLaw | 1.3 0.3 | 1.59 0.09 | 114 | 5.52 | non-MSP | |
| PLSuperExpCutoff | 0.5 0.1 | 0.2 0.5 | 8 3 | 146 | |||
| J2103.71113 | PowerLaw | 6.2 0.7 | 2.18 0.07 | 239 | 4.31 | c-subhalo | |
| PLSuperExpCutoff | 4.4 0.8 | 1.4 0.3 | 3 1 | 255 | |||
| J2117.6+3725 | PowerLaw | 15 1 | 2.57 0.06 | 314 | 4.16 | ||
| PLSuperExpCutoff | 14 1 | 2.0 0.2 | 2.5 0.9 | 327 | |||
| J2212.5+0703 | PowerLaw | 7.1 0.8 | 2.27 0.07 | 209 | 5.29 | c-subhalo | |
| PLSuperExpCutoff | 5.0 0.8 | 1.4 0.3 | 2.5 0.8 | 236 | |||
| J2233.1+6542 | PowerLaw | 21 2 | 2.69 0.07 | 240 | 4.60 | ||
| PLSuperExpCutoff | 19 2 | 1.9 0.3 | 1.6 0.6 | 252 | |||
| J2250.6+3308 | PowerLaw | 5.0 0.8 | 2.5 0.1 | 81 | 3.97 | ||
| PLSuperExpCutoff | 4.0 0.8 | 1.2 0.5 | 1.1 0.5 | 96 |
| Source name | Spectra model | Flux/ | Ec | TS | Signif_Curve | |
|---|---|---|---|---|---|---|
| (photon cm-2 s-1) | (GeV) | () | ||||
| J1543.50244 | PowerLaw | 8 1 | 2.7 0.1 | 103 | 2.22 | |
| PLSuperExpCutoff | 7 1 | 2.2 0.3 | 4 3 | 107 | ||
| J1601.9+2306 | PowerLaw | 4.4 0.8 | 2.3 0.1 | 107 | 3.55 | |
| PLSuperExpCutoff | 1 2 | 0.0 0.1 | 1.2 0.6 | 102 | ||
| J1722.70415 | PowerLaw | 11 1 | 2.49 0.09 | 121 | 0.68 | |
| PLSuperExpCutoff | 11 2 | 2.4 0.2 | 24 34 | 121 |
| Source name | Spectra model | Flux density/10-12 | E0 | Signif_Avg | Signif_Curve | ||
|---|---|---|---|---|---|---|---|
| (photon cm-2MeV-1s-1) | (MeV) | () | () | ||||
| J0004.2+6757 | PowerLaw | 0.6 0.1 | 2.5 | 1328.36 | 6.01 | 3.91 | |
| J1827.7+1141 | PowerLaw | 0.18 0.03 | 2.1 | 1960.79 | 6.49 | 3.81 | |
| Source name | Spectra model | Flux density | Eb | Signif_Avg | Signif_Curve | ||
| (photon cm-2MeV-1s-1) | (MeV) | () | () | ||||
| J0008.5+6853 | LogParabola | 4.3 0.5 | 2.4 | 0.9 | 820.26 | 8.45 | 6.49 |
| J0345.3+3236 | LogParabola | 6.8 0.9 | 2.4 | 1.0 | 641.45 | 7.68 | 5.00 |
| J0431.7+3503 | LogParabola | 2.1 0.3 | 2.6 | 0.3 | 941.06 | 7.85 | 4.02 |
| J0539.20536 | LogParabola | 11 1 | 2.5 | 1.0 | 556.20 | 7.35 | 5.10 |
| J1729.90859 | LogParabola | 19 2 | 2.6 | 1.0 | 445.58 | 7.18 | 5.40 |
| J2125.8+5832 | LogParabola | 4.4 0.6 | 2.4 | 1.0 | 774.12 | 7.47 | 4.01 |
| J2206.5+6451 | LogParabola | 4.5 0.5 | 2.8 | 0.7 | 803.49 | 8.60 | 6.03 |
| J2221.6+6507 | LogParabola | 6.1 0.8 | 2.6 | 0.9 | 678.66 | 7.45 | 4.80 |
| J2221.7+6318 | LogParabola | 7.0 0.8 | 2.5 | 1.0 | 739.95 | 8.42 | 6.65 |
| J2310.10557 | LogParabola | 0.49 0.08 | 1.8 | 0.8 | 1490.34 | 8.97 | 5.35 |
| Source | R.A. | Dec. | DoF | |||||
|---|---|---|---|---|---|---|---|---|
| name | (h:m:s) | () | () | |||||
| J0212.1() | 02:12:10.46 | +53:21:37.62 | 3.1/4(C) | 16.6 | 9.0 | |||
| J0212.1() | 02:12:10.50 | +53:21:38.94 | 115/107 | 16.6 | 9.4 | |||
| J1120.6() | 11:20:42.54 | +07:13:12.74 | 2.4/2(C) | 6.2 | 8.5 | |||
| J1627.8() | 16:27:42.85 | +32:20:58.56 | 5.6/3(C) | 3.1 | 7.2 | |||
| J2103.7() | 21:03:49.99 | -11:13:40.62 | 24/13 | 6.9 | 43 | |||
| J2103.7() | 21:03:52.31 | -11:11:32.66 | 17/21 | 6.9 | 69 |
Notes: (1) Source Name, where or indicate the Swift or Chandra observation used in the analysis, respectively, and the observation IDs (exposure time) in the sequence of the table are 00041276001 (3.3 ks), 14814 (30 ks), 0003164100(4.3 ks), 00041418001 (3.5 ks), 12381 (30 ks); (2)–(3) Right Ascension (R.A.) and Declination (Dec.) of each X-ray source, equinox J2000.0; (4) Absorption column density; (5) Power law index; (6) Unabsorbed flux in 0.3–10 keV band (in units of 10-12 erg cm-2 s-1); (7) The DoF value for the model, where C-statistics is indicated by C; (8) Fermi LAT flux in the energy range of 0.1–100 GeV (in units of 10-12 erg cm-2 s-1); (9) Flux ratio between and .
| Source | ObsID | Exp | ||||
|---|---|---|---|---|---|---|
| name | (sec) | () | () | () | ||
| J0238.0 | 00047142003 | 3363 | 13 | |||
| J0312.1 | 00047144004 | 3738 | 5.9 | |||
| J0318.1 | 00084649005 | 1817 | 5.1 | |||
| J0336.1 | 00047146002 | 1672 | 11 | |||
| J0545.6 | 00084664005 | 2066 | 8.3 | |||
| J0758.6 | 00041341002 | 2569 | 7.3 | |||
| J0935.2 | 00084964006 | 668 | 5.7 | |||
| J0953.7 | 00031656001 | 3517 | 5.6 | |||
| J1225.9 | 00041382001 | 4005 | 8.4 | |||
| J1730.6 | 00084792002 | 1672 | 7.2 | |||
| J1950.2 | 00085096001 | 802 | 52 | |||
| J2026.8 | 00085106001 | 2462 | 7.9 | |||
| J2117.6 | 00041492001 | 3716 | 15 | |||
| J2212.5 | 00047320001 | 2497 | 7.3 | |||
| J2233.1 | 00084887001 | 2670 | 20 | |||
| J2250.6 | 00085140002 | 1952 | 4.5 |
Notes: (1) Source Name; (2) ID of the Swift observation used for the analysis; (3) Exposure time in seconds for each observation; (4) Absorption column density; (5) The upper limit on flux in 0.3–10 keV band (a power law with 1.7 photon index was assumed); (6) Fermi LAT flux in the energy range of 0.1–100 GeV; (7) Low limits on flux ratio between and .