Massive open star clusters using the VVV survey
Abstract
Context. The ESO public survey VISTA Variables in the Vía Láctea (VVV) has contributed with deep multi-epoch photometry of the Galactic bulge and the adjacent part of the disk over 526 square degrees. More than a hundred cluster candidates have been reported thanks to this survey.
Aims. We present the fifth article in a series of papers focused on young and massive clusters discovered in the VVV survey. In this paper, we present the physical characterization of five clusters with a spectroscopically confirmed OB-type stellar population.
Methods. To characterize the clusters, we used near-infrared photometry (, and ) from the VVV survey and near-infrared -band spectroscopy from ISAAC at VLT, following the methodology presented in the previous articles of the series.
Results. All clusters in our sample are very young (ages between 1-20 Myr), and their total mass are between and . We observed a relation between the clusters total mass and the mass of their most massive stellar member , even for clusters with an age 10 Myr.
Key Words.:
Stars: early-types, massive - Techniques: photometric, spectroscopic - Galaxy: Disk, open clusters and associations: individual VVV CL027, VVV CL028, VVV CL062, VVV CL088, VVV CL089.1 Introduction
Young massive clusters (cluster total mass , Portegies Zwart et al. 2010 or , Hanson & Popescu 2007) play a central role in the structure and evolution of their host galaxies. The clusters’ massive stellar population may induce or diminish the formation of other stars, add kinetic energy to the interstellar medium through their massive winds, and enrich the medium with metallic elements during their lives through stellar winds and in their final explosion as supernova. The young clusters also help us to trace the spiral structure of the Milky Way and to study massive stellar population in several evolutionary stages.
Despite their massive and luminous population, massive clusters are located behind a large amount of extinction. Clusters younger than a few Myr, classified as Phase I according to Portegies Zwart et al. (2010), present on-going stellar formation and a large amount of gas and dust. The dust often makes their detection impossible when using optical images. This is one of the main reasons that we know of less than 10 % of the expected population. Near-infrared all-sky surveys – such as the Two Micron All-Sky Survey, (2MASS, Skrutskie et al., 2006), the Galactic Legacy Infrared Midplane Survey Extraordinaire, (GLIMPSE, Benjamin et al., 2003), and the UKIRT Infrared Deep Sky Survey (UKIDSS, Lawrence et al., 2007)– made it possible to discover the most massive stellar clusters in the Galaxy.
The ESO public survey VISTA Variables in the Vía Láctea (VVV, Minniti et al., 2010; Saito et al., 2010, 2012) is a perfect tool for this exploration. The VVV survey covers the Galactic bulge and the adjacent disk region, including the far edge of the bar, with a spatial resolution of 0.34 arcsec pix-1 in ZYJH filters. Three catalogues with new cluster candidates have been published using VVV data: Borissova et al. (2011), Borissova et al. (2014), and Solin et al. (2014).
In this paper we present the characterization of five young clusters from the Borissova et al. (2011) catalogue. The paper is part of a series dedicated to young clusters discovered using the VVV survey (Chené et al., 2012, 2013, 2015; Ramírez Alegría et al., 2014). The methodology for the observation and characterization of the clusters is similar to the one presented in the previous articles of the series. The observations are described in Section 2, together with the general method used for the cluster analysis. In Section 3, we present the individual parameters derived for each cluster. In this section we also discuss the relation proposed by Weidner et al. (2010) between the cluster total mass and the mass of its most massive star (), using our sample of new characterized clusters. Finally, we summarize the results of this paper in Section 4.
![[Uncaptioned image]](/html/1602.04898/assets/vvvcl027_Ks.jpg)
![[Uncaptioned image]](/html/1602.04898/assets/vvvcl027_c01_Ks.jpg)
![[Uncaptioned image]](/html/1602.04898/assets/vvvcl027_c02_Ks.jpg)
![[Uncaptioned image]](/html/1602.04898/assets/vvvcl028_Ks.jpg)
![[Uncaptioned image]](/html/1602.04898/assets/vvvcl028_c01_Ks.jpg)
![[Uncaptioned image]](/html/1602.04898/assets/vvvcl028_c02_Ks.jpg)
![[Uncaptioned image]](/html/1602.04898/assets/vvvcl062_Ks.jpg)
![[Uncaptioned image]](/html/1602.04898/assets/vvvcl062_c01_Ks.jpg)
![[Uncaptioned image]](/html/1602.04898/assets/vvvcl062_c02_Ks.jpg)
![[Uncaptioned image]](/html/1602.04898/assets/vvvcl088_Ks.jpg)
![[Uncaptioned image]](/html/1602.04898/assets/vvvcl088_c01_Ks.jpg)
![[Uncaptioned image]](/html/1602.04898/assets/vvvcl088_c02_Ks.jpg)
2 Observations and general method
2.1 Observations
| Cluster ID | RA (J2000) | Dec (J2000) | l | b | Obs. dates |
|---|---|---|---|---|---|
| [deg] | [deg] | [deg] | [deg] | ||
| VVV CL027 | 203.100 | -62.727 | 307.605 | -0.228 | 11 April 2011; 4, 15 May 2011 |
| VVV CL028 | 205.096 | -61.733 | 308.693 | +0.590 | 5 May 2011 |
| VVV CL062 | 243.033 | -51.969 | 331.172 | -0.458 | 6 May 2011 |
| VVV CL088 | 253.142 | -44.602 | 341.129 | -0.347 | 23 April 2011 |
| VVV CL089 | 253.446 | -43.267 | 342.301 | +0.329 | 21 April 2011 |
For this work we used near infrared images from the VVV survey and spectroscopic data from the Infrared Spectrometer and Array Camera (ISAAC) at the Very Large Telescope (VLT, Cerro Paranal, Chile).The studied clusters are part of a larger spectroscopic campaign and were selected by the presence of OB-type stars in their population. The original group also included VVV CL086 (Ramírez Alegría et al., 2014) and VVV CL041 (Chené et al. 2015, submitted).
The VVV survey uses the VISTA Infrared Camera (VIRCAM) at the Visible and Infrared Survey Telescope for Astronomy (VISTA) (Emerson et al., 2006; Dalton et al., 2006). VIRCAM has a 16-detector array (each detector with a 20482048 pixel size), and a pixel scale of 0.34 arcsec pix-1. The 16 detectors are separated by gaps (42.5% of the detector in the Y axis, 90% in the X axis), forming an array called pawprint with an individual coverage of 0.59 square degrees. After a series of six vertical and horizontal shifts, the individual pawprints are combined into a single tile with a total of 1.64 square degrees field of view (Saito et al., 2012).
We measured the photometry directly from the stacked images from the VISTA Science Archive (VSA) website111http://horus.roe.ac.uk/vsa/. We used all available images from completed programmes between February 2010 and August 2013. We used between 32 and 70 images for the clusters in the filter, since VVV survey has multi-epoch data in this filter.
We used the VVV-SkZ pipeline (Mauro et al., 2013) to determine the stellar photometry. This is an automated software based on ALLFRAME (Stetson, 1994) and optimized for VISTA PSF photometry. The pipeline uses only the paw-print images to avoid the variable PSF observed across the combined tiles. The VVV-SkZ pipeline allows the PSF to vary quadratically across the paw-print field of view.
The final catalogue generated by the pipeline was calibrated astrometrically and photometrically using 2MASS. Photometric errors are lower than 0.2 mag for mag and 0.5 mag for mag. We assumed 2MASS photometry for sources brighter than mag to avoid saturation.
For near-infrared spectroscopy, we selected bright stars from the cluster region. These stars were observed with ISAAC/VLT in service mode during April and May 2011. Spectra were acquired in the band (), using a 0.3″wide slit with a resolution . To correct the atmospheric OH emission lines, we nodded along the slit following an ABBA nod pattern. The average signal-to-noise ratio per pixel ranges from 30 to 150. To correct the telluric lines, we observed bright B8 to A2 V stars (telluric standards). The spectra of these objects only presents the Brackett series, which can be modelled and subtracted, leaving only the telluric lines. To ensure similar conditions between the cluster stars and the standard telluric lines, we observed them using the same airmass and within a reduced time frame.
For spectroscopic data reduction (flat-fielding, sky subtraction, spectra extraction, and wavelength calibration), we used the Interactive Data Language (IDL) and iraf222iraf is distributed by the National Optical Astronomy Observatories, which are operated by the Association of Universities for Research in Astronomy, Inc., under cooperative agreement with the National Science Foundation. scripts in a similar procedure to the one described by Chené et al. (2012) and Chené et al. (2013). For the wavelength calibration, we used the OH line from the spectra. This was done because of the sudden shifts in the direction of the spectral dispersion along the calibration lamp. The shifts occurred during the observing night, making it impossible to determine a unique wavelength solution for the entire run. The final wavelength solution has a RMS uncertainty of 0.5 pixels.
2.2 Statistical decontamination
The photometry was statistically field-star-decontaminated using the FORTRAN algorithm of Bonatto & Bica (2010), as described by Borissova et al. (2011) and the papers of this series (Chené et al., 2012, 2013; Ramírez Alegría et al., 2014). We used the latest version of the algorithm, which includes polygonal control regions, artificial reddening of the control-field population, and an algorithm for determing grid size in colour-magnitude space. The algorithm divides the , and ranges into a grid of cells. In each cell, it estimates the expected number density of cluster stars by subtracting the respective field-star number density. By summing over all the cells, it obtains a total number of member stars, . Grid shifts of 1/3 the cell size are applied in each axis, producing 729 independent binnings and . The average of these 729 (or ) is the limit for considering a star as a possible cluster member. Only the with the highest survival frequency after all tests were finally considered as cluster members.
To ensure photometric quality, we restricted the analysis to stars with magnitude and colour errors smaller than 0.2 mag. The coordinates of the control fields and the radius used for the decontaminations are given in Table 2. The area of the control fields was corrected to match the cluster field area, and the position and size of the control fields were chosen based on the distribution of stars and clouds in the image.
| ID | RA (J2000) | Dec (J2000) | Radius |
|---|---|---|---|
| [deg] | [deg] | [arcmin] | |
| VVV CL027 | 202.899994 | -62.700001 | 0.35 |
| 202.981827 | -62.746994 | 0.35 | |
| VVV CL028 | 205.100601 | -61.718102 | 0.25 |
| 205.087265 | -61.746513 | 0.25 | |
| VVV CL062 | 243.111435 | -51.950371 | 0.75 |
| 243.065536 | -51.993530 | 0.75 | |
| VVV CL088 | 253.251495 | -44.705376 | 1.00 |
| 253.214630 | -44.610310 | 1.00 | |
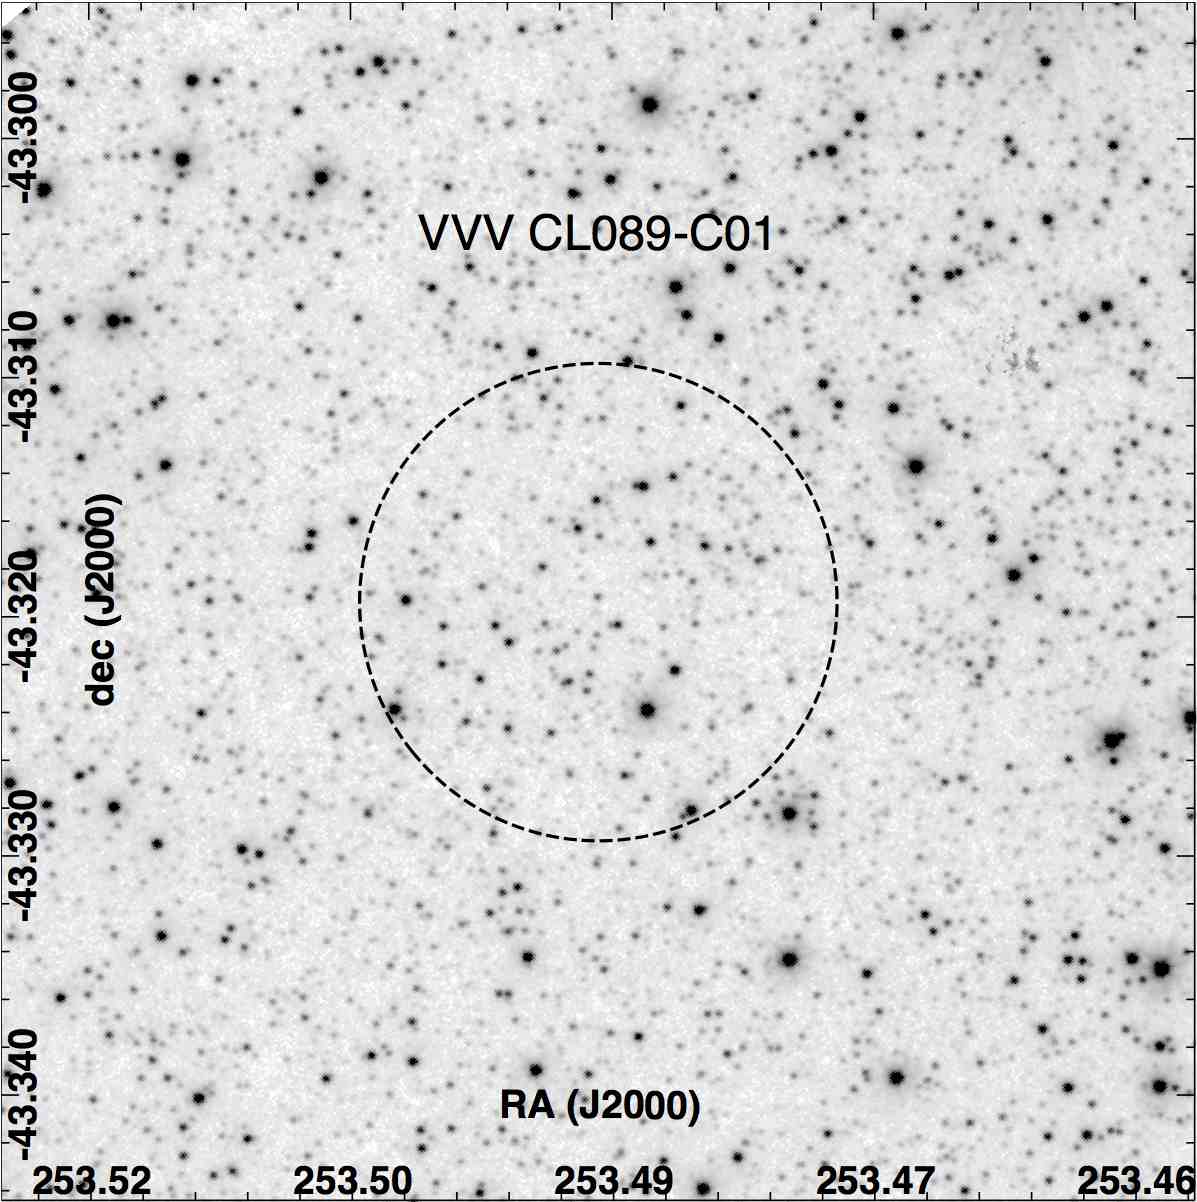
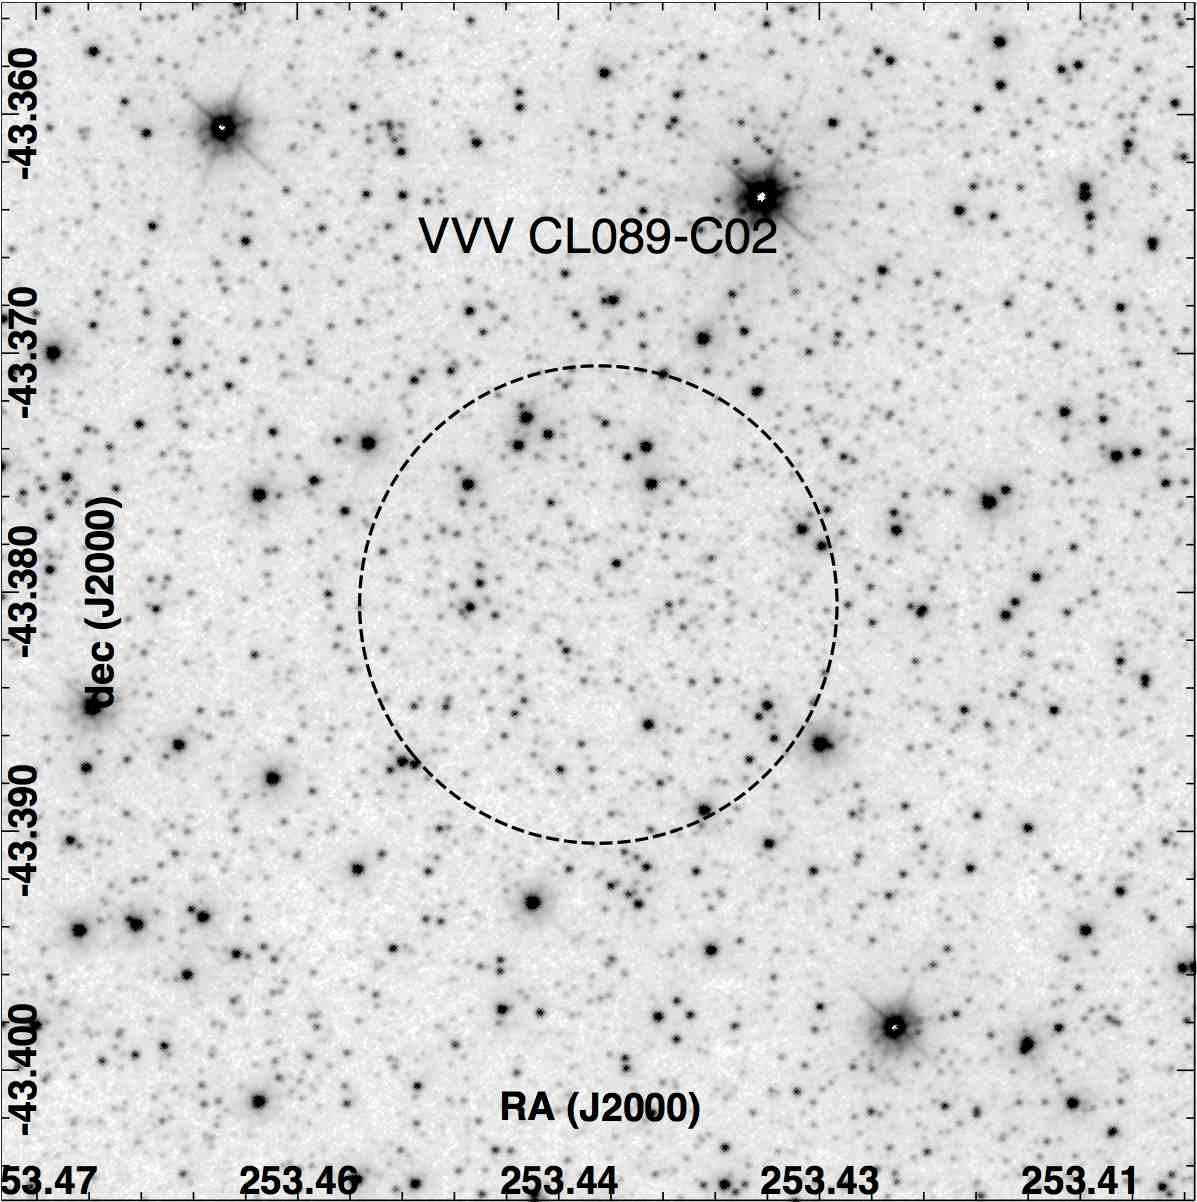
| VVV CL089 | 253.485992 | -43.319336 | 0.60 |
| 253.437851 | -43.380417 | 0.60 |
2.3 Spectral classification
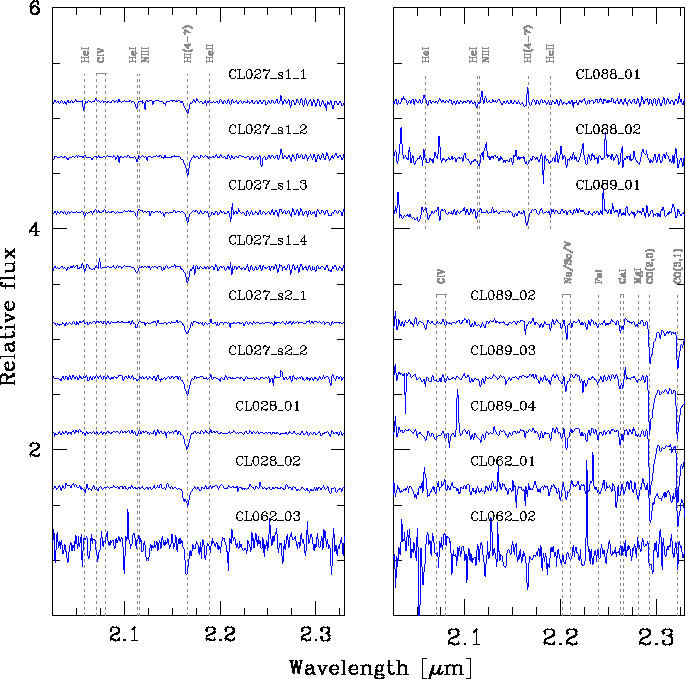
We based the near-IR spectral classification of the OB stellar types on the two Hanson et al. atlases. To assure a similar resolution between our spectra and the comparison ones, we used only spectra with R3000 from the Hanson et al. (1996) catalogue and degraded the resolution for the Hanson et al. (2005) spectra, using the iraf task splot. For later spectral types, we used Wallace & Hinkle (1997).
The classification scheme is based on the detection of absorption lines and the comparison of their depth and shape with similar resolution spectra of known spectral types. The spectral lines used for the qualitative spectral classification are labelled in the individual spectra of Figure 2. For early type stars we used the He I at 2.06 and 2.11 , He II at 2.19 , the H I (4-7) at 2.17 lines, the N III multiplet at 2.12 , and the C IV triplet at 2.08 . For the assigned spectral type we assumed an error of subtypes, similar to Hanson et al. (2010) and Negueruela et al. (2010). Table 3 contains the coordinates, near-infrared magnitudes, and spectral types for the stars with spectroscopic observations.
2.4 Cluster physical characterization
For individual distance estimates, we compared the apparent and intrinsic magnitude derived from the individual spectral type. For clusters with two or more stars where the distance estimates agree with a common distance, we assumed the averaged individual estimates as the cluster parameter (extinction and distance). We adopted the Stead & Hoare (2009) extinction law and intrinsic magnitudes from Martins et al. (2005) in the case of O-type stars. We used Cox (2000) for stars later than B0 V. Distance errors are dominated by the spectral type determination uncertainty. We estimated them by deriving the individual distance for the same star assuming spectral subtypes. The cluster distance and extinction errors were estimated using the error propagation method described by Barlow (2004). Table 3 includes the individual extinction and distance determinations for those stars with spectroscopy.
To estimate the total cluster mass, we first constructed the cluster present-day mass function (P-DMF) using the colour-magnitude diagram (CMD) and then integrated the Kroupa (Kroupa, 2001) initial mass function (IMF) fitted to the cluster IMF. Because we did not detect evolved stars in our spectroscopic sample and most of the clusters are surrounded by a nebulosity detected in mid-infrared images, we assumed that the P-DMF and the IMF are equivalent.
We obtained the cluster P-DMF by projecting all CMD stars following the reddening vector to the main sequence located at the cluster distance. The main sequence is defined by the colours and magnitudes given by Cox (2000). After deriving the cluster present-day luminosity function, using 1 mag bins ( band), we converted the magnitudes to solar masses using values from Martins et al. (2005) for O-type stars. We used Cox (2000) for stars with type later than B0 V. The P-DMF is fitted by a Kroupa (2001) IMF and a best fit function. We estimated the cluster total mass by integrating the fitted IMF between 0.10 (log dex) and the P-DMF upper mass limit. Our analysis only included the errors associated with the fitting to the process.
3 Results
| ID | RA (J2000) | Dec (J2000) | Spectral type | Distance | ||||
| [deg] | [deg] | [mag] | [mag] | [mag] | [mag] | [kpc] | ||
| VVV CL027 | ||||||||
| s1_1 | 203.10332 | -62.72932 | 12.2460.016 | 11.6030.023 | 11.2820.002 | O9 V | 0.55 | 6.33 |
| s1_2 | 203.10117 | -62.72808 | 12.8310.021 | 12.1160.037 | 11.7950.003 | B1 V | 0.59 | 6.13 |
| s1_3 | 203.09920 | -62.72679 | 11.4720.016 | 10.7820.029 | 10.5230.003 | O7–8 V | 0.56 | 5.76 |
| s1_4 | 203.09803 | -62.72608 | 13.0270.016 | 12.3730.030 | 12.0700.003 | B0–1 V | 0.55 | 7.54 |
| s2_1 | 203.09905 | -62.72788 | 11.2640.037 | 10.4480.070 | 10.3450.053 | B1–2 V | 0.53 | 3.22 |
| s2_2 | 203.09809 | -62.72722 | 12.6240.014 | 11.9200.024 | 11.6700.003 | B3 V | 0.55 | 4.55 |
| VVV CL028 | ||||||||
| 01 | 205.09793 | -61.73414 | 12.1410.035 | 11.5850.058 | 11.5030.003 | B2 V | 0.400.02 | 5.14 |
| 02 | 205.09552 | -61.73313 | 13.0540.008 | 12.6070.016 | 12.3700.003 | B3 V | 0.420.02 | 6.66 |
| VVV CL062 | ||||||||
| 01 | 243.028452 | -51.97175 | 14.4080.032 | 12.5970.050 | 11.5440.054 | K0–1 III | 1.05 | 2.62 |
| 02 | 243.033683 | -51.97189 | 14.4960.057 | 12.8030.063 | 11.8720.052 | late G III | ||
| 03 | 243.038669 | -51.97181 | 10.1420.024 | 9.2390.024 | 8.8470.025 | B5 V | 0.700.01 | 0.90 |
| VVV CL088 | ||||||||
| 01 | 253.14172 | -44.60115 | 14.4130.055 | 12.2510.500 | 11.1040.500 | O9–B0 V | 1.670.01 | 3.28 |
| 02 | 253.14058 | -44.60144 | 14.1750.089 | 11.7900.500 | 10.5020.500 | O9 V | 1.840.01 | 2.44 |
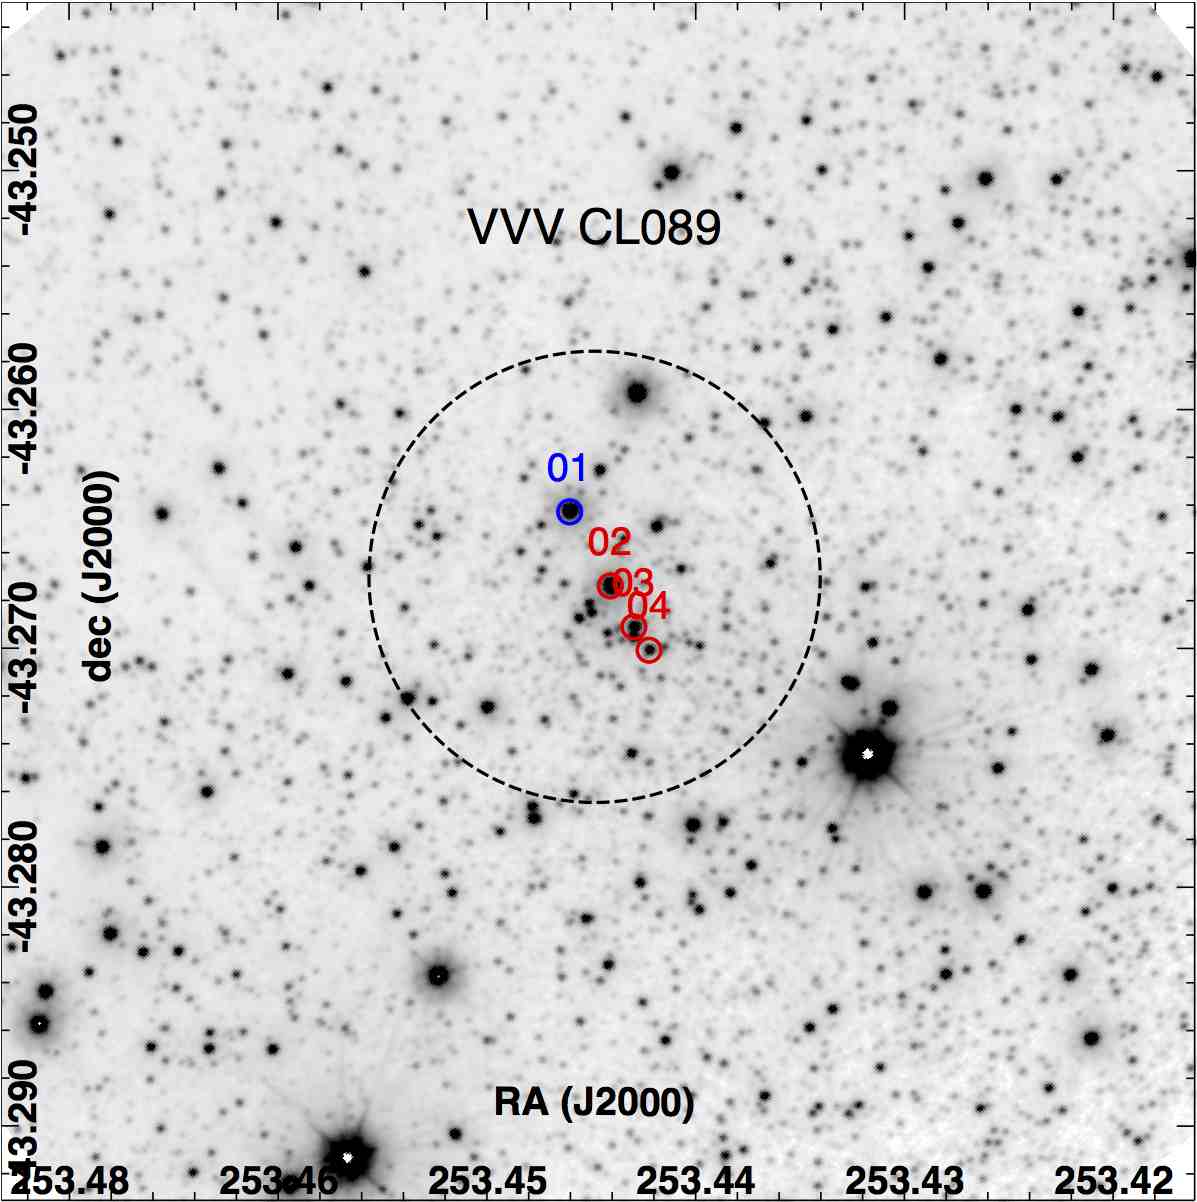
| VVV CL089 | ||||||||
| 1 | 253.44736 | -43.26425 | 12.6400.024 | 10.3270.024 | 9.3050.021 | O9 V | 1.680.02 | 1.51 |
| 2 | 253.44499 | -43.26738 | 13.8570.067 | 10.7060.051 | 9.3440.037 | K2 III | 1.79 | 0.89 |
| 3 | 253.44365 | -43.26912 | 14.3360.073 | 11.6520.500 | 10.4510.500 | K5 III | 1.39 | 3.73 |
| 4 | 253.44280 | -43.27004 | 15.1800.070 | 12.9490.086 | 11.7630.075 | K5 III | 1.17 | 6.14 |
3.1 Individual clusters
-
•
VVV CL027: For this cluster we have the largest set of spectroscopically observed stars. Our spectral classification indicates the presence of 2 O-type and 4 B-type dwarfs. We observe them using two slits: slit number 1 contains the stars s1_1, s1_2, s1_3, and s1_4; slit number 2 contains stars s2_1 and s2_2.
The spectrum of star s1_1 presents the He I 2.06 and 2.11 lines, and its H I (4-7) line is clear and broad. Spectral lines are similar to the O9 V spectral lines (e.g. O9 V HD 193322). Spectra s1_2 clearly shows the He I 2.11 and H I (4-7) lines, similar to B0.5 V-HD 36960 and B1.5 V-HD 36959. We adopted the spectral type B1 V for this star.
For star s1_3, we observed He I at 2.06 , 2.11 , He II at 2.19 , and the H I (4-7) lines. For this spectrum, we also detected unidentified features with similar depths. The N III complex at 2.12 , and the previously mentioned lines fit the O7 V HD 54662 and the O8 V HD 48279 spectra. We assumed a O7–8 V spectral type for this object.
Stars s1_4, s2_1, and s2_2 spectra show the H I (4-7) and He I at 2.11 lines. For these stars we adopted a B0–1 V (star s1_4), B1–2 V (star s2_1), and B3 V (star s2_2) spectral type.
The cluster distance estimate is 6.08 kpc, and the mass estimate for the cluster is (integrating the Kroupa IMF fitted until 25 ). The Lejeune & Schaerer (2001) main sequence isochrone fitting to the decontaminated CMD only indicates that the cluster is younger than 10 Myr. The presence of a O7–8 V star also sets an upper limit of 7.0 Myr (Meynet & Maeder, 2000) for the cluster age, in agreement with the pre-main sequence turn-on point observed in the CMD. We estimate a cluster age between 0.7 and 7.0 Myr.
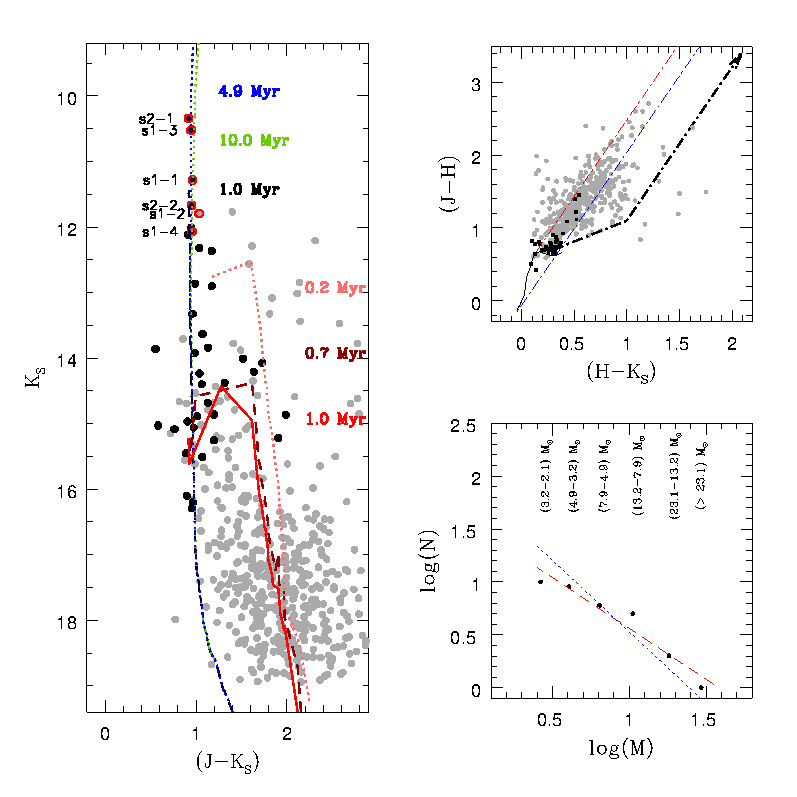
Figure 3: Left: VVV CL027 field-star decontaminated CMD. The most probable cluster members and field stars are labelled with black and grey symbols, respectively. Numbers indicate the position for the spectroscopically observed stars. Main (1.0, 4.9, and 10.0 Myr, Lejeune & Schaerer 2001) and pre-main sequence (0.2, 0.7, and 1.0 Myr, Siess et al. 2000) isochrones are also shown in the diagram. Right, top: VVV CL027 field-decontaminated colour-colour diagram (CCD). We use the same symbols as in the CMD to show the most probable cluster members and field stars. The projected position following the Stead & Hoare (2009) extinction law of an O8 V (blue) and a K5 V (red) star are presented in the diagram. The thicker black segmented line shows the expected position for T Tauri stars along the extinction vector. Right, bottom: VVV CL027 P-DMF. The points show the central position in the mass ranges indicated above them, and the segmented red line corresponds to the best fit to the data. -
•
VVVĊL028: The two spectroscopically observed stars show early B-dwarf spectral features. The He I 2.06 line is not detected in any of the spectra, and the He I 2.11 line is observed in the spectra of star number 01. The shallower H I (4-7) line and the He I 2.11 line indicate that star 01 is earlier than star 02. Both spectra present a clear H I (4-7) line, but it is not very deep (discarding late-B or A-type). We adopted the spectral types B2 and B3 V for stars 01 and 02, respectively.
The individual distance estimates for the two B V observed stars agree with a single distance of 5.90 kpc. This cluster is located in the centre of a mid-infrared bubble (Figure 4), which was previously identified and studied by Martins et al. (2010). In this work, they observed and spectrally classified 18 OB type stars (between O4 and B2.5 V/III) around the region RCW 79, most of them located around 80 from the cluster centre. The distance of 4.2 kpc reported by Martins et al. (2010) allows us to discard a possible association between VVV CL028 and RCW 79. Visual inspection of WISE images also indicates that the cluster would not present associated mid-infrared emission, and the individual extinction estimates indicate that the cluster is neither immersed in a cloud nor associated to RCW 79.
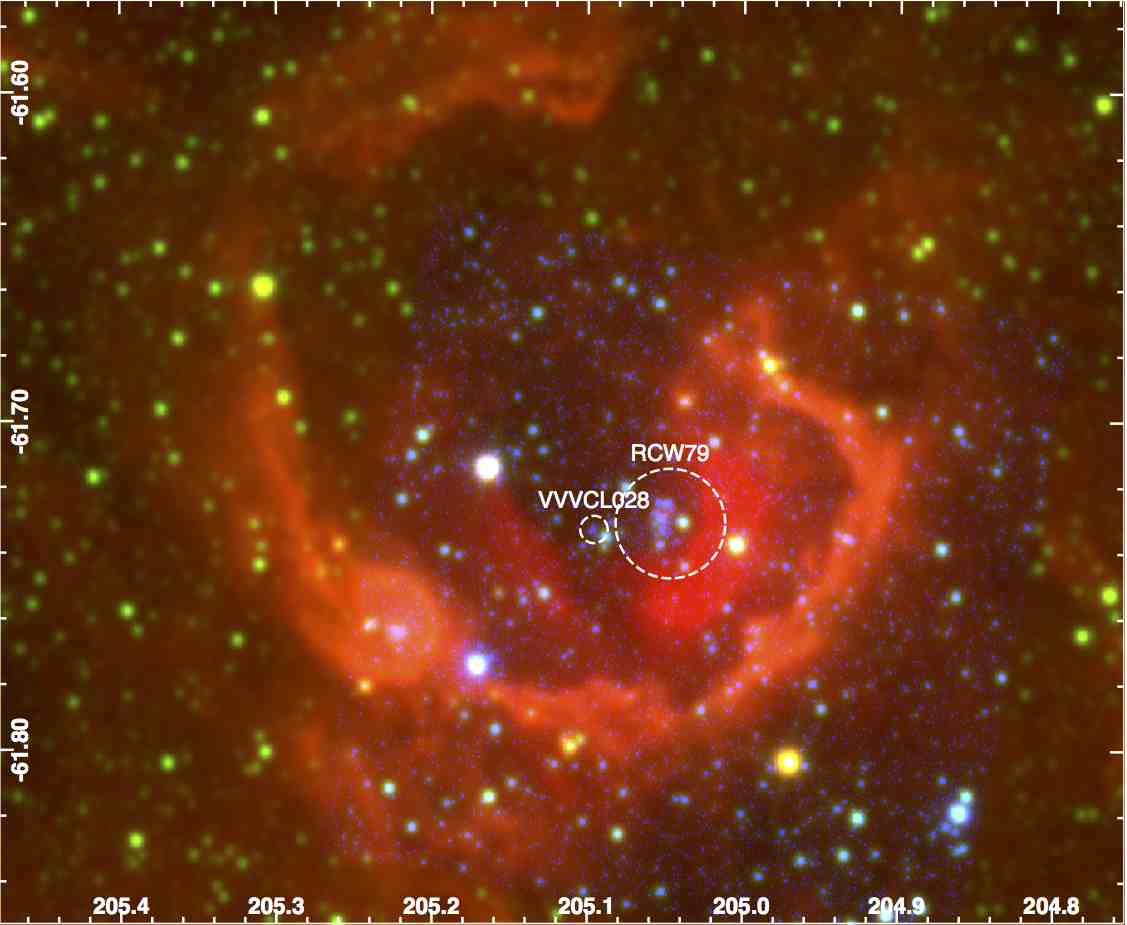
Figure 4: False colour (=blue, WISE W2=green, WISE W3=red) image for VVV CL028. The central yellow circle indicates the position and extension of the cluster candidate. North is up, east is left. By integrating the best fit function to the cluster P-DMF between 0.1 and 11 , we estimated a cluster total mass of . We could not identify the cluster main sequence clearly in the CMD (Fig. 5), therefore an age estimate using isochrone fitting would not yield a reliable result. Considering the B2 V star as the most massive cluster member, we estimate an upper limit for the cluster age of 20 Myr (Meynet & Maeder, 2000).
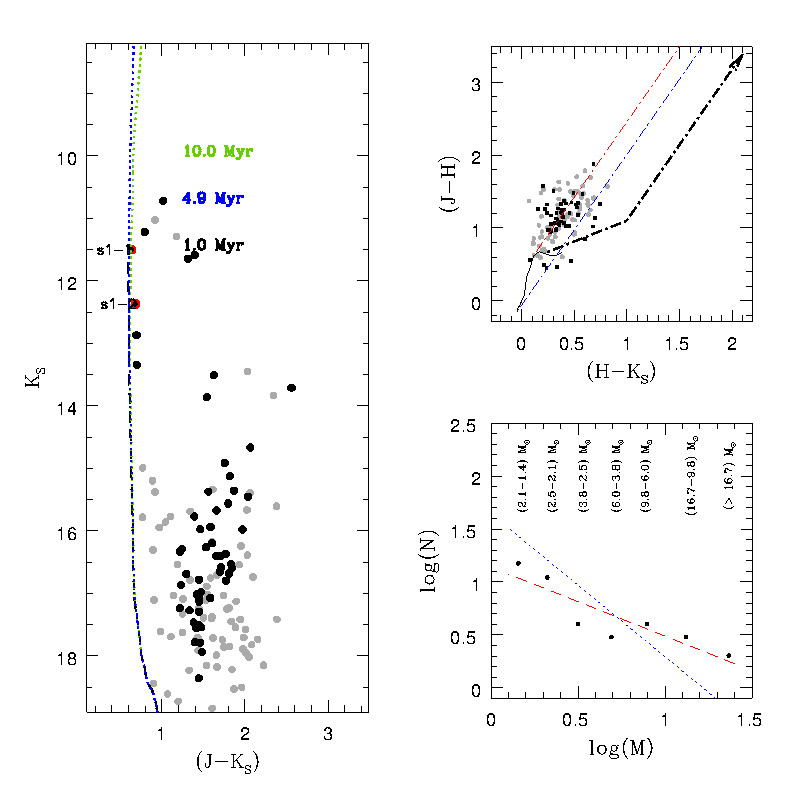
Figure 5: Left: VVV CL028 field-star decontaminated CMD. Main-sequence (1.0, 4.9, and 10.0 Myr, Lejeune & Schaerer 2001) isochrones are shown in the diagram. For the CMD and CCD we use the same colour code than Figure 3. Right, top: VVV CL028 field-decontaminated CCD. Right, bottom: VVV CL028 P-DMF. The points show the central position in the mass ranges indicated above them, and the lines correspond to the best fit (red, segmented) and the Kroupa IMF fitted (blue, dotted) to the data. -
•
VVV CL062: Two of the observed spectra (objects 01 and 02) show the 12CO (2,0) band in absorption, indicating a late spectral type. In the case of spectra 01, it fits K0-1 III spectra (for example, HR 8694, HR 8317, or HR 6299 spectra). The CO band of star number 02 indicates a late G-giant spectral type. The low signal-to-noise ratio for this spectrum does not allow a more precise classification.
The spectrum of star 03 clearly presents the H I (4-7) line in absorption. The depth and shape of this line fits a B5 V spectral type (between B3 V HR 5191 and B7 V HR 3982). Other features cannot be clearly observed in the spectrum. We adopted this B5 V distance estimate (i.e., 0.90 kpc) as the cluster distance, but a follow-up (spectroscopic or astrometric) for VVV CL062 is necessary for a better characterization of its stellar population).
The nebulae detected in the WISE W3 image of VVV CL062 (Fig. 6) suggest that it is a very young object. The main sequence isochrone fitting in the CMD (Fig. 7) indicates than the cluster can be as young as 10 Myr, and the pre-main sequence fitting indicates the presence of objects older than 5.0 Myr. For VVV CL062, the P-DMF is reproduced well by the Kroupa IMF. Integrating this function between 0.1 and 15 , we estimate a cluster total mass of .
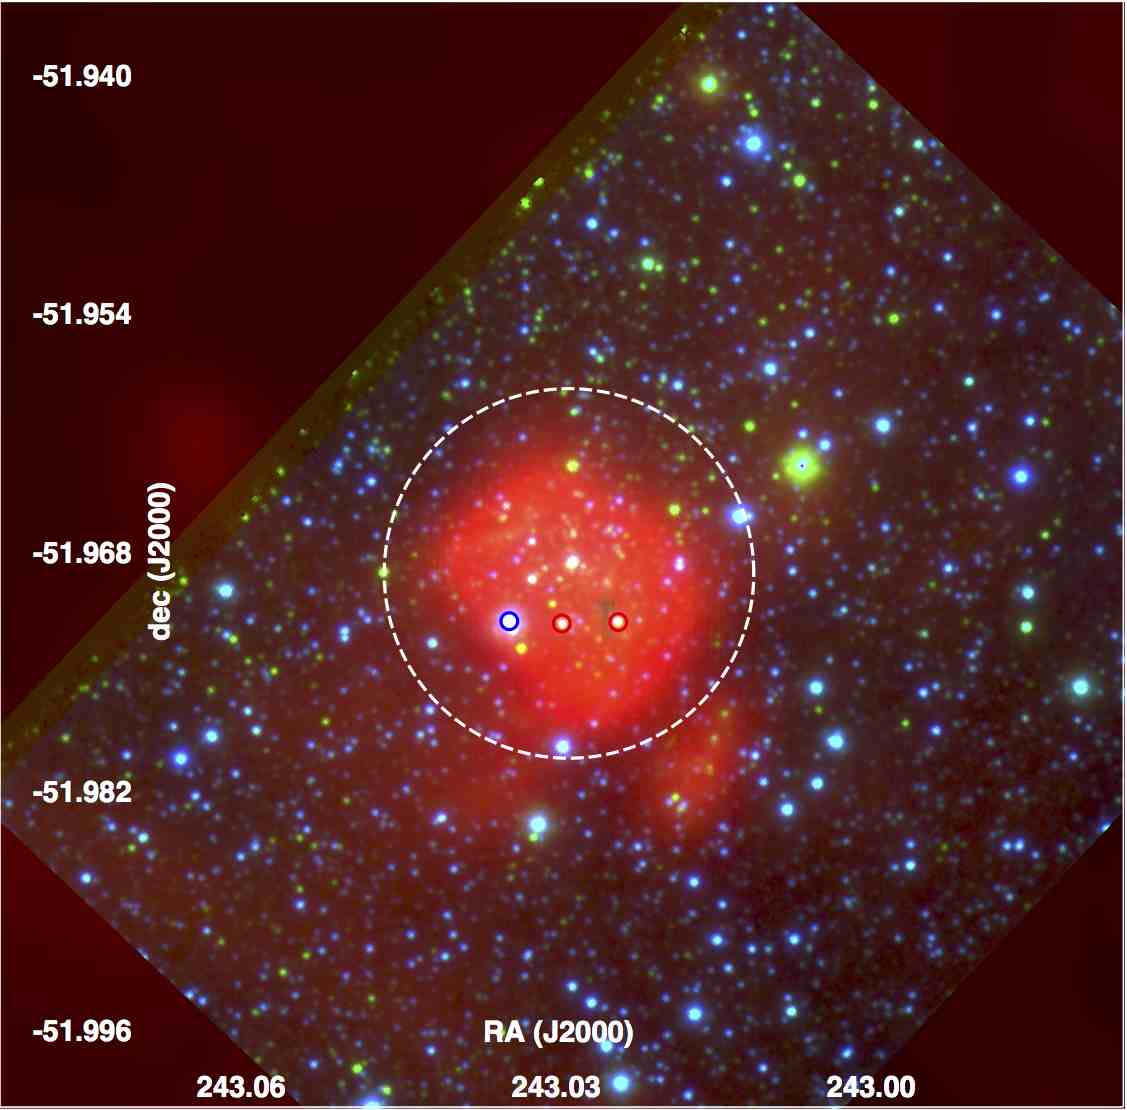
Figure 6: False colour (=blue, =green, WISE W3=red) image for VVV CL062. A central white circle indicates the position and extension of the cluster candidate. Blue and red small circles show the spectroscopically observed stars. North is up, east is left 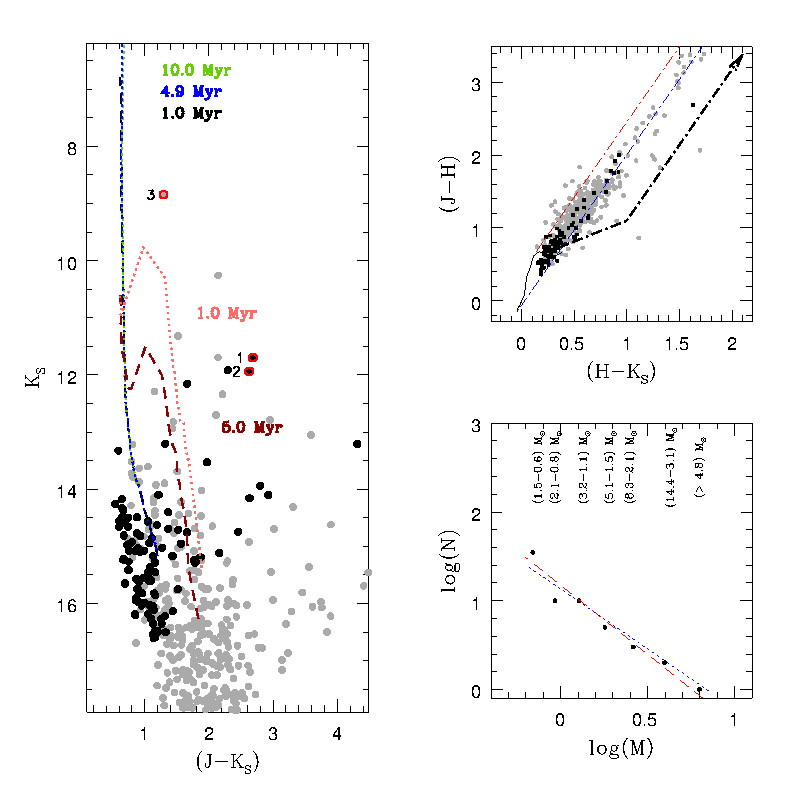
Figure 7: Left: VVV CL062 field-star decontaminated CMD. Main (1.0, 4.9, and 10.0 Myr, Lejeune & Schaerer 2001) and pre-main sequence (1.0, and 5.0 Myr, Siess et al. 2000) isochrones are shown in the diagram. For the CMD and CCD, we use the same colour code as in Figure 3 Right, top: VVV CL062 field-decontaminated CCD. Right, bottom: VVV CL062 P-DMF. The points show the central position in the mass ranges indicated above them, and the lines correspond to the best fit (red, segmented) and the Kroupa IMF fitted (blue, dotted) to the data. -
•
VVV CL088: For this cluster we spectroscopically observed two stars, both very red and bright objects in the CMD (Fig. 9). Star number 01 spectrum presents both H I (4-7) and H I (4-8) in emission. The He I at 2.06 line is in emission and He I at 2.06 line is observed in absorption. The absence of the He II and the depth and shape of the He I absorption line fit with an O9-B0 V spectral type. The spectrum number 02 is very noise-dominated, and its H I (4-7) and He II lines (both below the noise level) fit an O9 V spectrum (e.g. HD 193322).
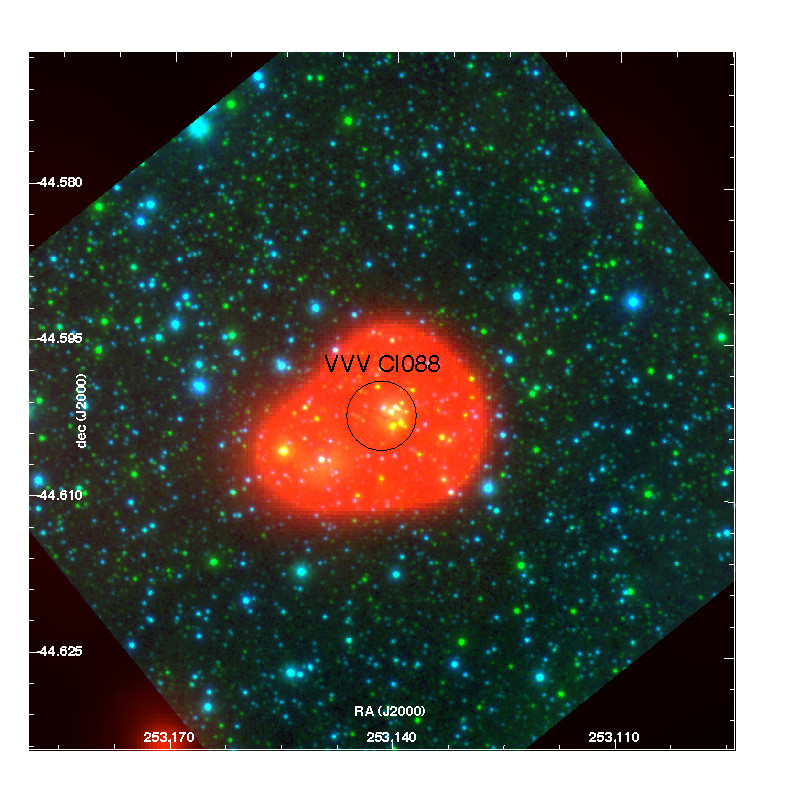
Figure 8: False colour (=blue, =green, WISE W3=red) image for VVV CL088. Central black circle marks the first position and extension estimated for the cluster by Borissova et al. (2011). North is up, east is left Using the individual distance estimates, we obtain a cluster distance estimate of 2.86 kpc. The apparent extension of the cluster, based on the image, is underestimated. Using the WISE mid-infrared images (W3 band), we find that the cluster extends to at least twice the size deduced from the image (see Figure 8). Considering a new radius of 0.7′(the previous estimate by Borissova et al. 2011 was 12″), we built the CMD shown in Figure 9. The integration of the cluster P-DMF obtained from this CMD, between 0.1 and 10 , gives a cluster total mass of .
Fitting the isochrone to the CMD gives an estimate of the cluster reddening of mag. We are not able to determine the age via isochrone fitting, but the O8 V cluster population member sets an upper limit of 7.5 Myr (Meynet & Maeder, 2000).
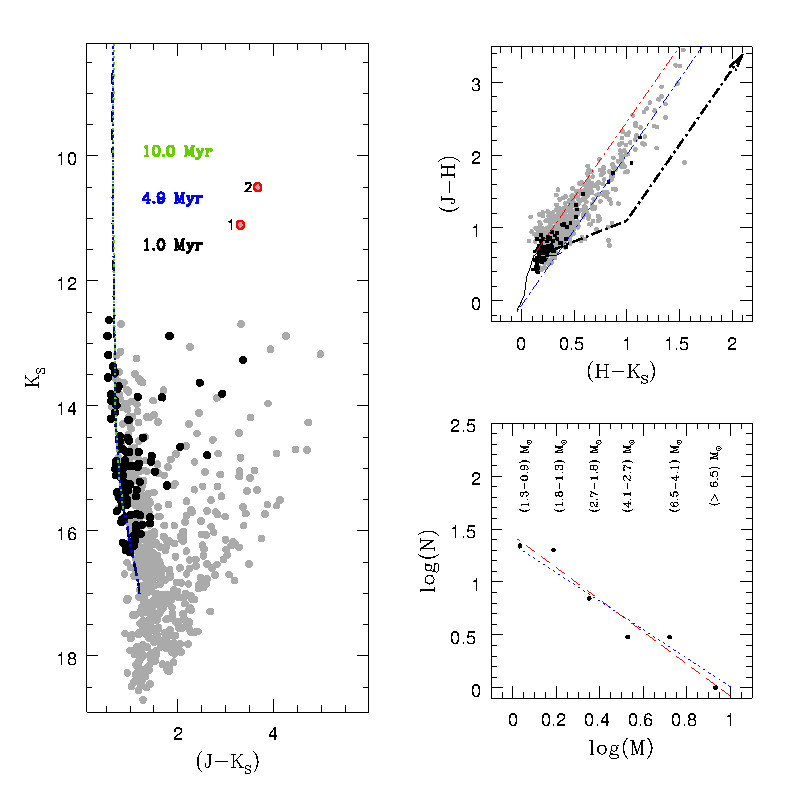
Figure 9: VVV CL088 field-star decontaminated CMD with main sequence (1.0, 4.9, and 10.0 Myr, Lejeune & Schaerer 2001) isochrones (Left), and CCD (Right, top). For the CMD and CCD, we use the same colour code as in Figure 3. Right, bottom: VVV CL088 P-DMF. The points show the central position in the mass ranges indicated above them, and the lines correspond to the best fit (red, segmented) and the Kroupa IMF fitted (blue, dotted) to the data. -
•
VVV CL089: The spectrum number 01 shows He I at 2.11 , H I (4-7), and He II in absorption. These lines fit the O9 V HD 193322, and HD 214680 spectra. For this object, we adopted the O9 V spectral type. Objects number 02, 03, and 04 present a strong 12CO (2,0) band in absorption, which fit the K2-5 III spectra (for example, HR 6299 and HR 1457). The individual distance estimate of star number 01 was adopted as the cluster distance estimate (1.51 kpc).
We integrated the Kroupa IMF between 0.1 and 13 , estimating a cluster total mass of . The main sequence isochrone fitting to the CMD gives a cluster reddening of mag. The cluster CMD does not clearly show a pre-main sequence population, making an age estimation by PMS fitting unreliable. We adopted the upper limit of 9.0 Myr as the cluster age, which was set by the earliest star detected as part of the cluster stellar population (i.e., O9 V).
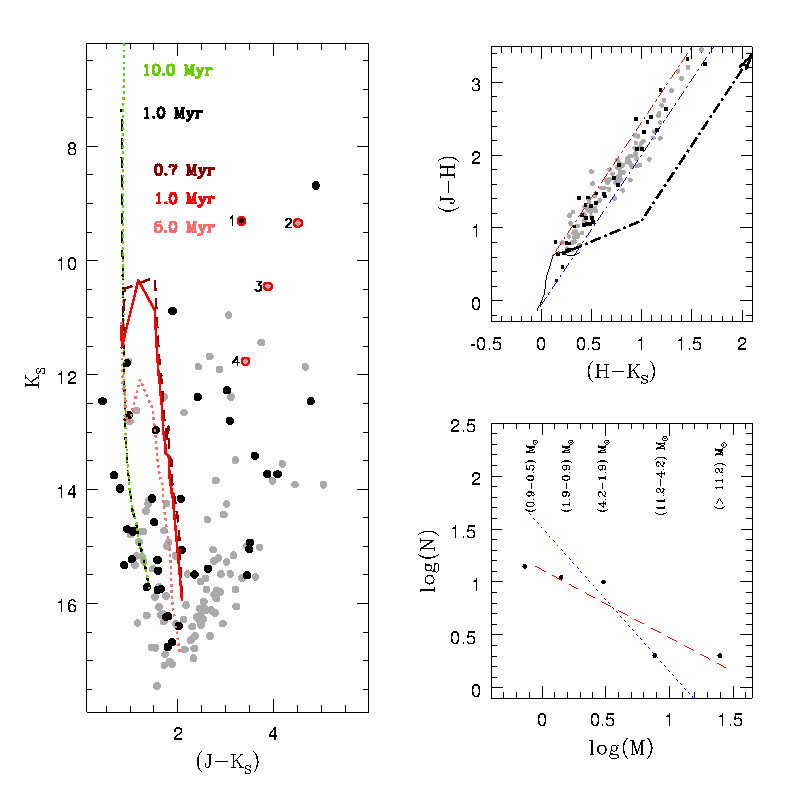
Figure 10: VVV CL089 field-star decontaminated CMD (Left) and CCD (Right, top). For the CMD and CCD we use the same colour code as in Figure 3. Right, bottom: VVV CL089 P-DMF. The points show the central position in the mass ranges indicated above them, and the line corresponds to the best fit (red, segmented) to the data.
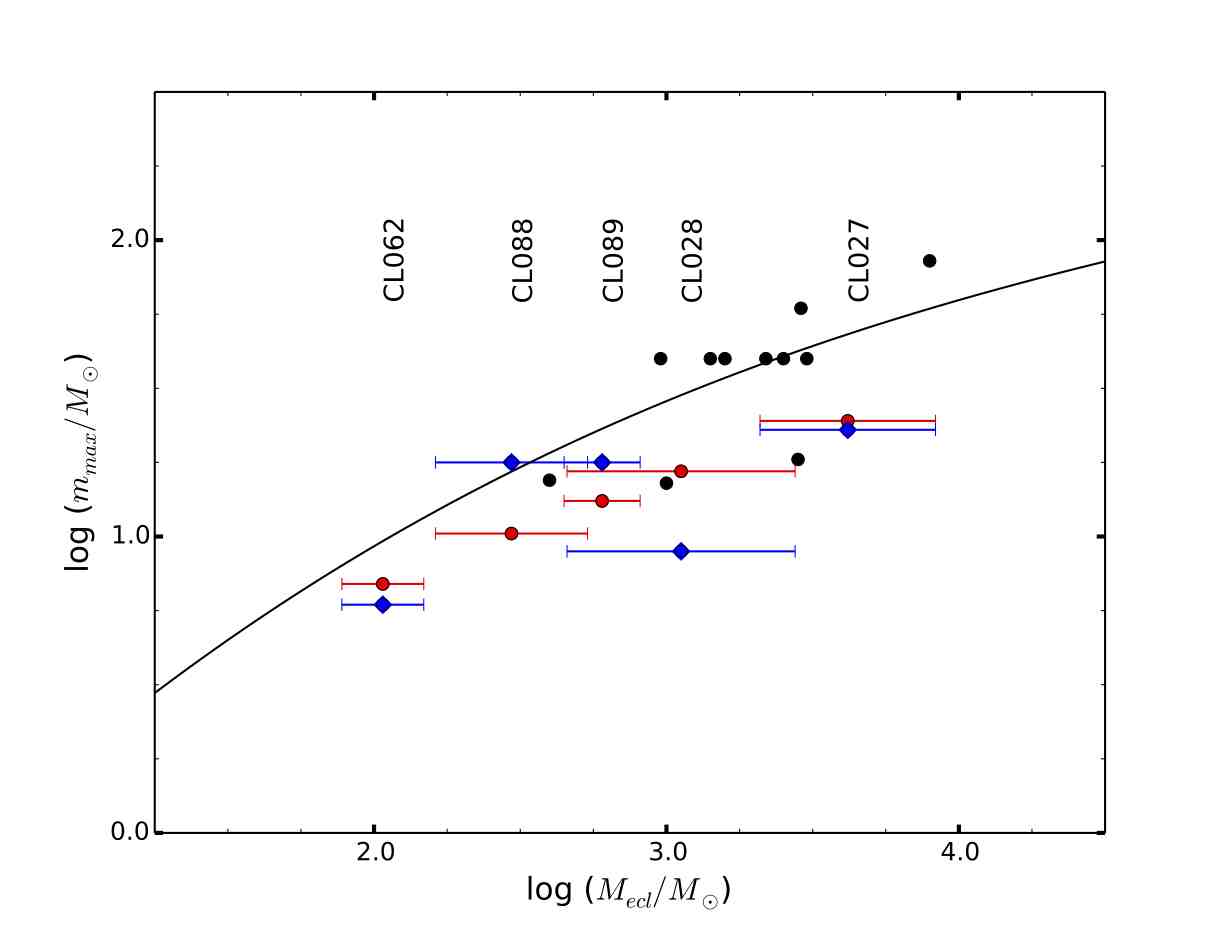
3.2 Cluster total mass vs. most massive star relation
The relation between the total mass of the cluster and the mass of its most massive star was presented analytically by Weidner et al. (2013) (and references therein). This relation implies that the IMF upper mass limit for a determined cluster changes systematically with the stellar mass of the cluster. This relation was observationally sampled by Weidner et al. (2010), using data from very young (less than 5 Myr) open clusters from the literature. Using our homogeneous sample of physically characterized clusters, we checked the (-) relation, shown in Figure 11.
From the clusters CMD we understand that our spectroscopically observed stars represent the most massive star adequately in each cluster. There are no brighter stars with similar colours in the cluster’s CMD. In those cases where we can find a brighter cluster probable member, its photometric features are similar to the spectroscopically observed stars. For a first sample, we selected this set of stars as the sample (blue rhombi in Fig. 11). The largest discrepancy for this sample is seen for VVV CL028, the oldest cluster in our sample (20 Myr). For this cluster, the mass loss of the earliest stellar members caused by stellar or dynamic evolution can explain the discrepancy. The second sample of was derived from the upper limit of the cluster P-DMF, determined from the best fit function (red circles, Fig. 11). We observe a clear trend in this second sample of parameters, which is similar to the one described by the Weidner et al. (2013) relation.
Our data always present lower or higher than expected by the analytical relation. The first scenario can be explained with the uncertainty in the spectral type determination or discrepancy in the mass associated to the spectral type. The second scenario is more difficult to explain, because our cluster total mass estimate is a lower limit for the cluster mass. Stellar evolution, dynamics, or photometric completeness are factors that yield a lower cluster mass than expected. Considering this difference, our sample agrees within the errors the analytical relation by Weidner et al. (2013), supporting an optimal sampling scenario.
4 Conclusions
We have presented the physical characterization of five clusters from the Borissova et al. (2011) catalogue: VVV CL027, VVV CL028, VVV CL062, VVV CL088, and VVV CL089. The clusters contain a spectroscopically observed OB-type population, supported by the statistically field-star decontaminated CMD. Using the information from the CMD plus the cluster distance estimates derived from the individual spectroscopic parallax, we derived the cluster P-DMF and the cluster total mass. These values range from (VVV CL062) to (VVV CL027).
The clusters are very young (1–20 Myr), and most of them present a near-infrared nebulae clearly detected in the VVV- images. Visual inspection of WISE mid-infrared images reveals a very compact structure and a larger extension than the ones previously estimated in two clusters (VVV CL062 and VVV CL088). The presence of a nebulosity at near and mid-infrared wavelengths supports the estimated low age for the clusters.
Finally, we compared the ( versus ) relation (Weidner et al., 2010, 2013) with our total cluster mass estimates and the most massive cluster member mass value. We found agreement between the analytical relation and our data set. The shift between our sample and the ( versus ) analytical relation is expected because of the age of our clusters. A comparison with a larger data set, which includes all the mass estimates reported in this paper series, is also presented.
Acknowledgements.
S.R.A. was supported by the FONDECYT project number 3140605. The VVV Survey is supported by ESO, by the BASAL Center for Astrophysics and Associated Technologies PFB-06, by the FONDAP Center for Astrophysics 15010003, and by the Ministry for the Economy, Development, and Tourism’s Programa Inicativa Científica Milenio through grant IC12009, awarded to The Millennium Institute of Astrophysics (MAS). Support for J.B. is provided by Fondecyt Regular No.1120601. P.A. acknowledges the support by ALMA-CONICYT project number 31110002. M.G. acknowledges support from ESO and Government of Chile Joint Committee 2014. R.K. acknowledges partial support from FONDECYT through grant 1130140. J.C.-B. received support from a CONICYT Gemini grant from the Programa de Astronomía del DRI Folio 32130012. This publication makes use of data products from the Two Micron All Sky Survey, which is a joint project of the University of Massachusetts and the Infrared Processing and Analysis Center/California Institute of Technology, funded by the National Aeronautics and Space Administration and the National Science Foundation. The Java applet to combine asymmetric errors is available at http://www.slac.stanford.edu/barlow/java/statistics1.html.References
- Barlow (2004) Barlow, R. 2004, [arXiv:physics/0406120]
- Benjamin et al. (2003) Benjamin, R. A., Churchwell, E., Babler, B. L., et al. 2003, PASP, 115, 953
- Bonatto & Bica (2010) Bonatto, C. & Bica, E. 2010, A&A, 516, A81
- Borissova et al. (2011) Borissova, J., Bonatto, C., Kurtev, R., et al. 2011, A&A, 532, A131
- Borissova et al. (2014) Borissova, J., Chené, A.-N., Ramírez Alegría, S., et al. 2014, A&A, 569, A24
- Chené et al. (2013) Chené, A.-N., Borissova, J., Bonatto, C., et al. 2013, A&A, 549, A98
- Chené et al. (2012) Chené, A.-N., Borissova, J., Clarke, J. R. A., et al. 2012, A&A, 545, A54
- Chené et al. (2015) Chené, A.-N., Ramírez Alegría, S., Borissova, J., et al. 2015, A&A, 584, A31
- Cox (2000) Cox, A. N. 2000, Allen’s Astrophysical Quantities, 4th edition (Springer, New York)
- Dalton et al. (2006) Dalton, G. B., Caldwell, M., Ward, A. K., et al. 2006, in Society of Photo-Optical Instrumentation Engineers (SPIE) Conference Series, Vol. 6269, Society of Photo-Optical Instrumentation Engineers (SPIE) Conference Series
- Emerson et al. (2006) Emerson, J., McPherson, A., & Sutherland, W. 2006, The Messenger, 126, 41
- Hanson et al. (1996) Hanson, M. M., Conti, P. S., & Rieke, M. J. 1996, ApJS, 107, 281
- Hanson et al. (2005) Hanson, M. M., Kudritzki, R., Kenworthy, M. A., Puls, J., & Tokunaga, A. T. 2005, ApJS, 161, 154
- Hanson et al. (2010) Hanson, M. M., Kurtev, R., Borissova, J., et al. 2010, A&A, 516, A35
- Hanson & Popescu (2007) Hanson, M. M. & Popescu, B. 2007, in Bulletin of the American Astronomical Society, Vol. 39, American Astronomical Society Meeting Abstracts, 836
- Kroupa (2001) Kroupa, P. 2001, MNRAS, 322, 231
- Lawrence et al. (2007) Lawrence, A., Warren, S. J., Almaini, O., et al. 2007, MNRAS, 379, 1599
- Lejeune & Schaerer (2001) Lejeune, T. & Schaerer, D. 2001, A&A, 366, 538
- Martins et al. (2010) Martins, F., Pomarès, M., Deharveng, L., Zavagno, A., & Bouret, J. C. 2010, A&A, 510, A32
- Martins et al. (2005) Martins, F., Schaerer, D., & Hillier, D. J. 2005, A&A, 436, 1049
- Mauro et al. (2013) Mauro, F., Moni Bidin, C., Chené, A.-N., et al. 2013, Rev. Mexicana Astron. Astrofis., 49, 189
- Meynet & Maeder (2000) Meynet, G. & Maeder, A. 2000, A&A, 361, 101
- Minniti et al. (2010) Minniti, D., Lucas, P. W., Emerson, J. P., et al. 2010, New Astronomy, 15, 433
- Negueruela et al. (2010) Negueruela, I., González-Fernández, C., Marco, A., Clark, J. S., & Martínez-Núñez, S. 2010, A&A, 513, 74
- Portegies Zwart et al. (2010) Portegies Zwart, S. F., McMillan, S. L. W., & Gieles, M. 2010, ARA&A, 48, 431
- Ramírez Alegría et al. (2014) Ramírez Alegría, S., Borissova, J., Chené, A. N., et al. 2014, A&A, 564, L9
- Saito et al. (2010) Saito, R., Hempel, M., Alonso-García, J., et al. 2010, The Messenger, 141, 24
- Saito et al. (2012) Saito, R. K., Hempel, M., Minniti, D., et al. 2012, A&A, 537, A107
- Siess et al. (2000) Siess, L., Dufour, E., & Forestini, M. 2000, A&A, 358, 593
- Skrutskie et al. (2006) Skrutskie, M. F., Cutri, R. M., Stiening, R., et al. 2006, AJ, 131, 1163
- Solin et al. (2014) Solin, O., Haikala, L., & Ukkonen, E. 2014, A&A, 562, A115
- Stead & Hoare (2009) Stead, J. J. & Hoare, M. G. 2009, MNRAS, 400, 731
- Stetson (1994) Stetson, P. B. 1994, PASP, 106, 250
- Wallace & Hinkle (1997) Wallace, L. & Hinkle, K. 1997, ApJS, 111, 445
- Weidner et al. (2010) Weidner, C., Kroupa, P., & Bonnell, I. A. D. 2010, MNRAS, 401, 275
- Weidner et al. (2013) Weidner, C., Kroupa, P., & Pflamm-Altenburg, J. 2013, MNRAS, 434, 84