The Sands of Time Run Faster Near the End
Abstract
Submerged granular hoppers exhibit an unexpected surge in discharge rate as they empty [Wilson et al. 2014]. With a more sensitive apparatus, we find that this surge depends on hopper diameter and also happens in air — though the effect is smaller and previously unnoticed. We also find that the surge may be turned off by fixing the rate of fluid flow through the granular packing. With no flow control, dye injected on top of the packing gets drawn into the grains, at a rate that increases as the hopper empties. Thus we conclude that the surge is caused by a self-generated pumping of fluid through the packing. We successfully model this effect via a driving pressure set by the exit speed of the grains. This highlights a surprising and unrecognized role that interstitial fluid plays in setting the discharge rate, and likely also in controlling clog formation, for granular hoppers whether in air or under water.
pacs:
47.57.Gc, 47.56.+r, 47.55.KfHourglasses are filled with sand, rather than water, because the discharge rate of the grains is constant. In particular it does not decrease as the filling height of the material in the upper chamber goes down, as it would for water. This feature, and the variation of discharge rate with grain and orifice size, is captured empirically by the “Beverloo equation” Beverloo et al. (1961); Nedderman et al. (1982); however, the fundamental explanation is still under active research Mankoc et al. (2007); Aguirre et al. (2010); Sheldon and Durian (2010); Janda et al. (2012); Rubio-Largo et al. (2015); Dunatunga and Kamrin (2015). The difficulty is that the grains have both solid-like and liquid-like behavior near the orifice. Intuitively, the discharge speed of the grains is set by ephemeral arches and free-fall though a distance equal to the orifice size. Analogous behavior was recently found for submerged granular hoppers, where the Beverloo equation was generalized by using the terminal falling speed Wilson et al. (2014). But a surprising difference is that the rate is not constant unless the filling height is very large: it actually increases as the hopper empties, ever faster near the end Wilson et al. (2014); Oth .
This dramatic “surge” is important to understand because hopper flows are ubiquitous and are rarely in vacuum. It is also important because interstitial fluid affects many granular phenomena, and is a crucial factor in suspensions, fluidization, and sedimentary transport Guazzelli and Morris (2012); Franklin and Shattuck (2016). Furthermore, the mechanisms controlling hopper discharge rate are basic to the issue of clogging and the formation of stable arches Zuriguel (2014); Thomas and Durian (2015). To make progress our experimental approach is two-fold. First, we measure discharge rate versus filling height with a more precise and automated apparatus, not just for submerged grains but also for dry grains in air (Fig. 1a). Under these conditions, the flow of interstitial fluid is set by the granular discharge and can self-adjust as the hopper empties. Second, we measure discharge where the interstitial water flow rate is fixed by pumping at a range of values. We find that the granular discharge rate increases with fluid flow, but is constant in time with no surge. Using these flow-control results as input, we model the surge by combining the hydrodynamic resistance of the grains in the hopper with pressure-control set by the grain exit speed.
Here we use technical quality monodisperse spherical glass beads (Potter Industries A-series). The diameter distributions are nearly Gaussian, with mean and standard devation of either mm or mm (Retsch Technology Camsizer). The material density is , found by sinking grains into water and measuring the volume of displaced water versus the increase in mass. Filtered tap water is used for the submerged cases. Based on standard textbook values for density and viscosity at room temperature, the terminal velocity of the smaller (larger) beads is expected to be Dra , in accord with visual observation.
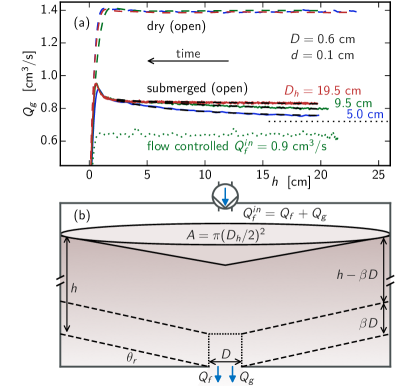
For all experiments we use flat-bottomed cylindrical hoppers with concentric circular orifices (Fig. 1b and sup ). The bottom plate consists of a polycarbonate disc with a 2.5 cm hole and a 5.1 cm depression to accommodate interchangeable aluminum discs 0.6 cm thick, each having an orifice of different diameter . The orifice consists of a cylindrical hole that extends 0.1 cm straight down from the top of the disc and then expands out in a 45 degree bevel cut to the bottom of the disc. The hopper sidewalls consist of interchangeable polycarbonate tubes of desired inner diameter , and 30 cm height, glued to a flange that bolts to the bottom plate. This design makes it possible to vary the orifice diameter and hopper size reproducibly and independently. The top of the hopper is either open, or is sealed off and connected to a gear pump (Cole Palmer 75210-50) to impose a desired volumetric flow rate of water into the hopper with precision .
For all discharge measurements, the hopper hangs from a digital scale (Ohaus Valor 7000) with continuous readout to computer, whether in air or totally submerged in a tall aquarium (see sup ). The raw data is a set of mass-time pairs with 1 g repeatability acquired at 10 Hz. The mass of grains yet to be discharged is computed as , where the density factors account for buoyancy and where is the readout mass of the hopper and grains left inside when the flow stops at the end of the experiment. The height of the grains yet to be discharged is calculated as , where is the density of the packing, determined in an auxiliary experiment where height is obtained from camera images together with mass from the scale. The volume fraction of the packing is thus , consistent with the loose packing results of Ref. Farrell et al. (2010). The volumetric discharge rate of grains is , calculated by -degree polynomial fit over a window defined by Gaussian weighting with width s sup .
Data for discharge rate versus remaining height are plotted in Fig. 1a for the cm orifice and several different conditions: three different hopper diameters with an open top in air, and under water, and one hopper diameter under a fixed input water flow rate. The quality of the data is far better than the pioneering observations, obtained by weighing the grains collected in a cup during a timed interval Wilson et al. (2014). With this improvement we now see that the surge depends on , and that is larger for smaller . We also discover a small surge for grains in air, for which we are aware of no precedents. In accord with Beverloo, appears constant and independent of until just before this terminal surge. The third new feature in Fig. 1a is that under fixed fluid flow-control conditions, the granular discharge rate is constant; in particular, the surge effect is totally eliminated. This indicates that the surge may be caused by interstitial fluid flow at a rate that increases as the hopper empties.
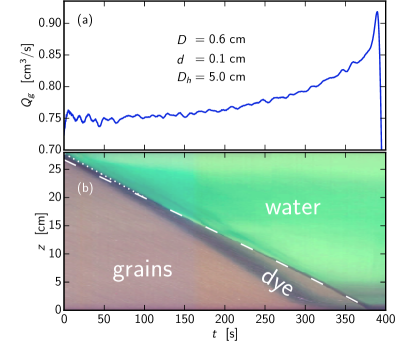
To test this hypothesis qualitatively, we inject a layer a dye into the water just above the packing prior to the start of a surge experiment. Fig. 2a shows discharge rate versus time, and underneath is a spacetime plot constructed from a simultaneous digital video recording sup . In it the grains appear brown, the dyed layer of water appears dark green, and the water above the packing appears light green due to small amounts of mixed dye. The top edge of the packing is coincident with a dashed white curve constructed from . With time, the discharge rate is seen to increase while the packing height decreases. The dyed layer is seen to be above the packing at time zero, and to move down into the packing as time progresses. And it moves faster in tandem with the increase in discharge rate. Evidently, the act of granular discharge effectively creates a pumping effect whereby water flows down through the packing at a speed faster than the grains themselves. One might have guessed that the interstitial fluid would flow passively downward at the same speed as the grains, or perhaps slower, but in fact it moves faster. This contrasts with prior work with sealed containers like an hourglass Ducker et al. (1985); Wu et al. (1993); Veje and Dimon (2001); Bertho et al. (2002); Muite et al. (2004); Hilton and Cleary (2011), where there is a backflow of air that volumetrically matches the downflow of grains. Most recently, Ref. Hilton and Cleary (2011) states that a common modeling approach for air backflow is an “ad-hoc modification” of the Beverloo equation to include a pressure gradient opposing gravity.
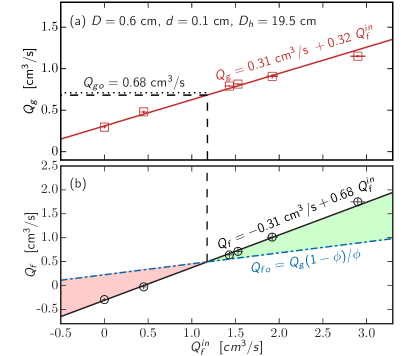
To quantify the coupling between fluid and grains, we now perform a series of flow-control measurements for how the grain discharge rate increases with fluid input pump rate . Results are obtained from averaging over a time series (e.g. Fig. 1a) and are plotted in Fig. 3a. These are well-described by a linear relation . This fit and the error estimates use weights based on uncertainty in pump rate as well as a 1% uncertainty in . By volume conservation, the rate at which fluid is pumped into the top of the hopper must equal the sum of rates at which grains and fluid leave the orifice. Results for may thus be recast in terms of the fluid outflow rate , which, as shown in Fig. 3b, is also necessarily linear in .
To explain both the flow-control and the surge experiments, we begin by considering the excess or deficit of fluid flow with respect to the rate at which it flows passively with – i.e. at the same speed as – the grains in the hopper. The simplest model is to assume a linear perturbation
| (1) |
where is the “reference” grain discharge rate, when the fluid flow is passive, and is a dimensionless proportionality constant. By volume conservation, the passive fluid flow rate is given in terms of the grain discharge rate as . The excess/deficit of fluid flow is indicated by the green/red shaded regions in Fig. 3b between the plotted lines for these two expressions. Their intersection graphically locates the passive reference state. Inserting into Eq. (1) and rearranging gives a linear relation between the grain discharge rate and the rate at which fluid is pumped in:
| (2) |
Comparing with the line fit in Fig. 3a gives the two unknowns as and , where the uncertainties reflects those in both the Fig. 3a fit and in . The grain and orifice diameters are the same as in Fig. 1a, where the discharge rates are all higher than this result for , as expected. This same analysis of flow-control measurements is repeated for other grain and orifice sizes. Similar to Ref. Wilson et al. (2014), results in sup show that the reference discharge rate obeys a modified Beverloo equation, where and , and that the parameter increases as .
Next we model the surge effect using Eq. (1) by considering the excess flow of fluid through a porous granular medium of hydrodynamic resistance that is generated by a driving pressure . Since the excess fluid enters across the whole hopper area but exits through a much smaller orifice, the flow field is complex. To simplify, we approximate the medium as two cylinders in series: the first has area and height , while the second has area and height , where is a dimensionless parameter that sets the height of the exit region where the permeation flow constricts and the grains dilate (see schematics in Fig. 1b and sup ). The total hydrodynamic resistance is then
| (3) |
where (Kozeny-Carman equation for Beavers et al. (1973); Dullien (1992); Torquato (2001)) and where is an additional dimensionless parameter to account for the complex shape of the flow field and the increased permeability in the exit region. These ingredients combine to predict the discharge rate versus the height of grains yet to exit as a sum of reference plus surge terms:
| (4) | |||||
| (5) |
Eqs. (4-5) define and as convenient fitting parameters, and give their relation to , , and as the underlying unknowns. Eq. (5) also highlights the form of the surge with and hopper area . Namely, the surge vanishes (i.e. ) in the limit , where the hydrodynamic resistance is infinite and the interstitial fluid flows passively with the grains. For smaller and larger , the surge of above increases, just as seen in Fig. 1a, because the hydrodynamic resistance is smaller and the excess fluid flow is faster.
We now fit Eq. (5) to the three surge experiments in Fig. 1a, by adjusting separately for each data set but adjusting one value of and simultaneously for all. The quality of the fits is good, and the values of the fitting parameters make sense: First, the reference flow rate overlaps with the result from the flow-control experiments. Second, the value of translates directly to a driving pressure of . This is on the order of the Bernoulli pressure based on the single-grain terminal falling speed , but is even closer to where is the speed of the stream of discharged grains (see sup ). Physically, the fluid pressure at the outlet is reduced due to some combination of grain dilation and fluid flow beneath the hopper, both of which are driven by gravity and hence might be expected to scale with .
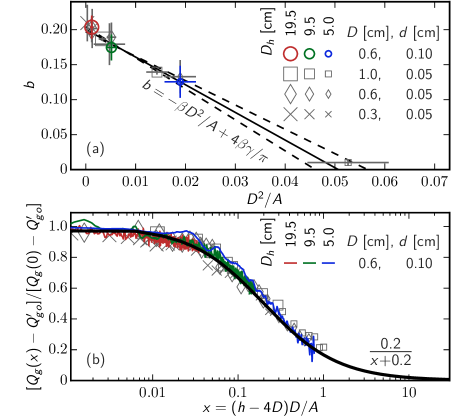
Next we repeat the surge experiments for the smaller beads and three hole and hopper sizes. Fitting values for the parameter are plotted in Fig. 4a versus . As expected from Eqs. (4-5) the results decrease linearly with , and do not depend on grain size. The displayed line fit has slope and intercept ; these combine to give . The height of the region where the permeation flow becomes constricted is thus , as expected. And the value of is smaller than one, also as expected, because the grain density decreases in the exit region and because the true interstitial flow also enters through the side-walls of the imagined cylinder (see sup ).
As a final check we attempt to collapse all twelve surge data sets according to Eq. (4), using only the fitting parameter and the reference discharge rates . In particular, we subtract and divide by the difference between and the rate at . The scaled discharge rates then go between 0 and 1 as the decreases from infinity to . And when plotted versus , the data should all collapse to . As demonstrated in Fig. 4b, the scaled data all collapse beautifully to this form with the intercept found in Fig. 4a. For the surge is thus well-described and understood by the above model of grain-fluid coupling and the two-cylinder picture of the medium.
The two-cylinder picture of the permeation flow ought to fail as decreases toward and below . Nonetheless the fit to Eq. (5) holds well for all as shown in the plots. But for smaller there is an even more dramatic “terminal” surge where the discharge rate increases sharply, nearly independent of hopper diameter, as seen in Fig. 1a. This is the only effect noticeable in Fig. 1a for dry grains in air. To model the terminal surge would require a more sophisticated treatment of the shape of the packing, the permeation flow, and maybe even the motion of the grains. And perhaps the driving pressure could no longer be treated as constant, but would increase in positive feedback with the surging discharge rate. Further studies of the fluid pressure Kulkarni et al. (2010) and flow Hilton and Cleary (2011) fields would also be helpful. In addition, it is possible that the terminal surge is an example of the “faster-is-slower” effect Alonso-Marroquin et al. (2012); Pastor et al. (2015).
In conclusion, with an improved apparatus we have uncovered the full phenomenology for the surge of granular discharge as a hopper empties. We have demonstrated that this surprising effect originates in a permeation flow of interstitial fluid, which is pumped downward through the pack at a speed faster than the grains. And we have quantitatively modeled this flow and its coupling to the granular discharge. This is significant for establishing the baseline reference state, which ought to be the target for understanding the modified Beverloo law for the discharge rate of grains under water Wilson et al. (2014); sup , as a very tall hopper where the interstitial fluid flows passively downwards at the same speed as the grains. This raises a question about the usual Beverloo law for dry grains, where, both historically Beverloo et al. (1961); Nedderman et al. (1982) and more recently Mankoc et al. (2007); Aguirre et al. (2010); Sheldon and Durian (2010); Janda et al. (2012); Rubio-Largo et al. (2015), interstitial air is neglected. The baseline state of passive interstitial fluid flow may be even more important for understanding clogging Zuriguel (2014), where fluid must be squeezed out from between the grains forming a stable arch over the orifice, and where pumped fluid could break marginally stable arches. Further in this regard, we now ask whether the fraction of microstates that precede a clog, as measured from the average discharge mass Thomas and Durian (2015), includes grain momenta degrees of freedom that are affected by the interstitial fluid.
Acknowledgements.
This work was supported by the Finnish Foundation’s Post Doc Pool, Wihuri Foundation and Finnish Cultural Foundation (JK) and by the NSF through Grant No. DMR-1305199 (JK, DJD).References
- Beverloo et al. (1961) W. A. Beverloo, H. A. Leniger, and J. van de Velde, Chem. Eng. Sci. 15, 260 (1961).
- Nedderman et al. (1982) R. M. Nedderman, U. Tuzun, S. B. Savage, and G. T. Houlsby, Chem. Eng. Sci. 37, 1597 (1982).
- Mankoc et al. (2007) C. Mankoc, A. Janda, R. Arévalo, J. M. Pastor, I. Zuriguel, A. Garcimartín, and D. Maza, Granular Matter 9, 407 (2007).
- Aguirre et al. (2010) M. A. Aguirre, J. G. Grande, A. Calvo, L. A. Pugnaloni, and J.-C. Géminard, Phys. Rev. Lett. 104, 238002 (2010).
- Sheldon and Durian (2010) H. G. Sheldon and D. J. Durian, Granular Matter 12, 579 (2010).
- Janda et al. (2012) A. Janda, I. Zuriguel, and D. Maza, Phys. Rev. Lett. 108, 248001 (2012).
- Rubio-Largo et al. (2015) S. M. Rubio-Largo, A. Janda, D. Maza, I. Zuriguel, and R. C. Hidalgo, Phys. Rev. Lett. 114, 238002 (2015).
- Dunatunga and Kamrin (2015) S. Dunatunga and K. Kamrin, J. Fluid Mech. 779, 483 (2015).
- Wilson et al. (2014) T. J. Wilson, C. R. Pfeifer, N. Mesyngier, and D. J. Durian, Papers in Physics 6, 060009 (2014).
- (10) A surge effect has also been observed experimentally by Arshad Kudrolli (private communication) and by Luis Pugnaloni (private communication), and appears to be present in Fig. 5 of Ref. Dunatunga and Kamrin (2015).
- Guazzelli and Morris (2012) E. Guazzelli and J. F. Morris, A Physical Introduction to Suspension Dynamics (Cambridge Univ. Press, NY, 2012).
- Franklin and Shattuck (2016) S. V. Franklin and M. D. Shattuck, Handbook of Granular Materials (CRC Press, NY, 2016).
- Zuriguel (2014) I. Zuriguel, Papers in Physics 6, 060014 (2014).
- Thomas and Durian (2015) C. C. Thomas and D. J. Durian, Phys. Rev. Lett. 114, 178001 (2015).
- (15) F. A. Morrison, “Data Correlation for Drag Coefficient for Sphere” (www.chem.mtu.edu/~fmorriso, accessed June 2012).
- (16) See Supplemental Material at … for photographs of the apparatus, a video illustrating the surge effect, and additional plots.
- Farrell et al. (2010) G. R. Farrell, K. M. Martini, and N. Menon, Soft Matter 6, 2925 (2010).
- Ducker et al. (1985) J. R. Ducker, M. E. Ducker, and R. M. Nedderman, Powder Technology 42, 3 (1985).
- Wu et al. (1993) X.-l. Wu, K. J. Måløy, A. Hansen, M. Ammi, and D. Bideau, Phys. Rev. Lett. 71, 1363 (1993).
- Veje and Dimon (2001) C. Veje and P. Dimon, Granular Matter 3, 151 (2001).
- Bertho et al. (2002) Y. Bertho, F. Giorgiutti-Dauphiné, T. Raafat, E. J. Hinch, H. J. Herrmann, and J.-P. Hulin, J. Fluid Mech. 459, 317 (2002).
- Muite et al. (2004) B. K. Muite, M. L. Hunt, and G. G. Joseph, Physics of Fluids 16, 3415 (2004).
- Hilton and Cleary (2011) J. E. Hilton and P. W. Cleary, Phys. Rev. E 84, 011307 (2011).
- Beavers et al. (1973) G. S. Beavers, E. M. Sparrow, and D. E. Rodenz, J. Appl. Mech. 40, 655 (1973).
- Dullien (1992) F. A. L. Dullien, Porous Media: Fluid Transport and Pore Structure (Academic Press, San Diego, 1992).
- Torquato (2001) S. Torquato, Random Heterogeneous Materials: Microstructure and Macroscopic Properties (Springer, NY, 2001).
- Kulkarni et al. (2010) S. D. Kulkarni, B. Metzger, and J. F. Morris, Phys. Rev. E 82, 010402 (2010).
- Alonso-Marroquin et al. (2012) F. Alonso-Marroquin, S. I. Azeezullah, S. A. Galindo-Torres, and L. M. Olsen-Kettle, Phys. Rev. E 85, 020301 (2012).
- Pastor et al. (2015) J. M. Pastor, A. Garcimartín, P. A. Gago, J. P. Peralta, C. Martín-Gómez, L. M. Ferrer, D. Maza, D. R. Parisi, L. A. Pugnaloni, and I. Zuriguel, Phys. Rev. E 92, 062817 (2015).