ALMA observations of cold molecular gas filaments trailing rising radio bubbles in PKS 0745-191
Abstract
We present ALMA observations of the CO(1-0) and CO(3-2) line emission tracing filaments of cold molecular gas in the central galaxy of the cluster PKS 0745-191. The total molecular gas mass of , assuming a Galactic factor, is divided roughly equally between three filaments each extending radially from the galaxy centre. The emission peak is located in the SE filament () from the nucleus. The velocities of the molecular clouds in the filaments are low, lying within of the galaxy’s systemic velocity. Their FWHMs are less than , which is significantly below the stellar velocity dispersion. Although the molecular mass of each filament is comparable to a rich spiral galaxy, such low velocities show that the filaments are transient and the clouds would disperse on timescales unless supported, likely by the indirect effect of magnetic fields. The velocity structure is inconsistent with a merger origin or gravitational free-fall of cooling gas in this massive central galaxy. If the molecular clouds originated in gas cooling even a few kpc from their current locations their velocities would exceed those observed. Instead, the projection of the N and SE filaments underneath X-ray cavities suggests they formed in the updraft behind bubbles buoyantly rising through the cluster atmosphere. Direct uplift of the dense gas by the radio bubbles appears to require an implausibly high coupling efficiency. The filaments are coincident with low temperature X-ray gas, bright optical line emission and dust lanes indicating that the molecular gas could have formed from lifted warmer gas that cooled in situ.
keywords:
galaxies:active — galaxies: clusters: PKS 0745-191 — galaxies:evolution — cooling flows1 Introduction
The cores of rich galaxy clusters host the brightest and most massive galaxies known. These brightest cluster galaxies (BCGs) are giant ellipticals with extended, diffuse stellar envelopes and predominantly old, ‘red and dead’ stellar populations. However, not all BCGs are passively evolving at late times. Those residing beneath cooling hot atmospheres commonly feature luminous, filamentary emission line nebulae, cold molecular gas reservoirs with masses above to a few and star formation rates at several to tens of solar masses per year (Heckman 1981; Hu, Cowie & Wang 1985; Johnstone, Fabian & Nulsen 1987; McNamara & O’Connell 1992; Jaffe & Bremer 1997; Edge 2001; Salomé & Combes 2003). Cool core galaxy clusters have hot X-ray atmospheres with short central radiative cooling times, which can drop below a Gyr. An unimpeded flow of gas cooling from the cluster atmosphere would be expected to supply at least an order of magnitude more cold gas and star formation than is observed in BCGs in cool core clusters (Fabian 1994; Peterson & Fabian 2006). Instead, high resolution X-ray images from Chandra show that powerful radio jets, launched by the central radio AGN, are inflating large, buoyant radio bubbles and generating shocks, sound waves and turbulence which heat the cluster atmosphere and suppress gas cooling (eg. McNamara & Nulsen 2007, 2012; Fabian 2012). The energy input by the AGN is sufficient to replace the X-ray radiative losses for large samples of groups and clusters and appears to be closely coupled to the cooling rate in a feedback loop (Bîrzan et al. 2004; Dunn & Fabian 2006; Rafferty et al. 2006). This mechanism is likely operating to suppress gas cooling and star formation in all massive elliptical galaxies at late times (Bower et al. 2006; Croton et al. 2006; Best et al. 2007).
This radio-mode (mechanical) feedback prevents the bulk of the volume-filling hot atmospheres in galaxies and clusters from cooling to low temperatures, but whether it can also regulate the supply of dense, cold molecular gas is not known. Cold gas and recent star formation in BCGs are likely fuelled by gas cooling from the cluster atmosphere, albeit at rates well below the expectations of cooling flows. Correlations between the X-ray cooling rate and star formation rates (Egami et al. 2006; O’Dea et al. 2008) and the detection of star formation and luminous emission line nebulae predominantly in systems with central cooling times below a sharp threshold at support this picture (Rafferty, McNamara & Nulsen 2008; Cavagnolo et al. 2008). Accretion of this cold gas is likely a key element of feedback linking the gas cooling rate to the fuelling of the SMBH and the energy output of the AGN (eg. Pizzolato & Soker 2005; Gaspari, Brighenti & Temi 2015). Radio-jet driven outflows of ionized and molecular gas have been detected in nearby radio galaxies suggesting that jets can couple to dense gas clouds (Morganti, Tadhunter & Oosterloo 2005; Nesvadba et al. 2006; Alatalo et al. 2011; Dasyra & Combes 2011; Morganti et al. 2015). In NGC 1275 at the centre of the Perseus cluster, the velocity structure of extended H filaments, which are coincident with single dish detections of molecular gas, is consistent with uplift under the buoyantly rising radio bubbles (Hatch et al. 2006; Salomé et al. 2006, 2011). Inflowing molecular gas filaments are also observed closer to the galaxy centre (Lim, Ao & Dinh-V-Trung 2008). ALMA Early Science observations of Abell 1835 showed a much more substantial uplift with of molecular gas in a high velocity flow underneath the buoyant radio bubbles (McNamara et al. 2014).
Here we present ALMA Cycle 1 observations of the molecular gas in the PKS 0745-191 BCG, which with has undergone an even more powerful radio jet outburst than Abell 1835 (Rafferty et al. 2006; Sanders et al. 2014). Single dish observations of PKS 0745-191 detected the BCG at CO(1-0) and CO(2-1) and found a total molecular gas mass of (Salomé & Combes 2003). Optical, UV and IR observations show significant star formation at a rate of and a luminous emission line nebula with clumpy filaments extending in the BCG (Fabian et al. 1985; Johnstone, Fabian & Nulsen 1987; Donahue et al. 2000; Hicks & Mushotzky 2005; Tremblay et al. 2015). The surrounding rich cluster has a short central cooling time and X-ray spectra are consistent with several hundred solar masses per year cooling down below X-ray temperatures. The coolest X-ray gas is offset by () to the W of the hard X-ray and radio point source emission from the low luminosity AGN, which may be due to sloshing of the hot gas in the cluster potential (Sanders et al. 2014). The ALMA observations now resolve the spatial and velocity structure of the cold molecular gas structures at the centre of the BCG revealing extended filaments trailing the two buoyant radio bubbles.
For a standard CDM cosmology with , at the central galaxy’s redshift (; Hunstead, Murdoch & Shobbrook 1978) 1 arcsec corresponds to . The BCG redshift was determined from optical emission lines, including H, H and [O iii], which likely originate from the ionized surfaces of the molecular gas clouds making up the extended cool gas nebula (eg. Jaffe, Bremer & Baker 2005; Hatch et al. 2006; Oonk et al. 2010; Salomé et al. 2011). Bulk motion of the emission line nebula could therefore produce a systematic offset in the gas velocities with respect to the gravitational potential of the BCG. In the absence of stellar absorption line measurements directly tracing the BCG potential, we note that our conclusions on the velocity structure of the molecular gas depend on the redshift from the emission line gas.
2 Data reduction

| CO | Region | /dof | Integrated intensity | Peak | FWHM | Velocity shift | Mass111The molecular gas mass was calculated from the CO(1-0) integrated intensity as described in section 3.5. | ||
|---|---|---|---|---|---|---|---|---|---|
| line | (GHz) | (GHz) | (Jy km/s) | (mJy) | (km/s) | (km/s) | () | ||
| J=1-0 | 115.27 | 104.53 | Total | 1079/1061 | |||||
| SE | 1072/1058 | ||||||||
| N | 1077/1058 | ||||||||
| SW | 1070/1061 | ||||||||
| J=3-2 | 345.80 | 313.56 | Total | 350/357 | |||||
| Nuc. | 332/354 | ||||||||
| SW1 | 374/357 | ||||||||
| SW2 | 340/354 | ||||||||
| SE1 | 371/357 | ||||||||
| SE2 | 351/354 | ||||||||
| N1 | 401/357 | ||||||||
| N2 | 372/354 | ||||||||
| N3 | 382/354 | ||||||||
| N4 | 371/357 | ||||||||
| N5 | 346/357 |
The BCG at the centre of PKS 0745-191 was observed by ALMA in Cycle 1 with single pointings to cover the CO(1-0) line at in band 3 and the CO(3-2) line at in band 7 (ID = 2012.1.00837.S; PI McNamara). The observations were centred on the nucleus of PKS 0745-191 (RA 07:47:31.32, Dec -19:17:39.97, J2000) and the HPBW of the primary beam was in band 3 and in band 7. The data were taken in two 8 minute observations in band 3 on 2014 April 26 and 27 and in a 25 minute observation in band 7 on 2014 August 19. The observations utilised antennas with baselines of at CO(1-0) and a more extended configuration with baselines of at CO(3-2). The frequency division correlator mode was used with a bandwidth and frequency resolution of () but channels were binned together to improve the signal-to-noise ratio. An additional baseband was positioned to image the continuum in each observation.
The observations were calibrated in casa version 4.2.2 (McMullin et al. 2007) using the ALMA pipeline reduction scripts and additional self-calibration significantly improved the image quality. The continuum-subtracted images were reconstructed using clean and various Briggs weightings were explored to determine the optimum for imaging in each band. A robustness parameter of 0.5 was used for the CO(1-0) cube and a value of 2 was used to maximise the signal-to-noise in the CO(3-2) cube. This provided a synthesized beam of with a position angle (P.A.) of at CO(1-0) and with a P.A. of at CO(3-2). The rms noise in the line-free channels was at CO(1-0) and at CO(3-2) for channels. Images of the continuum emission were also produced by averaging channels free of any line emission. An unresolved central continuum source is detected in both bands with flux at and at . The position of the mm-continuum source coincides with the unresolved radio nucleus detected at with the ATCA in 6A configuration (Hogan et al. 2015). The mm-continuum flux is also consistent with the upper limit on synchrotron emission from a flat spectrum radio core222For the convention with (Hogan et al. 2015) and this is likely to be the location of the low-luminosity AGN.
3 Results
3.1 Gas distribution in the central galaxy
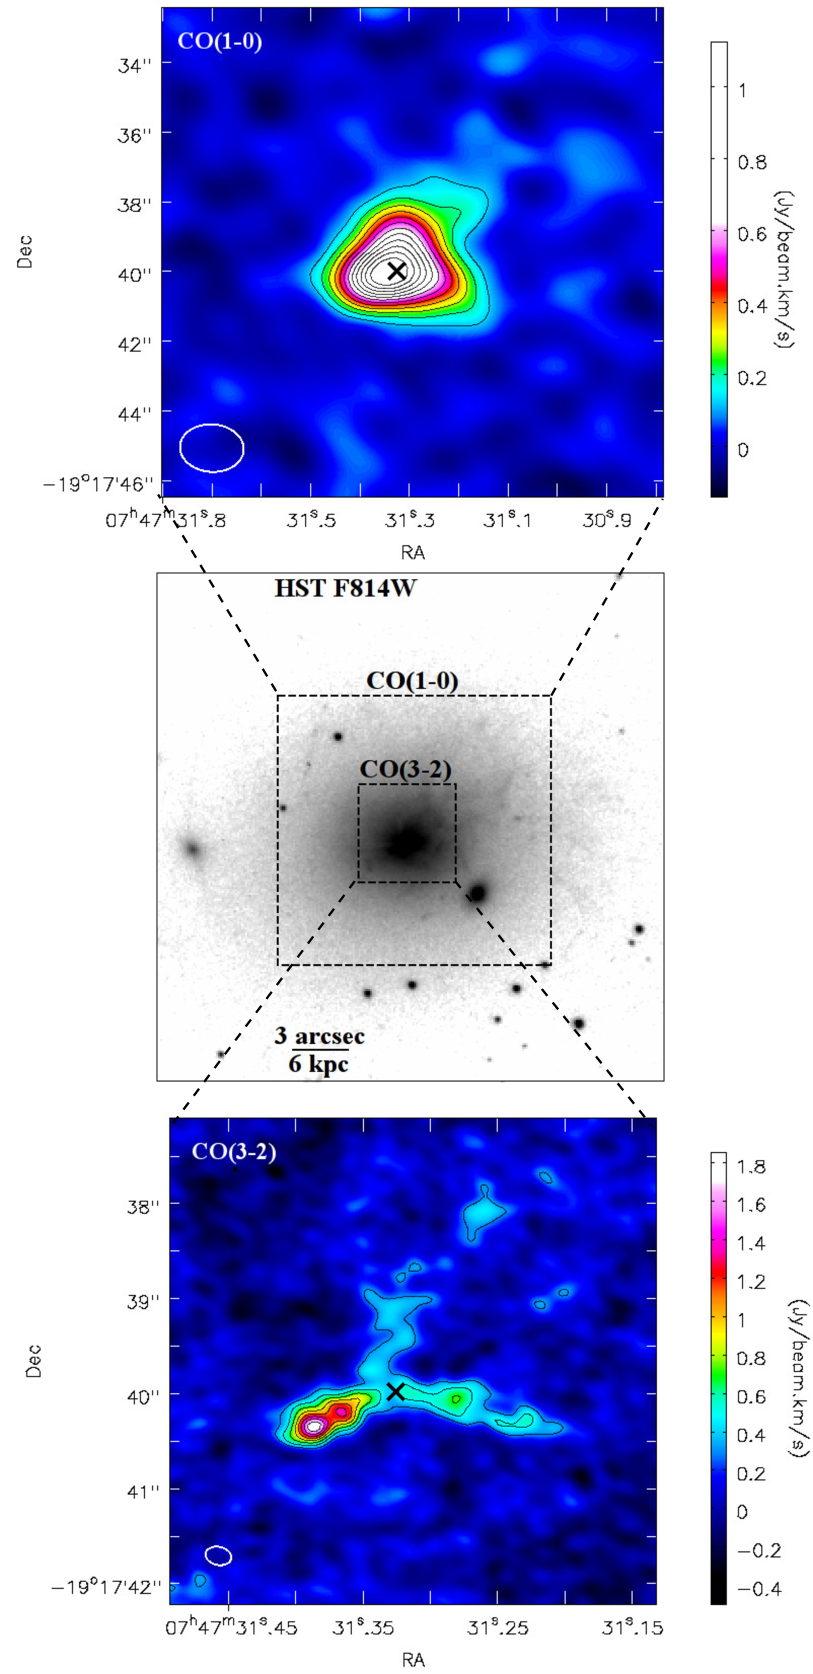
The CO(1-0) and CO(3-2) rotational transition lines were both detected and imaged at the centre of the BCG in PKS 0745-191. The continuum-subtracted total spectral line profiles were extracted from a region for CO(1-0) and a region for CO(3-2) and are shown in Fig. 1. Larger regions produce consistent total fluxes but significantly noisier spectra. Each spectrum was fitted with a single Gaussian component using the package mpfit (Markwardt 2009) and the best fit results, corrected for primary beam response and instrumental broadening, are shown in Table 1. The CO(1-0) and CO(3-2) total spectra are consistent with single velocity components blueshifted to to and have a comparable FWHM of . The total CO(1-0) integrated intensity of is roughly consistent with the IRAM single dish signal of (Salomé & Combes 2003) given the significant uncertainties in the continuum baseline subtraction for the earlier detection. This shows that little extended emission has been filtered out by the interferometer at CO(1-0).
Integrated intensity maps of the CO(1-0) and CO(3-2) emission are shown in Fig. 2. The CO(1-0) line emission extends over () with roughly a third of the emission lying within an unresolved central peak that is marginally offset to the SE of the nuclear continuum emission. The CO(1-0) emission extends to the N, SE and SW of the nucleus with a similar morphology to the brightest regions of H, Pa and ro-vibrational H2 (Donahue et al. 2000; Wilman, Edge & Swinbank 2009). The CO(3-2) line emission resolves this extended structure into three filaments each () in length. The SE, SW and N filaments contain roughly , and of the total line flux in CO(3-2), respectively. The N filament extends furthest and appears to bend along its length and may be fragmenting at large radius. The peak in the CO(3-2) emission lies to the SE of the nuclear continuum emission. Emission from the SW filament appears to extend across the nucleus and this structure may also include the base of the N filament. However, several structures are likely superimposed at this junction between the three filaments. The molecular gas is clearly not centred on the nucleus and it is difficult to constrain the physical location of the structure along the line of sight.
3.2 Line ratio
The CO(3-2)/CO(1-0) line ratio was calculated for each of the three filaments and a region centred on the nucleus. The CO(3-2) dataset was convolved with a 2D Gaussian to match the CO(1-0) synthesized beam and the integrated intensities (in ) were determined from spectral fitting to each dataset using matching CO(1-0) beam-sized regions. The line ratios for the BCG centre, N and SE filaments were consistent within the error with CO(3-2)/CO(1-0), and , respectively. The line ratio measured for the SW filament was significantly lower at CO(3-2)/CO(1-0). The FWHM measured in each of the four regions is consistent within the errors for both the CO(1-0) and the matched resolution CO(3-2) observation. Assuming that the CO emission is optically thick and the gas is thermalized, the line ratios indicate an excitation temperature of . The gas is therefore highly excited and dense. The lower line ratio for the SW filament is likely due to a lower average molecular density in this region and more diffuse gas.
3.3 Velocity structure
We mapped the velocity structure of the molecular gas by extracting spectra for synthesized beam-sized regions centred on each spatial pixel in the cube. These spectra were fitted with one or two Gaussian components using mpfit and we required at least significance for the detection of a line determined using Monte Carlo simulations. As discussed in section 1, the BCG’s systemic velocity has been determined from optical emission line spectra and may therefore be affected by the bulk motion of the emission line gas with respect to the BCG potential. However, the radial distribution of the filaments in PKS 0745-191 appears very different from the one-sided bulk offsets of the emission line gas from the BCG centre in systems undergoing mergers or gas sloshing (Hamer et al. 2012). We therefore do not expect a large velocity offset between the gas structures and the stellar potential.
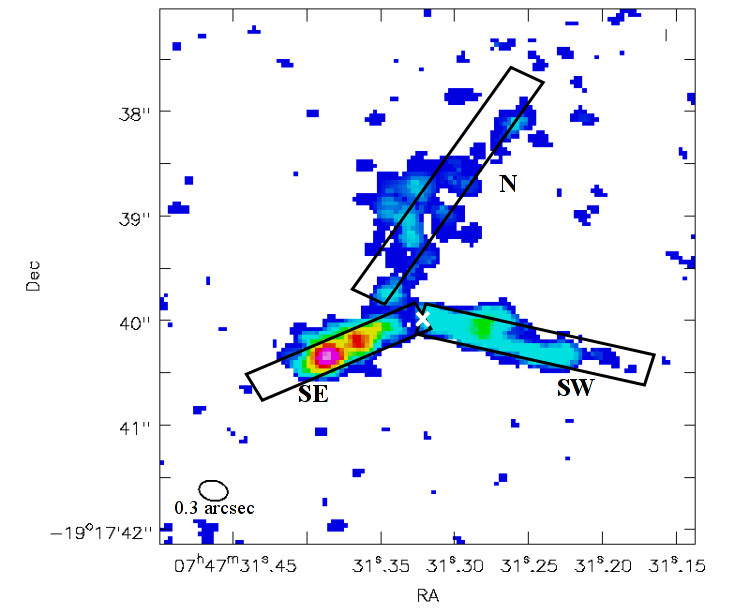
Fig. 3 and Fig. 4 show the line centre and FWHM for each of the detected velocity components at CO(1-0) and CO(3-2), respectively. The gas velocities lie within of the systemic velocity. Furthermore the FWHM lies below across most of the extended structure. At CO(1-0), the gas velocity centre ranges from north of the nucleus to in the SE and in the SW. Additional velocity components are detected to the N and SE of the nucleus. These additional velocity components appear narrower than the main component with FWHM of and to the N and SE respectively. Fig. 5 shows regions selected to cover these detections of multiple velocity components and Figs. 6 and 7 show the spectra extracted from these regions and the best-fit models. Fig. 6 shows the best-fit models for the multiple velocity components detected in the N and SE regions and for the SW region where a second component is not significantly detected. The second velocity component is redshifted to to the N and blueshifted to to the SE. In each case, the flux of the additional component is roughly of the primary velocity component.


The velocity structure at CO(3-2) is clearly resolved into three main filaments but appears broadly similar to the CO(1-0) structure. The N filament contains predominantly blueshifted gas with velocity centres from to and this decreases to and in the SE and SW filaments respectively. The FWHM is less than along the N and SW filaments except for a region of redshifted emission to the NW where the FWHM increases to . The N filament appears to bend to the NW at its furthest extent and may be breaking up in this region. Additional velocity components are clearly detected in the N and SE filaments, roughly coincident with the additional velocity components detected at CO(1-0). This second component has a velocity centre of to in the N filament and in the SE filament. The FWHM is greatest at for the majority of the gas in the SE filament. The additional velocity components appear broader at CO(3-2) with FWHM of in the N filament and in the SE filament. At CO(3-2), a second velocity component is also detected at a radius of () along the SW filament and a broad component with FWHM of is coincident with the nucleus (Figs. 4 and 7). The fraction of the flux in the second velocity component compared to the total emission in each filament is , which is similar to the fraction at CO(1-0).
In summary, the velocities of the molecular gas are low, lying within of the galaxy’s systemic velocity. The FWHM lies below across most of the extended structure, which is significantly below the stellar velocity dispersion of BCGs (eg. von der Linden et al. 2007). The velocity structure is therefore inconsistent with gravitational motions within the galaxy.


3.4 Velocity profiles
Fig. 4 shows ordered velocities along the N and SW filaments. We have produced position-velocity (PV) cuts along each of the filaments resolved in the higher spatial resolution CO(3-2) observations to identify velocity gradients (Fig. 8). Fig. 8 (upper left) shows the axis used for each PV slice, which summed the line emission across the width of each filament (). The N filament has a shallow velocity gradient from to over (). The inner region of this filament shows the two velocity components detected within of the nucleus at and at the BCG’s systemic velocity. The SE filament contains the broadest velocity component with a FWHM of . The gas clouds in this filament could be moving nearly along the line of sight and therefore at a different orientation the velocity structure would be similar to the other two filaments. The two intensity peaks in the SE filament have similarly broad FWHM and they may be physically separate along the line of sight.
A velocity gradient from at large radii to coincident with the nucleus is observed along the inner () of the SW filament. This gradient may reverse at larger radii or the outer part of the SW filament may be breaking up or a separate structure. The velocity structure of the SW filament appears to link continuously to the gas projected across the nucleus with a peak at and this structure may extend to include the gas at the base of the N filament. The SE and N filaments appear clumpy towards the galaxy centre with no clear velocity gradient across the nucleus. However, the additional broad velocity component at the centre suggests there could be a superposition of fainter structures at a range of velocities. The CO(1-0) observations are consistent with this velocity structure but at lower spatial resolution (Fig. 3).


3.5 Molecular gas mass
The molecular gas mass can be calculated from the integrated CO(1-0) intensity () under the assumption of a Galactic CO-to-H2 conversion factor ():
| (1) |
where in the Milky Way disk (Solomon et al. 1987; Solomon & Vanden Bout 2005; Bolatto, Wolfire & Leroy 2013), is the luminosity distance, and is the redshift of the BCG. However, the Galactic conversion factor is not expected or observed to be universal (eg. Narayanan et al. 2011; Bolatto, Wolfire & Leroy 2013), and likely depends on many environmental factors such as the gas metallicity (eg. Wilson 1995; Arimoto, Sofue & Tsujimoto 1996; Bolatto et al. 2008). Chandra observations show that the cluster atmosphere on the scales of the BCG, from which the molecular gas likely cooled, has subsolar metallicity of with only modest spatial variations (Sanders et al. 2014). Low metal abundance likely results in an underestimate of the molecular gas mass in PKS 0745-191, unless the cool gas in the filaments has a higher metallicity compared to the ambient ICM (eg. Panagoulia, Fabian & Sanders 2013).
However, Spitzer observations measure an IR luminosity for the BCG just below the threshold for a LIRG and starburst galaxies are known to have factors lower than found for galaxy disks. Although the BCG in PKS 0745-191 falls short of the massive starbursts found in ULIRGs, the molecular gas mass could be overestimated by a factor of a few (Solomon et al. 1997; Downes & Solomon 1998). For kinematically disturbed and turbulent gas associated with outflows where the gas may be optically thin even lower factors are expected (for a review see Bolatto, Wolfire & Leroy 2013). Although the molecular gas in PKS 0745-191 is not settled in the gravitational potential well, the gas velocities are low. The velocity dispersions of the molecular clouds are narrow (David et al. 2014; Tremblay et al. in prep.), which is typical of an individual molecular cloud in the Galactic disk. In summary, none of these factors suggest that the factor for the BCG in PKS 0745-191 is anomalous and the low metal abundance suggests the molecular gas mass could be underestimated. Our conclusions are not qualitatively altered by the estimated factor of a few uncertainty.
From the integrated CO(1-0) intensity of (Table 1), the total molecular gas mass is . Roughly one third of this mass is unresolved within the central peak close to the nuclear continuum emission. Assuming the CO(1-0) and CO(3-2) emission are distributed similarly (section 3.2), we can estimate the molecular gas mass of each filament. The SE filament is likely the most massive with . The N and SW filaments have similar total masses with and , respectively. Although the CO(3-2) emission appears more centrally concentrated with of the total flux within a radius of (comparable to the CO(1-0) synthesized beam), this may indicate that some extended structure has been resolved away rather than intrinsic differences in the spatial distribution.
3.6 Star formation in the BCG
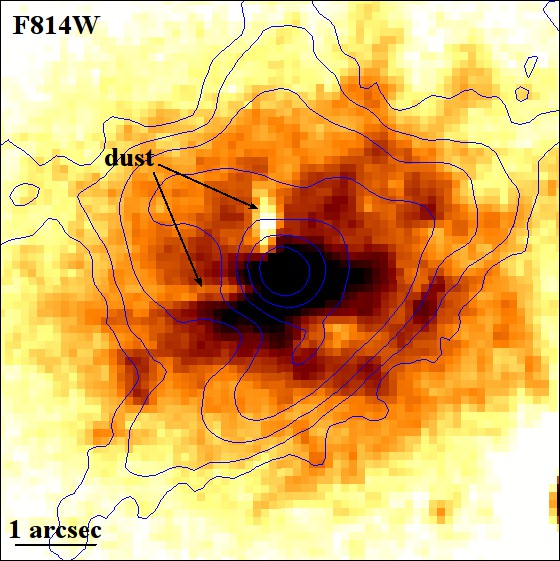
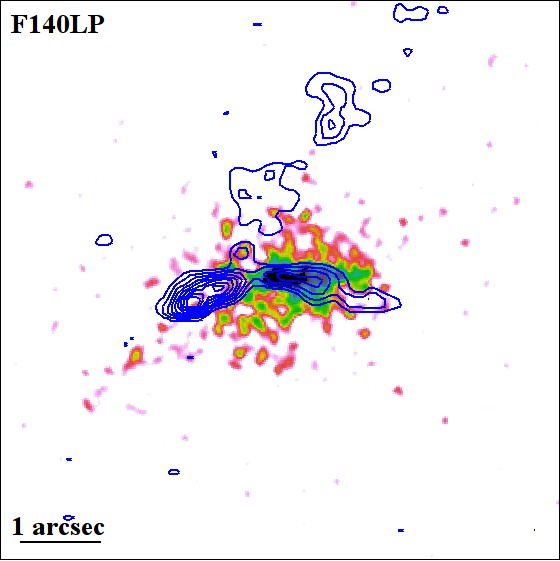
Assuming that CO(3-2) emission traces the gas surface area, the molecular gas surface density of for the BCG is comparable to that of circumnuclear starburst galaxies (eg. Kennicutt 1998; Daddi et al. 2010; Kennicutt & Evans 2012). HST FUV observations show a clear UV excess at the centre of the BCG extending to the W of the nucleus that is clearly coincident with the inner part of the SW filament before it bends at radius (Fig. 9). The SBC F140LP observation does not suffer from contaminating line emission or a significant AGN contribution (Quillen et al. 2008; Donahue et al. 2011; Mittal, Whelan & Combes 2015). The cold molecular gas filament extending to the SW is therefore coincident with a recent burst of star formation whilst the other two filaments lie along dust lanes with little star formation detected in the FUV (Fig. 9). The dust lanes may obscure star formation in the N and SE molecular filaments but the agreement between the FUV and IR-derived star formation rates suggests no significant population of buried young stars (Johnstone, Fabian & Nulsen 1987; Romanishin 1987; Hicks & Mushotzky 2005; Donahue et al. 2011; O’Dea et al. 2008; Mittal, Whelan & Combes 2015). Spitzer infrared photometry and spectroscopy reveal star formation rates of (O’Dea et al. 2008) and (Donahue et al. 2011), respectively. Using the extent of the CO(3-2) emission in the SW filament, the star formation surface density is . The BCG in PKS 0745-191 therefore lies on the Kennicutt-Schmidt relation with IR-selected starburst galaxies (Kennicutt 1998; Kennicutt & Evans 2012).
4 Discussion
4.1 Origin of the molecular gas
The inferred molecular gas mass in the BCG is substantially higher than that typically found in early-type galaxies raising the question of its origin. Mergers between the BCG and donor galaxies are likely rare due to the dearth of gas-rich galaxies at the centres of rich clusters (eg. Young et al. 2011) and because the cluster’s high velocity dispersion decreases the merger rate. Ram pressure stripping by the ICM of a gas rich galaxy that passes close to the BCG seems similarly unlikely. Molecular gas is much more tightly bound to its host galaxy than atomic gas and is retained on all but the most eccentric orbits within a cluster (eg. Young et al. 2011). Observations of Virgo cluster members have shown that galaxies with strong HI deficiencies have minimal molecular gas deficiencies (Kenney & Young 1989; di Serego Alighieri et al. 2007; Grossi et al. 2009). In PKS 0745-191, the filaments have low velocities, radial morphologies and shallow velocity gradients with no indication of the high velocities and large-scale rotation expected from the stripping of a merging galaxy (eg. Ueda et al. 2014). The three observed filaments in the BCG would likely require separate direct impacts by gas-rich galaxies each depositing similarly large quantities of molecular gas at low velocities.
BCGs located at the centres of dense cluster atmospheres with radiative cooling times below a Gyr are known to host cold molecular gas in excess of a few (Edge 2001; Salomé & Combes 2003). The Perseus cluster hosts of extended molecular gas filaments coincident with the coolest X-ray gas (Salomé et al. 2006). The simplest interpretation of their velocity structure is an inflow of gas cooling from the ICM, free-falling toward the BCG (Salomé et al. 2008; Lim, Ao & Dinh-V-Trung 2008). In PKS 0745-191, the X-ray cooling rate of determined from XMM-RGS spectroscopy (Sanders et al. 2014) could supply the molecular gas mass in only . This cooling timescale is also comparable to the time since the last major AGN outburst given by the age of the X-ray cavities, which require to rise at the sound speed to the observed projected radii (Rafferty et al. 2006; Sanders et al. 2014). Whilst it appears likely that the molecular gas cooled from the cluster atmosphere, the low gas velocities are inconsistent with free-fall.
4.2 Molecular gas clouds in gravitational free-fall?
The velocity gradients detected in the N and SW filaments could indicate an inflow of gas cooling from the cluster atmosphere but the interpretation depends on the location of the gas along the line of sight. Without absorption line observations showing whether the cold gas lies in front or behind the galaxy, it is difficult to unambiguously determine whether gas is moving in or out. However, the low velocities and shallow velocity gradients are inconsistent with simple models for gas cooling steadily from the cluster atmosphere. The ICM is approximately in hydrostatic equilibrium; therefore, an overdense, rapidly cooling gas blob is initially at rest with respect to the cluster. This cooling gas decouples from the cluster atmosphere and is expected to subsequently free-fall in the cluster’s gravitational potential (eg. Pizzolato & Soker 2005, 2010; Gaspari, Brighenti & Temi 2015). Although X-ray gas pressure and cloud-cloud collisions will slow the infall, in general we expect a smooth radial velocity gradient with the highest velocities at the smallest radii. The velocity gradients along the SW and N filaments steadily increase to and with decreasing radius over a distance of a few kpc, respectively. The SE filament may have a similar velocity gradient obscured by an orientation close to the line of sight.
Following Lim, Ao & Dinh-V-Trung (2008), we assume a Hernquist model for the gravitational potential of an elliptical galaxy, expressed in terms of the total mass and effective radius, that reproduces a de Vaucouleurs surface brightness profile (Hernquist 1990). The velocity of a gas blob that free-falls in this potential is given by
| (2) |
where is the total galaxy mass, is the scale radius, which is related to the effective radius , is the initial radius and is the initial velocity. For PKS 0745-191, Allen, Fabian & Kneib (1996) measured a projected mass within a radius of of using a strong gravitational lensing analysis (corrected for our cosmology, see also Sanders et al. 2014). However, X-ray mass estimates assuming hydrostatic equilibrium have measured a lower total mass of within a radius of (Voigt & Fabian 2006; Sanders et al. 2014). The X-ray mass may be affected by strong deviations from spherical symmetry or a breakdown of hydrostatic equilibrium in the cluster centre. We have considered both estimates of the total mass in our analysis. The scale radius of was estimated from the K-band effective radius of given by the 2MASS extended source catalogue333http://www.ipac.caltech.edu/2mass (Skrutskie et al. 2006). We note that this may underestimate the true value as the 2MASS observations are not deep enough to trace the full extent of the BCG envelope and PKS 0745-191 lies near the Galactic plane on the sky.
The remaining free parameters are the initial radius, where the gas blob starts to free-fall, and the inclination to the line of sight. Beyond () from the initial radius, the velocity increases linearly with decreasing radius therefore the inclination is the main parameter that can be altered to match the velocity structure. However, for both the N and SW filaments, the shallow velocity gradients require an orientation from the plane of the sky. This assumes the conservative X-ray estimate of the total mass. The gravitational lensing total mass requires an even more stringent orientation from the plane of the sky.
The low velocities of the cold gas found in all three filaments appear inconsistent with gravitational infall. For an orientation of from the plane of the sky, a gas blob released from rest at a projected radius of () will reach a velocity of over projected distance. Depending on the exact form of the gravitational potential, the expected free-fall velocities could be higher by a factor of two. Therefore, if the molecular gas structures originated more than a few kpc from their current locations their velocities should significantly exceed those observed. The velocity of an infalling gas blob may be slowed by ram pressure drag from the ICM, although this is expected to be a minor effect for such dense gas, or by cloud-cloud collisions inside a radius of (eg. Pizzolato & Soker 2005; Gaspari, Brighenti & Temi 2015). Cloud-cloud collisions could be producing the broader FWHM at the base of the N filament where it may intersect the other filaments but are unlikely to substantially reduce the gas velocities at larger radii. For such low velocities and narrow FWHM, the molecular filaments must be transient structures formed from gas cooling locally and supported in situ (see section 4.5).
If the molecular filaments formed from rapid cooling of the hot atmosphere, the lack of molecular gas that could be associated with a previous cooling episode appears inconsistent with the observed stability of AGN feedback. The prevalence of short central radiative cooling times in cluster atmospheres and strong correlations with detections of cold gas, star formation and H emission suggest that cooling is long-lived (McNamara & Nulsen 2012; Fabian 2012). Studies of the fraction of cool core clusters with radio bubbles and central radio sources suggest that the duty cycle of AGN activity in BCGs is at least (Dunn & Fabian 2006, 2008; Bîrzan et al. 2012). AGN feedback appears more or less continuous, rather than strongly episodic, and the good agreement between the radio power and cooling losses suggest a stable balance to (eg. Ma et al. 2011; Hlavacek-Larrondo et al. 2012). Repeated episodes of cooling and heating in PKS 0745-191 are more consistent with these observations than a single, sudden influx of cold gas onto the BCG. Rapid accretion of previous massive molecular inflows by the SMBH would require implausibly high efficiency forming few young stars in the process.
4.3 Outflowing molecular gas clouds?
The most significant dust lane features detected in the BCG in HST observations (Fig. 9; Donahue et al. 2000) lie along the N and SE filaments. If the dusty molecular gas clouds obscured more than of the galaxy light then blueshifted and redshifted gas components could be cleanly interpreted as outflow and inflow, respectively. Using the F555W HST image, we subtracted the average surface brightness determined in sectors free of emission lines and dust in a series of elliptical annuli. The ellipticity and position angle for the BCG were taken from the 2MASS extended source catalog (Skrutskie et al. 2006) and should therefore not be affected by the line emission and dust lane structure. Along the dust lanes coincident with the N and SE filaments, the surface brightness falls below the average at that radius. The SW filament is instead coincident with excess emission at above the average at each radius likely due to star formation.
The peak absorbed fraction in the N and SE filaments could be higher as they are likely composed of unresolved dense, giant molecular cloud associations producing variations in the covering fraction on unresolved spatial scales in the HST images (eg. Salomé et al. 2008, 2011; David et al. 2014). In NGC 1275, Salomé et al. 2008 found that the CO line ratios indicate optically thick radiation but the observed brightness temperature of the molecular gas clumps is at least an order of magnitude below the expectation for normal, optically thick clouds. These observations can be reconciled if each molecular clump is comprised of many giant molecular clouds each with a mass of and a radius of typical of those found in the Milky Way (Solomon et al. 1987). Although the complexity of the structure makes a clean interpretation difficult, it is plausible that the peak absorbed fraction is significantly higher and therefore the bulk of the molecular gas in the NW and SE filaments lies on the near side of the galaxy. Regions of absorption in the N and SE filaments show that some of the gas clouds lie in front of the galaxy midplane.
Both velocity components in the SE filament are blueshifted with respect to the BCG’s systemic velocity and may be flowing away from the galaxy centre. Whilst the brightest velocity component at CO(1-0) has only a small velocity shift to , the second component is clearly observed as a blueshifted wing at . Although two velocity components are detected in the SE filament in the CO(3-2) emission, the velocities are modest, perhaps indicating different gas properties in this outflowing component. Blueshifted and redshifted velocity components are detected in the N filament at both CO(1-0) and CO(3-2). Multiple coincident velocity components likely indicates a superposition of structures along the line of sight. The more massive blueshifted component presumably lies in front of the galaxy centre and may similarly indicate gas outflowing from the galaxy centre. The second, less massive velocity component is redshifted to at most and is projected close to the nucleus but may lie anywhere along the line of sight.
In summary, the velocity structure and dust obscuration observed in the N and SE filaments are consistent with the bulk of the molecular gas moving outwards from the galaxy centre.
4.4 Molecular gas clouds lifted by radio bubbles?
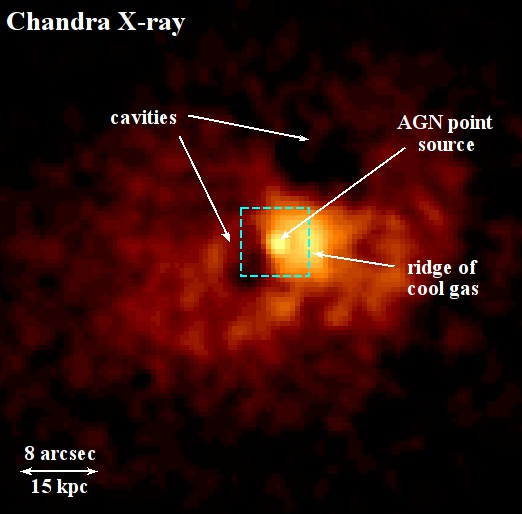
Radio and X-ray observations suggest that radio jet outbursts from the central SMBH are interacting with the extended molecular and ionized gas filaments. The VLA observation with a resolution of shows a bright nucleus with an extension of the radio emission in length to the W (Fig. 9; Baum & O’Dea 1991). The bright radio nucleus is coincident with the continuum point source detected with ALMA in the sub-mm and a hard X-ray point source detected with Chandra. A jet may have disrupted in the dense cluster environment, which is consistent with the amorphous radio appearance. Other radio galaxies in dense cluster environments are similarly disrupted, such as PKS 1246-410 at the centre of the Centaurus cluster (Taylor et al. 2006). This more diffuse structure observed in PKS 0745-191 in VLA images extends towards two X-ray surface brightness depressions, each across, located to the N and SE in Chandra observations (Fig. 10; Rafferty et al. 2006; Sanders et al. 2014). The AGN has inflated two large radio bubbles detected as cavities in the X-ray emission where the radio lobes have displaced the cluster’s hot atmosphere (McNamara & Nulsen 2007; Fabian 2012; McNamara & Nulsen 2012).
The N and SE molecular filaments extend out towards the X-ray cavities and may have been lifted from the galaxy in the wake of the buoyantly rising bubbles. No clear cavity is detected near the SW molecular gas filament although this would be difficult to detect under the bright soft X-ray ridge of emission. A small, young cavity may be located between the ridge and the X-ray point source where the X-ray surface brightness drops. ALMA observations of the BCG at the centre of A1835 have found a bipolar molecular flow in similarly extended filaments that may be accelerated outward by the mechanical energy associated with rising radio bubbles (McNamara et al. 2014). Single dish detections of molecular gas coincident with H filaments beneath buoyant radio bubbles in the Perseus cluster are consistent with this scenario (Salomé et al. 2006, 2011). Radio jet-driven outflows of molecular gas have also been detected in nearby galaxies (eg. Alatalo et al. 2011; Tadhunter et al. 2014; Morganti et al. 2015). Using a total molecular gas mass of , a gas velocity of and velocity dispersion of , the energy required to accelerate the molecular gas is several . By calculating the work done inflating the two radio bubbles in the hot atmosphere, Sanders et al. (2014) estimated that the AGN outburst supplies , which is energetically sufficient to uplift the molecular gas. Buoyant bubbles cannot lift more weight than they displace. Using a conservative estimate of the surrounding gas density, the radio bubbles displace of hot gas and therefore could have lifted of molecular gas along with a significant amount of warmer gas.
The NW and SE filaments in PKS 0745-191 comprise per cent of the total cold molecular gas, which suggests very strong coupling to the radio bubbles. The lack of any centrally concentrated reservoir of molecular gas coincident with the nucleus requires an even higher coupling fraction. It is difficult to understand how radio bubbles could uplift dense molecular gas clouds so efficiently. Volume-filling gas would be easier to lift. Roughly 20 per cent of the molecular gas appears uplifted by the radio bubbles in A1835, which together with the hot gas outflow produces a total uplifted mass uncomfortably close to the theoretical maximum. McNamara et al. (2014) suggested that turbulence maintained by ongoing star formation would reduce the density contrast and enable uplift of the molecular gas by the hotter gas. However, the star formation in PKS 0745-191 is concentrated in the SW filament.
4.5 Forming molecular gas in extended filaments
In a cluster atmosphere where AGN heating locally balances radiative cooling, uplift by radio bubbles can promote cooling by removing gas from this equilibrium state. Low entropy gas that has been lifted to larger radii is cooler and denser than the surroundings and therefore radiates more energy than can be replaced by the local heating rate. The molecular gas filaments could therefore have formed from warmer gas that was uplifted by the radio bubble and cooled locally (Churazov et al. 2001; Revaz, Combes & Salomé 2008; Li & Bryan 2014). Rapid cooling of shock-heated outflowing gas to form molecules on short timescales has been suggested to explain the molecular gas kinematics in IC 5063 and 4C 12.50 (Morganti et al. 2013; Tadhunter et al. 2014; Zubovas & King 2014; Morganti et al. 2015). Fig. 9 shows that the molecular gas filaments also trace the brightest regions of optical line emission and this gas is coincident with low temperature X-ray gas (Sanders et al. 2014). The time taken for the radio bubbles to rise at the sound speed to the observed projected radii is for the E bubble and for the NW bubble. The X-ray cooling rate of is large enough to supply the inferred molecular gas mass of the filaments in this time (section 4.1). This would however require catastropic cooling of the hot gas around the radio bubbles. From Sanders et al. (2014), the hot gas density profile within radius can be approximated by a powerlaw . Extrapolating into the cluster centre, the hot gas mass is within a sphere of radius , which covers the extent of the molecular filaments. Rapid cooling to supply the of molecular gas would therefore deplete the hot gas at the cluster centre and the resulting inflow would oppose uplift of the gas.
The slowest step in the cooling process is the formation of molecular hydrogen, which requires the presence of dust grains to occur on these timescales (eg. Ferland, Fabian & Johnstone 1994; Ferland et al. 2009). Dust grains are sputtered rapidly () in the X-ray atmosphere (Draine & Salpeter 1979; Dwek & Arendt 1992) so cooling X-ray gas is likely dust-free. However, the N and SE molecular filaments are clearly coincident with dust lanes in the HST observations (Fig. 9). Little recent star formation is detected in these filaments but dust could have been distributed locally by the BCG’s older stellar population. Material ejected from stars at the centres of cool core clusters may not necessarily mix rapidly with and be heated by the surrounding hot gas environment (Voit & Donahue 2011). If this gas remains cool the embedded dust will be preserved and could enrich the cooling gas filaments. The dusty molecular wake extending behind the evolved star Mira in our galaxy suggests that stellar ejecta can remain cold and dense in the interstellar medium, consistent with this scenario (Martin et al. 2007). Dust could also have been uplifted from the BCG centre along with the rapidly cooling gas and shielded from the X-ray atmosphere in dense gas clumps. If the molecular gas has the momentum of the warmer, uplifted gas that it cooled from, the low outflow velocities suggest a gentle acceleration that would not destroy dust grains. Slow entrainment of the gas by the radio bubbles would also not dissociate the molecular gas.
For the observed gas velocities of and projected lengths of , the dynamical ages of the SE and N filaments are , which is approximately the bubble rise time. However, if the molecular filaments are only supported by thermal pressure, they would collapse under tidal gravitational forces on timescales (eg. Ho, Lim & Dinh-V-Trung 2009). The survival of dense gas filaments at the centres of hot, high pressure cluster atmospheres for at least a dynamical timescale suggests that magnetic fields are required to support and insulate against rapid evaporation. This assumes that the small ionised fraction of the cold gas supported by the magnetic field effectively transmits the magnetic stress to the large neutral portion through collisions. Ambipolar diffusion is also assumed to be sufficiently slow to allow effective links between the molecular, atomic and ionised gas components (eg. Shu 1992; McKee & Ostriker 2007). Fabian et al. (2008) show that the thread-like H filaments in the Perseus cluster are likely supported by magnetic fields of at least a few tens of (see also Ho, Lim & Dinh-V-Trung 2009). The filamentary structure of the molecular gas and optical line emission in PKS 0745-191 appears very similar to the Perseus cluster. The molecular gas filaments are likely to be a superposition of many separate structures and unresolved strands.
However, the demands on magnetic support appear much greater in PKS 0745-191. The magnetic pressure required to support the molecular gas is , where is the magnetic field strength, is the molecular gas surface density and is the gravitational acceleration. The width of each filament in PKS 0745-191 is not resolved therefore we calculate a lower limit on the magnetic pressure by assuming that the width is given by the synthesized beam. The SE filament is in length with a radius of and a molecular gas mass of . Following Fabian et al. (2008), for a radial filament the lengthwise column density and the surface density . The gravitational acceleration at the centre of PKS 0745-191 (Sanders et al. 2014). The magnetic pressure required , which is roughly an order of magnitude greater than the thermal pressure of the hot gas (Sanders et al. 2014). Therefore, supporting the weight of the massive cold gas filament requires a magnetic pressure that substantially exceeds the hot gas pressure. The corresponding magnetic field strength is significantly above typical values for cluster cores (Carilli & Taylor 2002; Govoni & Feretti 2004) and possible enhancements from flux-freezing (eg. Sharma, Parrish & Quataert 2010). Such a large, aspherical pressure distribution in the cluster centre should produce departures from hydrostatic equilibrium in the hot gas. Sanders et al. (2014) found evidence for non-thermal pressure within a radius of in PKS 0745-191 and showed that the coolest X-ray emitting gas is offset by around from the nucleus. This asymmetry could be related to sloshing of the cool core (Sanders et al. 2014) or, for a magnetically-dominated core, it could indicate clumping of the hot gas as the ICM is squeezed by the magnetic pressure. The hot gas in the cluster centre will therefore have a low filling factor and a lower mean density compared to a uniformly distributed medium. The amorphous structure of the central radio source is coincident with and may be related to this magnetically-dominated core region. Faraday rotation measurements of the extended radio emission could be used to determine the magnetic field strength.
The problems of magnetic pressure support and hot gas depletion could be alleviated if the factor for BCGs, and correspondingly the molecular gas mass, was lower by an order of magnitude. For a lower molecular gas mass of , the magnetic pressure required to support the filaments would be comparable to the hot gas pressure, consistent with the X-ray observations (Sanders et al. 2014). Rapid cooling of only 10% of the hot gas within a radius of could supply the molecular gas mass on the required timescales. A reduced factor would also not move the filaments in PKS 0745-191 significantly beyond the scatter of the Kennicutt-Schmidt relation (eg. Kennicutt & Evans 2012). ULIRG and starburst galaxy environments are known to have kinematically disturbed molecular gas with higher temperatures and velocity dispersions causing reductions in by a factor of a few to ten (eg. Solomon et al. 1997; Downes & Solomon 1998; Bolatto, Wolfire & Leroy 2013). However, as discussed in section 3.5, the low gas velocities in PKS 0745-191 and narrow velocity dispersions observed for molecular clouds in BCGs are inconsistent with the conditions in starburst galaxies. Herschel observations tracing the dust emission in PKS 0745-191 show that the bulk of the dust is low temperature at and a Galactic factor produces a gas-to-dust mass ratio of consistent with that found in the Milky Way (Oonk et al. in prep.). Therefore, whilst a lower factor could alleviate several problems, we find no clear evidence to support a significantly lower value in PKS 0745-191 beyond galaxy-to-galaxy variations. The low metal abundance suggests the molecular gas mass could instead be underestimated unless the cool gas in the filaments has an enhanced metallicity over the ambient ICM (eg. Panagoulia, Fabian & Sanders 2013).
4.6 Fate of the molecular gas
Fig. 9 shows a striking coincidence between the SW filament of molecular gas, a spur of young, massive stars in the FUV and extended radio emission at detected at significance in VLA observations (Baum & O’Dea 1991). The filament also extends towards the surface brightness peak of the cluster emission. In comparison, little recent star formation is observed coincident with either the N or SE filaments even though each has a higher inferred molecular gas mass and similar velocity structure. An external perturbation, such as an expanding radio structure, may have triggered gas cloud collapse and star formation in the SW filament. The dust lanes coincident with the N and SE filaments could obscure recent star formation, although IR observations are inconsistent with a substantial population of buried young stars (section 3.6) and it is not clear why the SW filament is not similarly dusty.
A collision between an expanding radio lobe and dense gas clouds in the SW filament may have disrupted the radio structure and triggered star formation at this location, consistent with the amorphous radio morphology in lower frequency observations. Jet-triggered star formation is thought to be occuring in Cen A and Minkowski’s object (Graham & Price 1981; van Breugel et al. 1985; Dey et al. 1997; Bicknell et al. 2000; Oosterloo & Morganti 2005; Santoro et al. 2015; Salomé et al. 2016) and could explain the deflection of the radio jets in A1795 (McNamara et al. 1996; Pinkney et al. 1996). For A1795, knots of young star clusters and dense molecular gas clouds clearly trace the outer edges of radio lobes and an increase in the ionization state, turbulence and density of the gas at the deflection point in the jets implies a direct interaction (Crawford, Sanders & Fabian 2005). However, although the gas filament appears deflected at the end of the small-scale extension of the radio emission in PKS 0745-191, no increase in the velocity dispersion is observed either along the SW filament or by comparison with the other filaments. The SW filament also has a lower CO(3-2)/CO(1-0) line ratio than the other filaments which is consistent with more diffuse gas. It is therefore not clear if these structures are physically interacting or merely observed as coincident in projection.
Star formation also occurs in a minority of the extended cool gas filaments in the Perseus cluster despite their substantial molecular gas mass (Canning et al. 2014). Only three separate regions of the outer filaments have been disrupted by an unknown mechanism and rapidly collapsed into stars ago (Canning et al. 2014). The filaments do not appear to become generally unstable due to bulk sloshing motions in the ICM or growth through hot gas mixing with the cold phase and weak shocks generated by the radio bubble inflation do not appear to have similarly destabilised the inner filaments (Fabian et al. 2011; Canning et al. 2014). Star formation only in the SW filament in PKS 0745-191 is consistent with these findings and given the comparable structure of the three separate gas filaments it appears likely that the radio structure is responsible for triggering its collapse.
The long-term state of the non-star-forming filaments is unclear. The gas velocities lie far below the BCG’s escape velocity therefore the molecular gas clouds will remain in the galaxy’s potential. The outer filaments may eventually evaporate in the hot cluster gas or fall back onto the central galaxy and subsequently fuel the AGN. If these cold gas clouds are subsequently fuelling the AGN, the feedback must somehow be prompt or approximately constant to explain the close connection between detections of cold gas, H emission and star formation and short radiative cooling times in the hot cluster atmosphere (Edge 2001; Salomé & Combes 2003; Rafferty, McNamara & Nulsen 2008; Cavagnolo et al. 2008). Lower significance structures at the outer sections of the N and SE filaments hint at the break up of these filaments (Fig. 4). Deeper observations will be required to determine the fate of these gas clumps, potentially as a circulation flow falling back to the BCG centre (Lim, Ao & Dinh-V-Trung 2008; Salomé et al. 2006, 2011).
5 Conclusions
ALMA Cycle 1 observations of PKS 0745-191 have revealed of molecular gas in the BCG in three large filaments extending to radii. The molecular cloud velocities are remarkably low, within of the BCG’s systemic velocity, and the velocity dispersion is significantly less than the typical stellar velocity dispersion of such a massive BCG. Apparently, the molecular gas has not settled in to the gravitational potential well and the filament structure is expected to break up on timescales unless it is supported, possibly by magnetic fields. The low velocities and shallow velocity gradients along the filaments are inconsistent with free-fall or a merger. The molecular gas clouds must have originated from gas cooling less than a few kpc from their current location or much higher velocities would be observed. However, although the X-ray cooling rate from the XMM-RGS could supply of molecular gas on a timescale, such rapid cooling would dramatically deplete the hot gas within the radius of the filaments.
The N and SE filaments are projected beneath cavities in X-ray surface brightness images corresponding to large radio bubbles inflated by the central AGN that are now buoyantly rising through the cluster. These filaments contain of the total molecular gas mass, therefore direct uplift by the radio bubbles appears to require an implausibly high coupling efficiency. In a cluster where AGN heating is locally balanced by radiative cooling, lifting low entropy gas from its equilibrium state at the cluster centre can promote cooling. The cold filaments are coincident with low temperature X-ray gas, bright optical line emission and dust lanes suggesting that the molecular gas could have formed by gas cooling from uplifted warmer gas. The survival of these extended cold gas filaments for at least a dynamical timescale suggests magnetic fields are required for support and insulation against the hot cluster atmosphere. Supporting the weight of the massive molecular filaments requires a magnetic pressure that is an order of magnitude greater than the hot gas pressure. Chandra observations of PKS 0745-191 are consistent with departures from hydrostatic equilibrium in the cluster core and non-thermal pressure contributions within a radius of .
The N filament extends furthest and appears to be breaking into clumps at large radius. The filaments may eventually fragment with gas clouds falling back onto the BCG centre in a circulation flow that subsequently fuels the central AGN. However, if the filaments are formed from rapid cooling of the cluster atmosphere at , we would expect to detect molecular gas structures associated with previous cooling episodes. The prevalence of short central radiative cooling times in cluster atmospheres and strong correlations with detections of cold gas and star formation suggest that cooling is long-lived and the AGN supplies a regular input of energy. Whilst a single episode of rapid cooling seems unlikely, it also appears implausible that such a large fraction of the cold gas in previous inflows could have been rapidly accreted whilst forming few young stars. We note that an factor for BCGs that falls significantly below the Galactic value could alleviate several problems, including the demands on magnetic pressure and depletion of the hot gas. However, the low gas velocities in PKS 0745-191 and narrow velocity dispersions observed for molecular clouds in BCGs are inconsistent with the kinematic disturbances in starburst galaxies that require significantly lower factors. The low metal abundance suggests that the molecular gas mass could instead have been underestimated.
HST FUV observations of PKS 0745-191 show a bright spur of emission from young, massive star formation at coincident with the SW molecular gas filament. The SW filament has a comparable velocity structure and mass to the other two filaments and such a clumpy, highly asymmetric distribution of gas about the nucleus does not appear consistent with a gas disk. The small-scale radio structure detected in VLA radio observations is also spatially coincident with the SW filament. A collision between an expanding radio structure and the molecular gas may have triggered collapse of the gas clouds and star formation in the SW filament. Disruption of the radio structure on small scales is also consistent with the amorphous radio morphology on larger scales in low frequency observations. However, no increase in the velocity dispersion is observed either along the SW filament or by comparison with the other filaments.
Acknowledgements
HRR and ACF acknowledge support from ERC Advanced Grant Feedback 340442. BRM acknowledges support from the Natural Sciences and Engineering Council of Canada and the Canadian Space Agency Space Science Enhancement Program. PEJN was partly supported by NASA contract NAS8-03060. ACE acknowledges support from STFC grant ST/L00075X/1. GRT acknowledges support from Einstein Postdoctoral Fellowship Award Number PF-150128, issued by the Chandra X-ray Observatory Center, which is operated by the Smithsonian Astrophysical Observatory for and on behalf of NASA under contract NAS8-03060. We thank the reviewer for their thorough reading of the paper and encouraging comments. This paper makes use of the following ALMA data: ADS/JAO.ALMA 2012.1.00837.S. ALMA is a partnership of ESO (representing its member states), NSF (USA) and NINS (Japan), together with NRC (Canada), NSC and ASIAA (Taiwan), and KASI (Republic of Korea), in cooperation with the Republic of Chile. The Joint ALMA Observatory is operated by ESO, AUI/NRAO and NAOJ. The scientific results reported in this article are based on data obtained from the Chandra Data Archive. This publication makes use of data products from the Two Micron All Sky Survey, which is a joint project of the University of Massachusetts and the Infrared Processing and Analysis Center/California Institute of Technology, funded by the National Aeronautics and Space Administration and the National Science Foundation.
References
- Alatalo et al. (2011) Alatalo K. et al., 2011, ApJ, 735, 88
- Allen, Fabian & Kneib (1996) Allen S. W., Fabian A. C., Kneib J. P., 1996, MNRAS, 279, 615
- Arimoto, Sofue & Tsujimoto (1996) Arimoto N., Sofue Y., Tsujimoto T., 1996, PASJ, 48, 275
- Baum & O’Dea (1991) Baum S. A., O’Dea C. P., 1991, MNRAS, 250, 737
- Best et al. (2007) Best P. N., von der Linden A., Kauffmann G., Heckman T. M., Kaiser C. R., 2007, MNRAS, 379, 894
- Bicknell et al. (2000) Bicknell G. V., Sutherland R. S., van Breugel W. J. M., Dopita M. A., Dey A., Miley G. K., 2000, ApJ, 540, 678
- Bîrzan et al. (2004) Bîrzan L., Rafferty D. A., McNamara B. R., Wise M. W., Nulsen P. E. J., 2004, ApJ, 607, 800
- Bîrzan et al. (2012) Bîrzan L., Rafferty D. A., Nulsen P. E. J., McNamara B. R., Röttgering H. J. A., Wise M. W., Mittal R., 2012, MNRAS, 427, 3468
- Bolatto et al. (2008) Bolatto A. D., Leroy A. K., Rosolowsky E., Walter F., Blitz L., 2008, ApJ, 686, 948
- Bolatto, Wolfire & Leroy (2013) Bolatto A. D., Wolfire M., Leroy A. K., 2013, ARA&A, 51, 207
- Bower et al. (2006) Bower R. G., Benson A. J., Malbon R., Helly J. C., Frenk C. S., Baugh C. M., Cole S., Lacey C. G., 2006, MNRAS, 370, 645
- Canning et al. (2014) Canning R. E. A. et al., 2014, MNRAS, 444, 336
- Carilli & Taylor (2002) Carilli C. L., Taylor G. B., 2002, ARA&A, 40, 319
- Cavagnolo et al. (2008) Cavagnolo K. W., Donahue M., Voit G. M., Sun M., 2008, ApJ, 683, L107
- Churazov et al. (2001) Churazov E., Brüggen M., Kaiser C. R., Böhringer H., Forman W., 2001, ApJ, 554, 261
- Crawford, Sanders & Fabian (2005) Crawford C. S., Sanders J. S., Fabian A. C., 2005, MNRAS, 361, 17
- Croton et al. (2006) Croton D. J. et al., 2006, MNRAS, 365, 11
- Daddi et al. (2010) Daddi E. et al., 2010, ApJ, 714, L118
- Dasyra & Combes (2011) Dasyra K. M., Combes F., 2011, A&A, 533, L10
- David et al. (2014) David L. P. et al., 2014, ApJ, 792, 94
- Dey et al. (1997) Dey A., van Breugel W., Vacca W. D., Antonucci R., 1997, ApJ, 490, 698
- di Serego Alighieri et al. (2007) di Serego Alighieri S. et al., 2007, A&A, 474, 851
- Donahue et al. (2011) Donahue M., de Messières G. E., O’Connell R. W., Voit G. M., Hoffer A., McNamara B. R., Nulsen P. E. J., 2011, ApJ, 732, 40
- Donahue et al. (2000) Donahue M., Mack J., Voit G. M., Sparks W., Elston R., Maloney P. R., 2000, ApJ, 545, 670
- Downes & Solomon (1998) Downes D., Solomon P. M., 1998, ApJ, 507, 615
- Draine & Salpeter (1979) Draine B. T., Salpeter E. E., 1979, ApJ, 231, 77
- Dunn & Fabian (2006) Dunn R. J. H., Fabian A. C., 2006, MNRAS, 373, 959
- Dunn & Fabian (2008) Dunn R. J. H., Fabian A. C., 2008, MNRAS, 385, 757
- Dwek & Arendt (1992) Dwek E., Arendt R. G., 1992, ARA&A, 30, 11
- Edge (2001) Edge A. C., 2001, MNRAS, 328, 762
- Egami et al. (2006) Egami E. et al., 2006, ApJ, 647, 922
- Fabian (1994) Fabian A. C., 1994, ARA&A, 32, 277
- Fabian (2012) Fabian A. C., 2012, ARA&A, 50, 455
- Fabian et al. (1985) Fabian A. C. et al., 1985, MNRAS, 216, 923
- Fabian et al. (2008) Fabian A. C., Johnstone R. M., Sanders J. S., Conselice C. J., Crawford C. S., Gallagher, III J. S., Zweibel E., 2008, Nat, 454, 968
- Fabian et al. (2011) Fabian A. C. et al., 2011, MNRAS, 418, 2154
- Ferland et al. (2009) Ferland G. J., Fabian A. C., Hatch N. A., Johnstone R. M., Porter R. L., van Hoof P. A. M., Williams R. J. R., 2009, MNRAS, 392, 1475
- Ferland, Fabian & Johnstone (1994) Ferland G. J., Fabian A. C., Johnstone R. M., 1994, MNRAS, 266, 399
- Gaspari, Brighenti & Temi (2015) Gaspari M., Brighenti F., Temi P., 2015, A&A, 579, A62
- Govoni & Feretti (2004) Govoni F., Feretti L., 2004, International Journal of Modern Physics D, 13, 1549
- Graham & Price (1981) Graham J. A., Price R. M., 1981, ApJ, 247, 813
- Grossi et al. (2009) Grossi M. et al., 2009, A&A, 498, 407
- Hamer et al. (2012) Hamer S. L., Edge A. C., Swinbank A. M., Wilman R. J., Russell H. R., Fabian A. C., Sanders J. S., Salomé P., 2012, MNRAS, 421, 3409
- Hatch et al. (2006) Hatch N. A., Crawford C. S., Johnstone R. M., Fabian A. C., 2006, MNRAS, 367, 433
- Heckman (1981) Heckman T. M., 1981, ApJ, 250, L59
- Hernquist (1990) Hernquist L., 1990, ApJ, 356, 359
- Hicks & Mushotzky (2005) Hicks A. K., Mushotzky R., 2005, ApJ, 635, L9
- Hlavacek-Larrondo et al. (2012) Hlavacek-Larrondo J., Fabian A. C., Edge A. C., Ebeling H., Sanders J. S., Hogan M. T., Taylor G. B., 2012, MNRAS, 421, 1360
- Ho, Lim & Dinh-V-Trung (2009) Ho I.-T., Lim J., Dinh-V-Trung, 2009, ApJ, 698, 1191
- Hogan et al. (2015) Hogan M. T. et al., 2015, MNRAS, 453, 1201
- Hu, Cowie & Wang (1985) Hu E. M., Cowie L. L., Wang Z., 1985, ApJS, 59, 447
- Hunstead, Murdoch & Shobbrook (1978) Hunstead R. W., Murdoch H. S., Shobbrook R. R., 1978, MNRAS, 185, 149
- Jaffe & Bremer (1997) Jaffe W., Bremer M. N., 1997, MNRAS, 284, L1
- Jaffe, Bremer & Baker (2005) Jaffe W., Bremer M. N., Baker K., 2005, MNRAS, 360, 748
- Johnstone, Fabian & Nulsen (1987) Johnstone R. M., Fabian A. C., Nulsen P. E. J., 1987, MNRAS, 224, 75
- Kenney & Young (1989) Kenney J. D. P., Young J. S., 1989, ApJ, 344, 171
- Kennicutt & Evans (2012) Kennicutt R. C., Evans N. J., 2012, ARA&A, 50, 531
- Kennicutt (1998) Kennicutt, Jr. R. C., 1998, ARA&A, 36, 189
- Li & Bryan (2014) Li Y., Bryan G. L., 2014, ApJ, 789, 153
- Lim, Ao & Dinh-V-Trung (2008) Lim J., Ao Y., Dinh-V-Trung, 2008, ApJ, 672, 252
- Ma et al. (2011) Ma C.-J., McNamara B. R., Nulsen P. E. J., Schaffer R., Vikhlinin A., 2011, ApJ, 740, 51
- Markwardt (2009) Markwardt C. B., 2009, in Astronomical Society of the Pacific Conference Series, Vol. 411, Astronomical Data Analysis Software and Systems XVIII, Bohlender D. A., Durand D., Dowler P., eds., p. 251
- Martin et al. (2007) Martin D. C. et al., 2007, Nat, 448, 780
- McKee & Ostriker (2007) McKee C. F., Ostriker E. C., 2007, ARA&A, 45, 565
- McMullin et al. (2007) McMullin J. P., Waters B., Schiebel D., Young W., Golap K., 2007, in Astronomical Society of the Pacific Conference Series, Vol. 376, Astronomical Data Analysis Software and Systems XVI, Shaw R. A., Hill F., Bell D. J., eds., p. 127
- McNamara & Nulsen (2007) McNamara B. R., Nulsen P. E. J., 2007, ARA&A, 45, 117
- McNamara & Nulsen (2012) McNamara B. R., Nulsen P. E. J., 2012, New Journal of Physics, 14, 055023
- McNamara & O’Connell (1992) McNamara B. R., O’Connell R. W., 1992, ApJ, 393, 579
- McNamara et al. (2014) McNamara B. R. et al., 2014, ApJ, 785, 44
- McNamara et al. (1996) McNamara B. R., Wise M., Sarazin C. L., Jannuzi B. T., Elston R., 1996, ApJ, 466, L9
- Mittal, Whelan & Combes (2015) Mittal R., Whelan J. T., Combes F., 2015, MNRAS, 450, 2564
- Morganti et al. (2013) Morganti R., Fogasy J., Paragi Z., Oosterloo T., Orienti M., 2013, Science, 341, 1082
- Morganti et al. (2015) Morganti R., Oosterloo T., Oonk J. B. R., Frieswijk W., Tadhunter C., 2015, A&A, 580, A1
- Morganti, Tadhunter & Oosterloo (2005) Morganti R., Tadhunter C. N., Oosterloo T. A., 2005, A&A, 444, L9
- Narayanan et al. (2011) Narayanan D., Krumholz M., Ostriker E. C., Hernquist L., 2011, MNRAS, 418, 664
- Nesvadba et al. (2006) Nesvadba N. P. H., Lehnert M. D., Eisenhauer F., Gilbert A., Tecza M., Abuter R., 2006, ApJ, 650, 693
- O’Dea et al. (2008) O’Dea C. P. et al., 2008, ApJ, 681, 1035
- Oonk et al. (2010) Oonk J. B. R., Jaffe W., Bremer M. N., van Weeren R. J., 2010, MNRAS, 405, 898
- Oosterloo & Morganti (2005) Oosterloo T. A., Morganti R., 2005, A&A, 429, 469
- Panagoulia, Fabian & Sanders (2013) Panagoulia E. K., Fabian A. C., Sanders J. S., 2013, MNRAS, 433, 3290
- Peterson & Fabian (2006) Peterson J. R., Fabian A. C., 2006, Phys. Rep., 427, 1
- Pinkney et al. (1996) Pinkney J. et al., 1996, ApJ, 468, L13
- Pizzolato & Soker (2005) Pizzolato F., Soker N., 2005, ApJ, 632, 821
- Pizzolato & Soker (2010) Pizzolato F., Soker N., 2010, MNRAS, 408, 961
- Quillen et al. (2008) Quillen A. C. et al., 2008, ApJS, 176, 39
- Rafferty, McNamara & Nulsen (2008) Rafferty D. A., McNamara B. R., Nulsen P. E. J., 2008, ApJ, 687, 899
- Rafferty et al. (2006) Rafferty D. A., McNamara B. R., Nulsen P. E. J., Wise M. W., 2006, ApJ, 652, 216
- Revaz, Combes & Salomé (2008) Revaz Y., Combes F., Salomé P., 2008, A&A, 477, L33
- Romanishin (1987) Romanishin W., 1987, ApJ, 323, L113
- Salomé & Combes (2003) Salomé P., Combes F., 2003, A&A, 412, 657
- Salomé et al. (2006) Salomé P. et al., 2006, A&A, 454, 437
- Salomé et al. (2011) Salomé P., Combes F., Revaz Y., Downes D., Edge A. C., Fabian A. C., 2011, A&A, 531, A85
- Salomé et al. (2008) Salomé P., Revaz Y., Combes F., Pety J., Downes D., Edge A. C., Fabian A. C., 2008, A&A, 483, 793
- Salomé et al. (2016) Salomé Q., Salomé P., Combes F., Hamer S., Heywood I., 2016, A&A, 586, A45
- Sand et al. (2005) Sand D. J., Treu T., Ellis R. S., Smith G. P., 2005, ApJ, 627, 32
- Sanders et al. (2014) Sanders J. S., Fabian A. C., Hlavacek-Larrondo J., Russell H. R., Taylor G. B., Hofmann F., Tremblay G., Walker S. A., 2014, MNRAS, 444, 1497
- Santoro et al. (2015) Santoro F., Oonk J. B. R., Morganti R., Oosterloo T., 2015, A&A, 574, A89
- Sharma, Parrish & Quataert (2010) Sharma P., Parrish I. J., Quataert E., 2010, ApJ, 720, 652
- Shu (1992) Shu F. H., 1992, The physics of astrophysics. Volume II: Gas dynamics.
- Skrutskie et al. (2006) Skrutskie M. F. et al., 2006, AJ, 131, 1163
- Solomon et al. (1997) Solomon P. M., Downes D., Radford S. J. E., Barrett J. W., 1997, ApJ, 478, 144
- Solomon et al. (1987) Solomon P. M., Rivolo A. R., Barrett J., Yahil A., 1987, ApJ, 319, 730
- Solomon & Vanden Bout (2005) Solomon P. M., Vanden Bout P. A., 2005, ARA&A, 43, 677
- Tadhunter et al. (2014) Tadhunter C., Morganti R., Rose M., Oonk J. B. R., Oosterloo T., 2014, Nat, 511, 440
- Taylor et al. (2006) Taylor G. B., Sanders J. S., Fabian A. C., Allen S. W., 2006, MNRAS, 365, 705
- Tremblay et al. (2015) Tremblay G. R. et al., 2015, MNRAS, 451, 3768
- Ueda et al. (2014) Ueda J. et al., 2014, ApJS, 214, 1
- van Breugel et al. (1985) van Breugel W., Filippenko A. V., Heckman T., Miley G., 1985, ApJ, 293, 83
- Voigt & Fabian (2006) Voigt L. M., Fabian A. C., 2006, MNRAS, 368, 518
- Voit & Donahue (2011) Voit G. M., Donahue M., 2011, ApJ, 738, L24
- von der Linden et al. (2007) von der Linden A., Best P. N., Kauffmann G., White S. D. M., 2007, MNRAS, 379, 867
- Wilman, Edge & Swinbank (2009) Wilman R. J., Edge A. C., Swinbank A. M., 2009, MNRAS, 395, 1355
- Wilson (1995) Wilson C. D., 1995, ApJ, 448, L97
- Young et al. (2011) Young L. M. et al., 2011, MNRAS, 414, 940
- Zubovas & King (2014) Zubovas K., King A. R., 2014, MNRAS, 439, 400