Can decaying sterile neutrinos account for all dark matter?
Abstract
The recent discovery of unexplained X-ray line of keV emitted from the Perseus cluster of galaxies and M31 and the excess X-ray line of keV emitted from the Milky Way center may indicate that dark matter would decay. In this article, I show that approximately 80 % of dark matter being 7.1 keV sterile neutrinos and 20 % of dark matter being 17.4 keV sterile neutrinos can satisfactorily explain the observed X-ray lines and account for all missing mass. No free parameter is needed in this model. This scenario is also compatible with current robust observational constraints from the matter power spectrum in large-scale structures and would alleviate the challenges faced by the existing dark matter models.
Tai Po, New Territories, Hong Kong, China
Keywords Dark matter, sterile neutrinos
1 Introduction
The dark matter problem is one of the major problems in astrophysics. It is commonly believed that some unknown massive and collisionless particles exist to account for the missing mass in our universe. They are regarded as cold dark matter (CDM) because they are massive and become non-relativistic when they decouple from normal matter. In general, the CDM model provides good fits on large-scale structure observations such as cluster mass profiles (Pointecouteai et al., 2005) and the matter power spectrum (Spergel and Steinhardt, 2000). However, some observations in dwarf galaxies and clusters indicate that cores exist (Salucci, 2001; Borriello and Salucci, 2001; Oh et al., 2011; Tyson et al., 1998; Sand et al., 2008; de Blok, 2010; Newman et al., 2011), which contradict the results from N-body simulations based on the CDM model (Navarro et al., 1997). This discrepancy is now known as the core-cusp problem. Moreover, the number of small dark halos and the density of subhalos predicted by the CDM model does not match the observations of Local Group (Boylan-Kolchin et al., 2011; Cho, 2012). These discrepancies are respectively known as the missing satellite problem and the too big to fail problem.
Although there are some suggestions that baryonic processes such as supernovae and AGN feedbacks may help to alleviate the problems (Weinberg and Katz, 2002; Maccìo et al., 2012), it is still quite controversial to make conclusion because the baryonic component is just a minor component in galaxies and clusters which may not have a significant effect on the dark matter distribution (Peñarrubia et al., 2012; Vogelsberger et al., 2012).
Another idea to solve the above problem is that the dark matter is not cold. The existence of keV mass dark matter particles, as a candidate of warm dark matter (WDM), has been proposed. In particular, one popular candidate of WDM particle is sterile neutrino, which does not interact with other particles except by gravity. Basically, the WDM model can solve the core-cusp problem, the missing satellite problem and the too big to fail problem faced by the CDM model (Destri et al., 2013a; Lovell et al., 2014). Moreover, some unexplained X-ray fluxes with energies keV (Bulbul et al., 2014a) and 8.7 keV (Koyama et al., 2007; Prokhorov and Silk, 2010) are obtained recently, which may be due to the decay of sterile neutrinos. These sterile neutrinos can be produced via some mechanisms such as Dodelson-Widrow (DW) mechanism (Dodelson and Widrow, 1994) and Shi-Fuller (SF) mechanism (Shi and Fuller, 1999).
However, recent observations of the Lyman- forest and X-ray background put a very tight constraint on sterile neutrino mass and the mixing angle , which nearly rule out the possibility of DW sterile neutrinos as dark matter (Seljak et al., 2006; Viel et al., 2006; Boyarsky et al., 2009; Viel et al., 2013). Nevertheless, these constraints would be released if we do not assume that all sterile neutrino dark matter were produced by non-resonant (DW) mechanism. For example, the sterile neutrinos that was produced from Higgs decays or in split seesaw mechanism can give agreements with both the Lyman- bounds and X-ray bounds (Petraki and Kusenko, 2008; Kusenko et al., 2010). Moreover, Abazajian (2014) shows that the resonantly-produced (produced by SF mechanism) decaying sterile neutrinos can solve the problems faced by the CDM model and account for all dark matter. However, this model requires one more free parameter, the lepton asymmetry , which is not known. In this article, I show that if all dark matter consists of two types of sterile neutrinos produced by DW mechanism, it can satisfactorily account for the unexplained X-ray flux and does not contradict to the matter power spectrum constrained by the data of the Lyman- forest. No free parameter is needed in this model.
2 The decay lines from Perseus and the Milky Way
Recently, a potential detection of an X-ray line at energy keV from a stacked combination of clusters, with a particularly bright signal from Perseus cluster, was found (Bulbul et al., 2014a). The largest detected line flux from the Perseus cluster is photons cm-2 s-1 (Bulbul et al., 2014a). A similar line at nearly the same energy keV from M31 is also reported (Boyarsky et al., 2014). The largest detected flux from the inner 3.4 kpc is photons cm-2 s-1 (Boyarsky et al., 2014). These X-ray fluxes seem to be larger than the expected fluxes, which require some new mechanisms to explain. There has been a lot of debate over this issue (Boyarsky et al., 2015; Bulbul et al., 2014b; Jeltema and Profumo, 2015a, 2014; Phillips et al., 2015). Therefore, this problem has not been settled, and we assume that the production of the large detected fluxes involve some unknown mechanisms. Besides, some emission lines above 6 keV from Milky Way center has been detected. In particular, Prokhorov and Silk (2010) find a significant excess of keV photons which cannot be explained by ionization and recombination processes. The measured intensity of the FeXXVI Ly is ph cm-2 s-1, which is about 3 times larger than the expected intensity ph cm-2 s-1 and an order of magnitude larger than the general X-ray intensity ( ph cm-2 s-1) (Ruchayskiy et al., 2015). The excess flux is photons cm-2 s-1 (Prokhorov and Silk, 2010).
It has been suggested that these unexplained lines may be produced by the decay of dark matter particles (Prokhorov and Silk, 2010; Bulbul et al., 2014a; Boyarsky et al., 2014; Finkbeiner and Weiner, 2014). If these lines are produced by the decay of sterile neutrinos, the corresponding masses of the sterile neutrinos would be 7.1 keV and 17.4 keV respectively (since ). There are many proposed models to generate more than 1 sterile neutrinos. For example, Asaka et al. (2005) propose an extension of the Minimal Standard Model (MSM) to generate 3 sterile right-handed neutrinos. Besides, Xing (2012) propose a type(I+II) seesaw mechanism to construct a flavor mixing matrix to generate 3 light or heavy sterile neutrinos. Our proposal is basically compatible with the above models. One or more sterile neutrinos can be conjectured in the above mechanisms to account for the observations.
However, some recent studies start to challenge the discovery of the excess 3.55 keV line. For example, Horiuchi et al. (2014) show that the production of sterile neutrinos via DW mechanism cannot 100% account for all dark matter. Also, Anderson et al. (2014) claim that no excess 3.55 keV line is detected from some of the other galaxies and galaxy groups. In particular, observations, including our own galaxy, dwarf spheroidal galaxies and Draco, show negative results for the excess 3.55 keV line (Riemer-Sorensen, 2014; Malyshev et al., 2014; Jeltema and Profumo, 2015b). Iakubovskyi (2014) reviews most of the criticisms of the excess 3.55 keV line and concludes that the existing result is still consistent with the decaying dark matter scenario. Moreover, Ruchayskiy et al. (2015) perform detailed analysis and show that the Draco observation does not exclude the dark matter interpretation of the 3.5 keV line.
Besides, Carlson et al. (2015) recently report that the detected 3.55 keV lines in the Milky Way center and Perseus highly correlate with the morphology of baryonic matter. This suggests that the 3.55 keV line might be originated from baryonic matter, but not the dark matter. However, this result is expected in the Milky Way because we know that the central mass in many galaxies including the Milky Way is dominated by baryonic matter (Lelli, 2014; Iooco et al., 2015). Also, many studies have suggested that the total matter distribution in galaxies basically follows the baryonic matter distribution (Gentile et al., 2009; Lelli, 2014). For the Perseus cluster, the parameters used by Carlson et al. (2015) are questionable. First of all, the mass-concentration relation used is significantly different from the one in recent literature (see Schaller et al. (2014)). As a result, the concentration parameter used in Carlson et al. (2015) is 50% larger than the standard one (Sànchez-Conde et al., 2011). This would overestimate the dark matter mass for Perseus by a factor of 2 and underestimate the mixing angle by a factor of 1.4. Secondly, since Perseus is a cool-cored cluster, the central density of dark matter would be smaller (see Chan (2014)). Therefore, the central region of Perseus would be dominated by baryonic hot gas and the 3.5 keV signal would follow the cool-core morphology. Based on the above arguments, the discovery of the excess 3.55 keV line is still a good evidence to support the existence of decaying dark matter.
The mixing angles of 7.1 keV sterile neutrinos calculated by the fluxes from Perseus and M31 are (Bulbul et al., 2014a) and (Boyarsky et al., 2014) respectively. For 17.4 keV sterile neutrinos, the mixing angle calculated is (Prokhorov and Silk, 2010). Obviously, there is some tension between the calculated mixing angles obtained from the data of Perseus and M31. However, the calculations of the mixing angles in Perseus and M31 assume that the dark matter density follows the NFW profile (Bulbul et al., 2014a; Boyarsky et al., 2014). The NFW profile generally gives good fits to most clusters (including Perseus), but not for most galaxies (Grillo, 2012; Chae et al., 2014). It has been shown that the NFW profile does not give a good fit to M31 dark matter density profile (Banerjee and Jog, 2008; Chemin et al., 2009). If a dark matter core exists in M31, the resulting mixing angle calculated would be larger and the tension would be alleviated. For the DW mechanism, the dark matter velocity distribution is thermal so that the sterile neutrino mass determines whether the density profile is cored or cuspy, provided that the baryonic effects are not important. de Vega and Sanchez (2013) show that 7 keV sterile neutrinos can give the correct abundance of substructures for kpc scales, which disagrees with the NFW profile. Therefore, the mixing angle calculated in Boyarsky et al. (2014) may be underestimated. In this article, we only use the mixing angle calculated from the data of Perseus because the obtained density profile is more reliable.
Suppose that the sterile neutrinos were produced by the DW mechanism. The relation between the mixing angle and the fraction of total mass of sterile neutrinos to total dark matter mass is given by (Dolgov and Hansen, 2002; Mapelli and Ferrara, 2005)
| (1) |
If we assume keV, by using the mixing angle derived in Bulbul et al. (2014a), we get (note that ).
For the Milky Way, the line absorption due to the gas near the Milky Way center is significant (the absorption in Perseus is negligible). The mixing angle obtained in Prokhorov and Silk (2010) is directly calculated from the observed line intensity in Koyama et al. (2007) without absorption corrections. Therefore, we should first re-calculate the mixing angles by considering the optical depth of the X-ray photons. The optical depth of the X-ray photons emitted at is given by
| (2) |
where is the absorption cross section, and are the number density profile and the total size of gas halo respectively. The absorption cross section of a particular ion or atom is given by (Daltabuit and Cox, 1972)
| (3) |
where , and are parameters for different elements. Here, we consider some major absorption atoms and metal ions such as Hydrogen, Helium, Carbon, Nitrogen, Oxygen, Silicon, Neon, Sulphur and Iron. Therefore, the effective cross section is , where is the fraction of the element in the gas. The value of can be determined by the metallicity of the gas.
Near the Milky Way center, the number densities of atomic and molecular gases are 0.9 cm-3 and 74 cm-3 respectively (Ferriere et al., 2007), and the metallicity of the gas is about (Muno et al., 2004; Sakano et al., 2004), which largely enhance the absorption. Assuming a constant density profile, the optical depth is about 0.21. By eliminating the effect of absorption and taking keV, we get and . In fact, observations indicate that the inner density profile follows (Schödel et al., 2002) and the density profile in the outer region is nearly a constant (Ferriere et al., 2007). Since most of the absorption occurs near the inner region, our assumption using the constant density profile would underestimate the effect of absorption. Hence, the value of should be somewhat larger. Nevertheless, we still use the above calculated range as a conservative estimation.
If there are two types of decaying sterile neutrinos, one being 7.1 keV and the other being 17.4 keV, the fraction of sterile neutrinos would be . In other words, the X-ray line fluxes show that these two types of decaying sterile neutrinos can account for all or at least a major part of the dark matter. Nevertheless, the emission lines do not exclude a third type of sterile neutrino dark matter as the lower limit of is well below 1.
Bulbul et al. (2014a) state that the sterile neutrinos produced by the DW mechanism can only account for about 1% of the dark matter. It is because they use the mixing angle derived from a stacked spectrum of galaxy clusters. In particular, they neglect the result of Perseus because they believe that the observed intensity might originate from the cool core of Perseus, but not from sterile neutrinos. Nevertheless, Boyarsky et al. (2014) discover that the outskirts of Perseus cluster also show a similar strong 3.5 keV line (Iakubovskyi, 2014). In fact, the results of Perseus are more reliable because it is a large, nearby, and well-studied cluster. However, the full sample used in Bulbul et al. (2014a) contains many small and distant clusters (many clusters with redshift ). The stacked analysis in Bulbul et al. (2014a) uses a single equation and some scaling laws to model the amount of dark matter, which may have large uncertainties. For example, the mass of cluster hot gas used in Bulbul et al. (2014a) follows the results in Vikhlinin et al. (2009). This gas mass fraction is 50% lower than the observed one for high-redshift clusters () (Landry et al., 2013). Therefore, the dark matter content for high-redshift clusters in Bulbul et al. (2014a) is overestimated. As a result, a smaller mixing angle is obtained because the sample contains many clusters with . In addition, the concentration parameter used in Bulbul et al. (2014a) is significantly deviated from the observed one for high-redshift clusters () (Niikura et al., 2015). This would significantly overestimate the dark matter mass for high-redshift clusters and give an overall smaller mixing angle. In fact, the uncertainties of the empirical scaling relations in cosmological simulations are not small, and the scaling relations used in Bulbul et al. (2014a) are somewhat different from that obtained in recent studies (Mantz et al., 2016). Therefore, using the result of Perseus is more appropriate in our analysis.
3 Reconciling the claim with other observations
Observations from the Lyman- forest and the X-ray background give tight constraints on sterile neutrino mass. For example, Seljak et al. (2006); Viel et al. (2006) based on 3000 SDSS data obtained keV and keV respectively. Recently, Viel et al. (2013) used the data from 28 high redshift quasars and got keV. However, as pointed out by Boyarsky et al. (2009), the evaluations of WDM model based on the Lyman- forest suffer from some major problems, such as observational uncertainties, theoretical uncertainties related to numerical simulations, and astrophysical uncertainties relevant for Lyman- physics (thermal history and ionization history of the intergalactic medium). Moreover, it has been shown that the late-time velocity dispersion of dark matter particles has a significant effect on Lyman- clouds during structure formation, which may give a wrong estimation of the lower bound of (Valageas, 2012). These factors are a great challenge for the results obtained from the Lyman- forest data alone.
By combining the WMAP 5 data, two different Lyman- sets and SDSS data, Boyarsky et al. (2009) get a robust constraint on sterile neutrino mass: keV (frequentist 99.7 % confidence) and keV (Bayesian 95 % credible interval). However, these bounds are obtained by assuming there is only one type of sterile neutrinos.
If there are two types of sterile neutrinos and they contribute to the power spectrum individually, the combined power spectrum is given by (Ma, 1996)
| (4) |
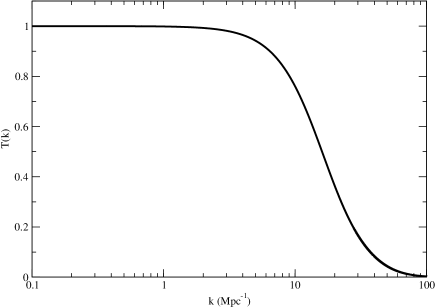
where is the cosmological density parameter for dark matter, , , and are the corresponding cosmological density parameters and power spectrums of 7.1 keV and 17.4 keV sterile neutrinos respectively. It is more convenient to define a transfer function such that , where and are the power spectrums for the WDM and CDM models respectively. The transfer function can be well described by the following analytic form (Destri et al., 2013b):
| (5) |
where , , Mpc-1. Although this analytic form is derived for one-component dark matter, the velocity distributions of these two types of sterile neutrinos are thermal, and the cross sections are so small such that they nearly do not interact with each other. Hence, the resultant contribution of the two components can be thought of as an effective single-component contribution. Assuming and , we get Mpc-1, where . The robust constraints from Boyarsky et al. (2009) give Mpc-1 (frequentist 99.7 % confidence) and Mpc-1 (Bayesian 95 % credible interval). Therefore, the resultant calculated satisfies the current lower bounds from the combination results of WMAP 5, Lyman- sets and SDSS data (see Fig. 1). Note that the parameter used here is different from another free-streaming parameter which represents the comoving scale of collisionless particles that interact only gravitationally. Basically, these two parameters serve different purposes, and the parameter is more convenient to use here because it can be obtained directly from the transfer function.
The observational data from the model-independent diffuse X-ray background give the following constraint (Boyarsky et al., 2006a):
| (6) |
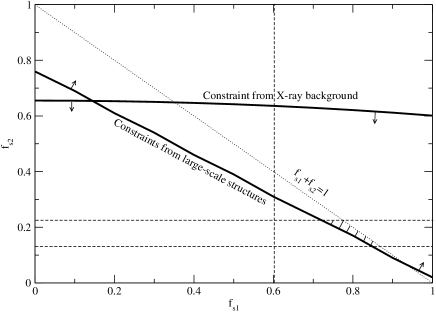
If there are two types of decaying sterile neutrinos, by using Eq. (1), the constraint becomes
| (7) |
In Fig. 2, we plot the constraint from diffuse X-ray background together with the constraints from decay lines and data from large-scale structures. It shows that our results with keV and with keV satisfy all current constraints. However, as mentioned in Boyarsky et al. (2009), the single-component non-resonant (DW) decaying sterile neutrino model is ruled out by observations (see Fig. 2).
Besides the diffuse X-ray constraints from Boyarsky et al. (2006a), our model is also consistent with some recent model-independent constraints. For example, observations of Ursa Minor give model-independent constraints and (Loewenstein et al., 2009). However, some model-dependent observations give more stringent constraints on and . For example, based on the results in Boyarsky et al. (2006b, 2008); Riemer-Sorensen (2009), the strongest constraints are and . Moreover, some of the model-dependent constraints are completely negative to our decaying sterile neutrino model (Malyshev et al., 2014; Jeltema and Profumo, 2015b). Nevertheless, most of the results highly depend on the dark matter density profiles of the dwarf spheroidal galaxies, which have large uncertainties. For example, some of the studies follow the ‘favoured NFW model’ (Malyshev et al., 2014; Jeltema and Profumo, 2015b) while recent observations suggest that the dark matter density of the dwarf spheroidal galaxies are cored (Burkert, 2015). The cored profile will suppress the observed flux so that the constraints can be severely alleviated. Besides the functional form of the dark matter density profiles, the parameters of the dark matter density profiles also have large uncertainties, even for our Milky Way and M31. Therefore, these model-dependent constraints cannot completely rule out the possibility of the two-component decaying sterile neutrino model.
4 Discussion
In this article, I assume that there are two types of decaying sterile neutrinos produced by DW mechanism, which can account for all dark matter in our universe without any free parameters. Approximately 80 % of dark matter being 7.1 keV sterile neutrinos and 20 % of dark matter being 17.4 keV sterile neutrinos can satisfactorily explain the observed X-ray lines from the Perseus galaxy cluster and the Milky Way center. Originally, it has been thought that the decaying sterile neutrinos produced by DW mechanism has been ruled out by Lyman- forest data. However, if we include one more type of sterile neutrinos, the tension in the mass range of sterile neutrinos between the constraint from X-ray background and the observed data from power spectrum would be released. In general, similar calculations can be applied for decaying sterile neutrinos produced by SF mechanism. However, one more free parameter would be generated to achieve the same purpose (Abazajian, 2014).
Also, we may expect to discover a 8.7 keV line emitted from other nearby dwarf galaxies and galaxy clusters. For example, the decaying sterile neutrinos in Fornax cluster would give a flux of cm-2 s-1 or erg cm-2 s-1 at 8.7 keV. Such a weak line is consistent with the current constraint obtained in Riemer-Sorensen (2014). Further verification can be done by future X-ray observations.
On the other hand, the calculation of the power spectrum in this model (Eq. (4)) does not include the gravitational interaction between the two components. A larger would be obtained if we fully consider this effect in the structure formation. Nevertheless, this larger must also satisfy the current constraints from observations.
If our model is correct, this would alleviate the challenges faced by the CDM model (the core-cusp problem, the missing satellite problem and the too big to fail problem) and save the existing one-component DW sterile neutrino model, which is nearly ruled out by the data from large-scale observations. To verify our result based on the above calculations, numerical simulations with two-component WDM is needed.
References
- Abazajian (2014) Abazajian K. N., 2014, Phys. Rev. Lett. 112, 161303.
- Anderson et al. (2014) Anderson M. E., Churazov E., Bregman J. N., arXiv:1408.4115.
- Asaka et al. (2005) Asaka T., Blanchet S., Shaposhnikov M., 2005, Phys. Lett. B 631, 151.
- Banerjee and Jog (2008) Banerjee A., Jog C. J., 2008, Astrophy. J. 685, 254.
- de Blok (2010) de Blok W. J. G., 2010, Adv. Astron. 2010, 789293.
- Borriello and Salucci (2001) Borriello A., Salucci P., 2001, Mon. Not. R. Astron. Soc. 323, 285.
- Boyarsky et al. (2006a) Boyarsky A., Beronov A., Ruchayskiy O., Shaposhnikov M., 2006, Mon. Not. R. Astron. Soc. 370, 213.
- Boyarsky et al. (2006b) Boyarsky A., Neronov A., Ruchayskiy O., Shaposhnikov M., Tkachev I., 2006, Phys. Rev. Lett., 97, 261302.
- Boyarsky et al. (2008) Boyarsky A., Iakubovskyi D., Ruchayskiy O., Savchenko V., 2008, Mon. Not. R. Astron. Soc. 387, 1361.
- Boyarsky et al. (2009) Boyarsky A., Lesgourgues J., Ruchayskiy O., Viel M., 2009, Journal of Cosmology and Astroparticle Physics 5, 012.
- Boyarsky et al. (2014) Boyarsky A., Ruchayskiy O., Iakubovskyi D., Franse J., arXiv:1402.4119.
- Boyarsky et al. (2015) Boyarsky A., Franse J., Iakubovskyi D., Ruchayskiy O., arXiv:1408.4388.
- Boylan-Kolchin et al. (2011) Boylan-Kolchin M., Bullock J. S., Kaplinghat M., 2011, Mon. Not. R. Astron. Soc. 415, L40.
- Bulbul et al. (2014a) Bulbul E., Markevitch M., Foster A., Smith R. K., Loewenstrein M., Randall S. W., arXiv:1402.2301.
- Bulbul et al. (2014b) Bulbul E., Markevitch M., Foster A. R., Smith R. K., Loewenstein M., Randall S. W., arXiv:1409.4143.
- Burkert (2015) Burkert A., 2015, Astrophys. J. 808, 158
- Carlson et al. (2015) Carlson E., Jeltema T., Profumo S., 2015, JCAP 2015(02), 009.
- Chae et al. (2014) Chae K.-H., Bernardi M., Kravtsov A. V., 2014, Mon. Not. R. Astron. Soc. 437, 3670.
- Chan (2014) Chan M. H., 2014, Mon. Not. R. Astron. Soc. 442, L14.
- Chemin et al. (2009) Chemin L., Carignan C., Foster T., 2009, Astrophy. J. 705, 1395.
- Cho (2012) Cho A., 2012, Science, 336, 1091.
- Destri et al. (2013a) Destri C., de Vega H. J., Sanchez N. G., 2013, New Astronomy 22, 39.
- Destri et al. (2013b) Destri C., de Vega H. J., Sanchez N. G., 2013, Phy. Rev. D 88, 083512.
- de Vega and Sanchez (2013) de Vega H. J., Sanchez N. G., arXiv:1304.0759.
- Daltabuit and Cox (1972) Daltabuit E., Cox D. P., 1972, Astrophys. J. 177, 855.
- Dodelson and Widrow (1994) Dodelson S., Widrow L. M., 1994, Phys. Rev. Lett. 72, 17.
- Dolgov and Hansen (2002) Dolgov A. D., Hansen S. H., 2002, APh. 16, 339.
- Ferriere et al. (2007) Ferriere K., Gillard W., Jean P., 2007, Astron. Astrophys. 467, 611.
- Finkbeiner and Weiner (2014) Finkbeiner D. P., Weiner N., arXiv:1402.6671.
- Gentile et al. (2009) Gentile G., Famaey B., Zhao H., Salucci P., 2009, Nature 461, 627.
- Grillo (2012) Grillo C., 2012, Astrophy. J. 747, L15.
- Horiuchi et al. (2014) Horiuchi S. Humphrey P. J., Onorbe, J., Abazajian K. N., Kaplinghat, M., Garrison-Kimmel S., 2014, Phys. Rev. D 89, 025017.
- Iakubovskyi (2014) Iakubovskyi D. A., 2014, Adv. Astron. Sp. Phy. 4, 9.
- Iooco et al. (2015) Iocco F., Pato M., Bertone, G., 2015, Nature Physics 11, 245.
- Jeltema and Profumo (2014) Jeltema T., Profumo S., arXiv:1411.1759.
- Jeltema and Profumo (2015a) Jeltema T. E., Profumo S., 2015, Mon. Not. R. Astron. Soc. 450, 2143.
- Jeltema and Profumo (2015b) Jeltema T. E., Profumo S., arXiv:1512.01239.
- Koyama et al. (2007) Koyama, K. et al., 2007, PASJ 59, 245.
- Kusenko et al. (2010) Kusenko A., Takahashi F., Yanagida T. T., 2010, Phys. Lett. B 693, 144.
- Landry et al. (2013) Landry, D., Bonamente, M., Giles, P., Maughan, B., Joy, M., Murray, S., 2013, Mon. Not. R. Astron. Soc. 433, 2790.
- Lelli (2014) Lelli F., 2014, Galaxies 2, 292.
- Loewenstein et al. (2009) Loewenstein M., Kusenko A., Biermann P. L., 2009, Astrophy J. 700, 426.
- Lovell et al. (2014) Lovell M. R., Frenk C. S., Eke V. R., Jenkins A., Gao L., Theuns T., 2014, Mon. Not. R. Astron. Soc. 439, 300.
- Ma (1996) Ma C.-P., 1996, Astrophy. J. 471, 13.
- Maccìo et al. (2012) Maccìo A. V., Stinson G., Brook C. B., Wadsley J., Couchman H. M. P., Shen S., Gibson B. K., Quinn T., 2012, Astrophys. J. 744, L9.
- Malyshev et al. (2014) Malyshev D., Neronov A., Eckert D., 2014, Phys. Rev. D 90, 103506.
- Mapelli and Ferrara (2005) Mapelli M., Ferrara A., 2005, Mon. Not. R. Astron. Soc. 364, 2.
- Mantz et al. (2016) Mantz A. B., Allen S. W., Morris R. G., Schmidt R. W., 2016, Mon. Not. R. Astron. Soc. 456, 4020.
- Muno et al. (2004) Muno M. P. et al., 2004, Astrophys. J. 613, 326.
- Navarro et al. (1997) Navarro J. F., Frenk C. S., White S. D. M., 1997, Astrophys. J. 490, 493.
- Newman et al. (2011) Newman A. B., Treu T., Ellis R. S., Sand D. J., 2011, Astrophy. J. 728, L39.
- Niikura et al. (2015) Niikura, H., Takada, M., Okabe, N., Martino, R., Takahashi, R., arXiv:1504.01413.
- Oh et al. (2011) Oh S.-H., de Blok W. J. G., Brinks E., Walter F., Kennicutt R. C., 2011, Astron. J. 141, 193.
- Peñarrubia et al. (2012) Peñarrubia J., Pontzen A., Walker M. G., Koposov S. E., 2012, Astrophys. J. 759, L42.
- Petraki and Kusenko (2008) Petraki K., Kusenko A., 2008, Phy. Rev. D 77, 065014.
- Phillips et al. (2015) Phillips K. J. H., Sylwester B., Sylwester J., 2015, Astrophys. J. 809, 50.
- Pointecouteai et al. (2005) Pointecouteau E., Arnaud M., Pratt G. W., 2005, Astron. Astrophy. 435, 1.
- Prokhorov and Silk (2010) Prokhorov D. A., Silk J., 2010, Astrophys. J. 725, L131.
- Riemer-Sorensen (2009) Riemer-Sorensen S., Hansen S. H., 2009, Astron. Astrophys. 500, L37.
- Riemer-Sorensen (2014) Riemer-Sorensen S., arXiv:1405.7943.
- Ruchayskiy et al. (2015) Ruchayskiy O. et al., arXiv:1512.07217.
- Sakano et al. (2004) Sakano M., Warwick R. S., Decourchelle A., Predehl P., 2004, Mon. Not. R. Astron. Soc. 350, 129.
- Salucci (2001) Salucci P., 2001, Mon. Not. R. Astron. Soc. 320, L1.
- Sànchez-Conde et al. (2011) Sànchez-Conde M., Cannoni M., Zandanel F., Gòmez M., Prada F., 2011, JCAP 2011(12), 11.
- Sand et al. (2008) Sand D. J., Treu T., Ellis R. S., Smith G. P., Kenib J.-P., 2008, Astrophy. J. 674, 711.
- Schaller et al. (2014) Schaller M. et al., arXiv:1409.8617.
- Schödel et al. (2002) Schödel R. et al., 2002, Nature 419, 694.
- Seljak et al. (2006) Seljak U., Makarov A., McDonald A. P., Trac H., 2006, Phys. Rev. Lett. 97, 191303.
- Shi and Fuller (1999) Shi X.-d., Fuller G. M., 1999, Phys. Rev. Lett. 82, 2832.
- Spergel and Steinhardt (2000) Spergel D. N., Steinhardt P. J., 2000, Phys. Rev. Lett. 84, 3760.
- Tyson et al. (1998) Tyson J. A., Kochanski G. P., dell’Antonio I. P., 1998, Astrophy. J. 498, L107.
- Valageas (2012) Valageas P., 2012, Phys. Rev. D 86, 123501.
- Viel et al. (2006) Viel M., Lesgourgues J., Haehnelt M. G., Matarrese S., Riotto A., 2006, Phys. Rev. Lett. 97, 071301.
- Viel et al. (2013) Viel M., Becker G. D., Bolton J. S., Haehnelt M. G., 2013, Phys. Rev. D 88, 043502.
- Vikhlinin et al. (2009) Vikhlinin, A. et al., 2009, Astrophys. J. 692, 1033.
- Vogelsberger et al. (2012) Vogelsberger M., Zavala J., Loeb A., 2012, Mon. Not. R. Astron. Soc. 423, 3740.
- Weinberg and Katz (2002) Weinberg M. D., Katz N., 2002, Astrophys. J. 580, 627.
- Xing (2012) Xing Z.-Z., 2012, Phys. Rev. D 85, 013008.