The Diverse Origins of Neutron-Capture Elements
in the Metal-Poor Star HD 94028:
Possible Detection of Products of -process
Nucleosynthesis††\dagger††\daggerSome
data presented in this paper were obtained from the
Barbara A. Mikulski Archive for Space Telescopes (MAST).
The Space Telescope Science Institute
is operated by the Association of Universities for Research in
Astronomy, Inc., under NASA contract NAS5-26555.
These data are associated with Programs GO-7402 and GO-8197.
Based on data obtained from the European Southern Observatory (ESO)
Science Archive Facility.
These data are associated with Program 072.B-0585(A).
This paper includes data taken at The McDonald Observatory of The
University of Texas at Austin.
Abstract
We present a detailed analysis of the composition and nucleosynthetic origins of the heavy elements in the metal-poor ([Fe/H] 1.62 0.09) star HD 94028. Previous studies revealed that this star is mildly enhanced in elements produced by the slow neutron-capture process ( process; e.g., [Pb/Fe] 0.79 0.32) and rapid neutron-capture process ( process; e.g., [Eu/Fe] 0.22 0.12), including unusually large molybdenum ([Mo/Fe] 0.97 0.16) and ruthenium ([Ru/Fe] 0.69 0.17) enhancements. However, this star is not enhanced in carbon ([C/Fe] 0.06 0.19). We analyze an archival near-ultraviolet spectrum of HD 94028, collected using the Space Telescope Imaging Spectrograph on board the Hubble Space Telescope, and other archival optical spectra collected from ground-based telescopes. We report abundances or upper limits derived from 64 species of 56 elements. We compare these observations with -process yields from low-metallicity AGB evolution and nucleosynthesis models. No combination of - and -process patterns can adequately reproduce the observed abundances, including the super-solar [As/Ge] ratio (0.99 0.23) and the enhanced [Mo/Fe] and [Ru/Fe] ratios. We can fit these features when including an additional contribution from the intermediate neutron-capture process ( process), which perhaps operated by the ingestion of H in He-burning convective regions in massive stars, super-AGB stars, or low-mass AGB stars. Currently, only the process appears capable of consistently producing the super-solar [As/Ge] ratios and ratios among neighboring heavy elements found in HD 94028. Other metal-poor stars also show enhanced [As/Ge] ratios, hinting that operation of the process may have been common in the early Galaxy.
Subject headings:
nuclear reactions, nucleosynthesis, abundances — stars: abundances — stars: AGB and post-AGB stars — stars: individual (HD 94028)1. Introduction
Understanding the origin of the elements remains one of the major challenges of modern astrophysics. Ideally, to study the origin of each element, it is desirable to collect data on each element’s abundance beyond the solar system. Nearly all previous abundance studies of heavy elements in the near-ultraviolet (NUV) spectra of late-type stars have focused on stars enriched by products of rapid neutron-capture (-process) nucleosynthesis (Cowan et al., 1996, 2002, 2005; Sneden et al., 1998, 2003; Roederer et al., 2009, 2010, 2012a, 2012b, 2014b; Roederer & Lawler, 2012; Barbuy et al., 2011; Peterson, 2011; Siqueira Mello et al., 2013). One study (Placco et al., 2014) has studied the NUV spectrum of a carbon-enhanced metal-poor (CEMP) star with no enhancement of neutron-capture elements, and another (Placco et al., 2015) studied two CEMP stars enhanced with slow neutron-capture (-process) material (CEMP- stars). Both stars in the latter study, HD 196944 (catalog HD 196944) and HD 201626 (catalog HD 201626), are C-enhanced ([C/Fe] 1.1 and 1.5) and show substantial enhancements in many elements produced by -process nucleosynthesis (e.g., [Ba/Fe] 1.2 and 1.7; [Ce/Fe] 1.1 and 1.9; [Pb/Fe] 2.1 and 2.9).
The new advance enabled by access to the NUV spectra of these two stars was the detection of Ge i, Nb ii, Mo ii, Cd i, Lu ii, Pt i, and Au i. Most of these species are impossible to detect in the spectral range accessible to ground-based telescopes, and Ge, Cd, Lu, Pt, and Au had not been detected previously in any CEMP- star. HD 196944 (catalog HD 196944) and HD 201626 (catalog HD 201626) are each in wide binary systems with orbital periods of 1325 and 407 d (Lucatello et al., 2005; Placco et al., 2015). Placco et al. compared these abundances with model predictions, revealing that each star could be reasonably fit by the predicted -process yields from models of low-mass ( 0.9 ) stars on the asymptotic giant branch (AGB; Lugaro et al. 2012; Placco et al. 2013). The elements detected in the NUV had only a minor impact on the model selection, but the abundances of these elements all lie reasonably close (within 2) to the model predictions. One exception, Cd in HD 196944 (catalog HD 196944), was about 1 dex lower than that predicted by the model. Overall, however, the good agreement was encouraging, since the models had not previously been confronted with observations of metal-poor stars for these elements.
High-quality NUV spectra of stars capable of studying the chemical fossil record are limited. These data can only be collected with the Goddard High Resolution Spectrograph (GHRS), Space Telescope Imaging Spectrograph (STIS), or Cosmic Origins Spectrograph (COS). STIS and COS are both currently in operation on board the Hubble Space Telescope (HST), and the GHRS was retired during Servicing Mission 2 in 1997. The long exposure times required and stiff competition for observing time on HST present formidable challenges to obtaining new observational data. Fortunately, however, many high-quality spectroscopic datasets exist in the HST archives. Some were taken for other scientific purposes, and few abundance studies have focused specifically on the heaviest elements—those produced mainly by -capture reactions.
HD 94028 (catalog HD 94028) is one such star with high-quality NUV spectra in the HST archives. The high proper motion and excess of HD 94028 (catalog HD 94028) have been known for decades (e.g., Roman 1954). Carney et al. (1994) and Clementini et al. (1999) found hints of radial velocity variations in their data for HD 94028 (catalog HD 94028), but these were not confirmed by Stryker et al. (1985), Jasniewicz & Mayor (1988), Latham et al. (2002), or Roederer et al. (2014a). Peterson (2011) was the first to point out the unusually-high Mo abundance of HD 94028 (catalog HD 94028), [Mo/Fe] 1.0. This star also appeared in the metal-poor sample of Roederer et al. (2014a), who found a mild excess of elements commonly produced by -process nucleosynthesis. Several investigators have extended the chemical analysis of this star into the NUV, but all have focused narrowly on one or a few elements: Be and B (Thorburn & Hobbs, 1996; Primas et al., 1999); Mo and Ru (Peterson, 2011); Ge, As, and Se (Roederer, 2012); and P (Jacobson et al., 2014; Roederer et al., 2014c).
In the present study, we perform a more thorough analysis of all trace, heavy elements detected in the NUV spectrum of HD 94028 (catalog HD 94028). We place these results and the large set of optical abundances available from Roederer et al. (2014a) on a single abundance scale. The heavy elements in HD 94028 (catalog HD 94028) show evidence of enrichment by the process, process, and possibly a third, still poorly-studied nucleosynthesis process, the intermediate -capture process ( process). We attempt to model this abundance pattern and identify viable metal enrichment scenarios for HD 94028 (catalog HD 94028).
2. Data
2.1. Observations from the Archives
We use two NUV spectroscopic data sets of HD 94028 (catalog HD 94028) available in the Mikulski Archive for Space Telescopes. These observations were made using STIS (Kimble et al., 1998; Woodgate et al., 1998) on board the HST. One spectrum (data sets O5CN01-03, GO-8197, PI. Duncan) has very high spectral resolution ( 110,000). This spectrum covers 1885–2147 Å with signal-to-noise (S/N) ratios 35/1 per pixel near 2140 Å. The other spectrum (data sets O56D06-07, GO-7402, PI. Peterson) has high spectral resolution ( 30,000). This spectrum covers 2280–3117 Å with S/N ratios ranging from 20 near 2300 Å to 40 near 3100 Å. We use the reduction and coaddition provided by the StarCAT database (Ayres, 2010).
Roederer et al. (2014a) derived abundances from an optical spectrum of HD 94028 (catalog HD 94028) taken using the Robert G. Tull Coudé Spectrograph on the Harlan J. Smith Telescope at McDonald Observatory, Texas. We rederive abundances from this spectrum (Section 3.3) using the model atmosphere (Section 3.1) adopted in the present study. This spectrum covers 3650–8000 Å at 30,000 with S/N ratios ranging from 55 near 3950 Å to 170 near 6750 Å.
We also use an optical spectrum taken with the Ultraviolet and Visual Echelle Spectrograph (UVES; Dekker et al. 2000) on the Very Large Telescope (VLT) Kueyen at Cerro Paranal, Chile. We obtained this spectrum from the ESO Science Archive. This spectrum covers 3050–3860 Å at 37,000 with S/N ratios ranging from 40 near 3200 Å to 130 near 3800 Å.
2.2. Atomic Data
We compile our list of lines to examine from several recent studies of the NUV spectra of metal-poor stars. These lines and the list of references are given in Table 2.2. Many of these lines represent resonance or low-lying levels, and they are frequently the dominant decay channels from excited upper levels. Thus, the uncertainty in the transition probability is generally small and limited by the measurement uncertainty of the lifetime of the upper level. These uncertainties are also listed in Table 2.2.
| Species | E.P. | Ref. | |||
|---|---|---|---|---|---|
| (Å) | (eV) | ||||
| Cu ii | 2037.13 | 2.83 | 0.23 (0.03) | 1 | 2.25 (0.05) |
| Cu ii | 2054.98 | 2.93 | 0.29 (0.03) | 1 | 2.29 (0.15) |
| Cu ii | 2112.10 | 3.25 | 0.11 | 1 | 2.60 (0.20) |
| Cu ii | 2126.04 | 2.83 | 0.23 | 1 | 2.45 (0.10) |
| As i | 1890.43 | 0.00 | 0.19 | 2 | 1.10 (0.25) |
| Mo ii | 2015.11 | 0.00 | 0.49 (0.03) | 3 | 0.98 (0.15) |
| Mo ii | 2020.31 | 0.00 | 0.02 (0.04) | 3 | 1.32 (0.15) |
| Mo ii | 2045.97 | 0.00 | 0.35 (0.03) | 3 | 1.38 (0.15) |
| Ru i | 3498.94 | 0.00 | 0.31 (0.02) | 4 | 0.69 (0.15) |
| Pd i | 3404.58 | 0.81 | 0.33 (0.02) | 5 | 0.01 (0.20) |
| Ag i | 3380.68 | 0.00 | 0.02 (0.01) | 6 | 0.35 |
| Ag i | 3382.90 | 0.00 | 0.33 (0.01) | 6 | 0.40 |
| Cd i | 2288.02 | 0.00 | 0.152 (0.013) | 7 | 0.53 (0.20) |
| Cd ii | 2144.39 | 0.00 | 0.018 (0.002) | 1 | 0.07 (0.20) |
| Te i | 2142.82 | 0.00 | 0.32 (0.08) | 8 | 0.44 (0.30) |
| Yb ii | 2116.68 | 0.00 | 1.34 | 9 | 0.26 (0.10) |
| Yb ii | 2126.74 | 0.00 | 0.87 (0.02) | 10 | 0.62 (0.15) |
| Lu ii | 2615.41 | 0.00 | 0.11 (0.04) | 11 | 0.50 (0.20) |
| W ii | 2088.20 | 0.39 | 0.02 (0.02) | 12 | 0.40 |
| W ii | 2118.88 | 0.00 | 0.77 (0.04) | 12 | 0.05 |
| Os ii | 2067.23 | 0.45 | 0.45 (0.03) | 13 | 0.14 (0.20) |
| Os ii | 2282.28 | 0.00 | 0.14 (0.03) | 13 | 0.12 (0.20) |
| Pt i | 2067.51 | 0.00 | 0.62 (0.03) | 14 | 0.24 (0.15) |
| Hg ii | 1942.27 | 0.00 | 0.40 (0.04) | 1 | 0.30 |
| Pb i | 2833.05 | 0.00 | 0.50 (0.02) | 15 | 1.08 (0.30) |
References. — (1) Roederer & Lawler 2012; (2) Holmgren 1975, using HFS from Roederer & Lawler 2012; (3) Sikström et al. 2001; (4) Wickliffe et al. 1994; (5) Xu et al. 2006; (6) Hansen et al. 2012 for both value and HFS; (7) Morton 2000; (8) Roederer et al. 2012a; (9) value from the Database on Rare Earths At Mons University (DREAM), using HFS/IS from Roederer & Lawler 2012; (10) Kedzierski et al. 2010, using HFS from Roederer & Lawler 2012; (11) Roederer et al. 2010, using HFS from Roederer et al. 2012b; (12) Nilsson et al. 2008; (13) Ivarsson et al. 2004; (14) Den Hartog et al. 2005; (15) Biémont et al. 2000, using HFS from Roederer et al. 2012b.
In Section 4.1, we examine whether any abundance trends with wavelength are apparent in Fe i or ii lines. These lines are listed in Table 2. All lines used are included in the Atomic Spectra Database (Kramida et al., 2014) maintained by the National Institute of Standards and Technology (NIST). These lines have values rated with a “C” accuracy or better ( 25%, or 0.12 dex). Table 2 also reports our measurements of the equivalent widths of these lines.
| Species | E.P. | Equiv. Width | |||
|---|---|---|---|---|---|
| (Å) | (eV) | (mÅ) | |||
| Fe i | 2145.19 | 0.05 | 1.56 | 71.4 | 5.17 |
| Fe i | 2294.41 | 0.11 | 1.54 | 92.6 | 5.47 |
| Fe i | 2309.00 | 0.11 | 1.39 | 131.6 | 5.69 |
| Fe i | 2369.46 | 0.11 | 2.19 | 53.0 | 5.26 |
Note. — The complete version of Table 2 is available in the online edition of the journal. A portion is shown here to illustrate its form and content.
3. Methods
3.1. Model Atmospheres
We adopt the model atmosphere parameters for HD 94028 (catalog HD 94028) derived by Roederer (2012), with effective temperature 5720 71 K, surface gravity log g 4.31 0.16, microturbulence velocity 0.90 0.30 km s-1, and metallicity [M/H] 1.62 0.09. The uncertainties are estimated following section 8.5 of Roederer et al. (2014a). The parallax of HD 94028 (catalog HD 94028) is known to better than 5% (measured by Hipparcos; van Leeuwen 2007), and the inferred log g value indicates HD 94028 (catalog HD 94028) is an unevolved main sequence star. Fe ionization equilibrium was not enforced when deriving the model atmosphere parameters. We interpolate the model atmosphere from the ATLAS9 -enhanced grid of Castelli & Kurucz (2003).
3.2. Analysis of NUV Data
We use a recent version of MOOG (Sneden, 1973), which includes the contribution of Rayleigh scattering from atomic H in the source function (Sobeck et al., 2011), to derive the abundances. For all lines in the NUV (except Fe i and ii lines) we use MOOG to generate a series of synthetic spectra where the abundance of the element of interest is adjusted to match the observed spectrum. Our line lists for the syntheses begin with the Kurucz & Bell (1995) lists, and we update wavelengths and values with more recent experimental values whenever possible. Numerous unidentified transitions are found in the NUV spectra of late-type stars, like HD 94028 (catalog HD 94028). Efforts to identify these transitions are underway (Peterson & Kurucz, 2015), and we include the results of these efforts in our line lists. We model the remaining unidentified features using low-excitation Fe i lines.
We include the effects of hyperfine splitting (HFS) structure and isotope shifts (IS) in the syntheses whenever possible. We adopt isotopic mixtures that reflect a predominantly -process origin, using the isotopic distributions presented in Sneden et al. (2008). For Cd ii, the abundance derived using the -process isotopic mix differs from that using the -process mix by 0.14 dex. For Pb i, the abundance derived using the -process isotopic mix differs from that using the -process mix by 0.06 dex. For both Yb ii lines, the -process and -process isotopic mixtures yield identical abundances.
3.3. Re-analysis of Optical and NUV Data
Roederer et al. (2014a) performed a detailed abundance analysis of HD 94028 (catalog HD 94028) using the optical spectrum taken at McDonald Observatory. The model atmosphere parameters adopted by Roederer et al. are sufficiently different ( 5730 K, log g 3.70, 1.00 km s-1, [M/H] 1.81) that we have rederived abundances from all lines examined in that study using the model atmosphere described in Section 3.1. If Roederer et al. reported an equivalent width for a line, we use MOOG to compute a theoretical equivalent width that is forced to match the measured equivalent width by adjusting the input abundance. For all other lines, we use the spectrum synthesis matching technique described in Section 3.2. We also rederive the P abundance from the P i line at 2136 Å, and the result agrees with the value derived by Roederer et al. (2014c). The results of this reanalysis are reflected in the abundances presented in Table 3.
| Spec. | N | [X/Fe] | ||||||
|---|---|---|---|---|---|---|---|---|
| Fe i | 96 | 5.75 | 1.75 | 0.06 | 0.10 | 0.00 | 0.00 | 7.50 |
| Fe ii | 10 | 5.88 | 1.62 | 0.07 | 0.09 | 0.00 | 0.00 | 7.50 |
| Li i | 1 | 2.03 | 0.05 | 0.09 | 0.08 | 0.11 | … | |
| C (CH) | 1 | 6.62 | 0.06 | 0.15 | 0.25 | 0.19 | 0.19 | 8.43 |
| N (CN) | 1 | 7.01 | 0.93 | 7.83 | ||||
| O i | 2 | 7.56 | 0.62 | 0.05 | 0.20 | 0.08 | 0.20 | 8.69 |
| Na i | 2 | 4.57 | 0.08 | 0.12 | 0.22 | 0.14 | 0.23 | 6.24 |
| Mg i | 4 | 6.19 | 0.34 | 0.05 | 0.24 | 0.09 | 0.22 | 7.60 |
| Al i | 1 | 4.78 | 0.08 | 0.13 | 0.34 | 0.19 | 0.37 | 6.45 |
| Si i | 2 | 6.15 | 0.39 | 0.18 | 0.26 | 0.19 | 0.26 | 7.51 |
| P i | 1 | 4.05 | 0.39 | 0.16 | 0.19 | 0.18 | 0.18 | 5.41 |
| K i | 1 | 3.61 | 0.33 | 0.12 | 0.23 | 0.14 | 0.23 | 5.03 |
| Ca i | 10 | 4.94 | 0.35 | 0.10 | 0.25 | 0.14 | 0.25 | 6.34 |
| Sc ii | 6 | 1.71 | 0.18 | 0.05 | 0.13 | 0.20 | 0.09 | 3.15 |
| Ti i | 14 | 3.40 | 0.20 | 0.05 | 0.20 | 0.08 | 0.20 | 4.95 |
| Ti ii | 22 | 3.74 | 0.41 | 0.05 | 0.14 | 0.20 | 0.09 | 4.95 |
| V i | 1 | 2.21 | 0.03 | 0.11 | 0.22 | 0.13 | 0.22 | 3.93 |
| V ii | 2 | 2.57 | 0.26 | 0.19 | 0.23 | 0.28 | 0.20 | 3.93 |
| Cr i | 11 | 3.72 | 0.17 | 0.06 | 0.20 | 0.09 | 0.20 | 5.64 |
| Cr ii | 3 | 4.38 | 0.36 | 0.06 | 0.14 | 0.21 | 0.09 | 5.64 |
| Mn i | 7 | 3.30 | 0.38 | 0.06 | 0.21 | 0.09 | 0.21 | 5.43 |
| Co i | 2 | 3.12 | 0.12 | 0.12 | 0.24 | 0.14 | 0.24 | 4.99 |
| Ni i | 6 | 4.52 | 0.05 | 0.12 | 0.23 | 0.14 | 0.23 | 6.22 |
| Cu i | 1 | 1.96 | 0.48 | 0.13 | 0.15 | 0.15 | 0.24 | 4.19 |
| Cu ii | 4 | 2.30 | 0.27 | 0.10 | 0.14 | 0.13 | 0.12 | 4.19 |
| Zn i | 3 | 3.08 | 0.27 | 0.07 | 0.20 | 0.10 | 0.21 | 4.56 |
| Zn ii | 1 | 3.26 | 0.32 | 0.10 | 0.11 | 0.11 | 0.11 | 4.56 |
| Ge i | 3 | 1.56 | 0.34 | 0.17 | 0.20 | 0.19 | 0.20 | 3.65 |
| As i | 2 | 1.18 | 0.63 | 0.13 | 0.16 | 0.15 | 0.16 | 2.30 |
| Se i | 3 | 2.06 | 0.47 | 0.17 | 0.20 | 0.19 | 0.20 | 3.34 |
| Rb i | 1 | 2.70 | 1.80 | 2.52 | ||||
| Sr ii | 2 | 1.36 | 0.11 | 0.03 | 0.15 | 0.13 | 0.18 | 2.87 |
| Y ii | 3 | 0.68 | 0.09 | 0.09 | 0.15 | 0.21 | 0.11 | 2.21 |
| Zr ii | 3 | 1.53 | 0.57 | 0.05 | 0.14 | 0.20 | 0.09 | 2.58 |
| Nb ii | 1 | 0.94 | 1.10 | 1.46 | ||||
| Mo i | 1 | 0.68 | 0.55 | 0.20 | 0.22 | 0.22 | 0.22 | 1.88 |
| Mo ii | 3 | 1.23 | 0.97 | 0.13 | 0.20 | 0.18 | 0.16 | 1.88 |
| Tc i | 1 | 0.96 | … | |||||
| Ru i | 1 | 0.69 | 0.69 | 0.15 | 0.18 | 0.17 | 0.18 | 1.75 |
| Pd i | 1 | 0.01 | 0.09 | 0.20 | 0.22 | 0.22 | 0.22 | 1.65 |
| Ag i | 1 | 0.40 | 0.15 | 1.20 | ||||
| Cd i | 1 | 0.53 | 0.57 | 0.20 | 0.25 | 0.22 | 0.24 | 1.71 |
| Cd ii | 1 | 0.07 | 0.02 | 0.20 | 0.25 | 0.24 | 0.22 | 1.71 |
| Te i | 1 | 0.44 | 0.01 | 0.31 | 0.33 | 0.33 | 0.33 | 2.18 |
| Ba ii | 3 | 0.88 | 0.32 | 0.05 | 0.13 | 0.19 | 0.09 | 2.18 |
| La ii | 4 | 0.28 | 0.24 | 0.12 | 0.18 | 0.24 | 0.14 | 1.10 |
| Ce ii | 2 | 0.25 | 0.29 | 0.13 | 0.19 | 0.24 | 0.16 | 1.58 |
| Pr ii | 1 | 0.35 | 1.25 | 0.72 | ||||
| Nd ii | 1 | 0.12 | 0.08 | 0.14 | 0.19 | 0.25 | 0.16 | 1.42 |
| Sm ii | 2 | 0.35 | 0.31 | 0.96 | ||||
| Eu ii | 2 | 0.88 | 0.22 | 0.09 | 0.16 | 0.22 | 0.12 | 0.52 |
| Gd ii | 2 | 0.10 | 0.45 | 1.07 | ||||
| Dy ii | 1 | 0.39 | 0.13 | 0.09 | 0.16 | 0.22 | 0.12 | 1.10 |
| Er ii | 2 | 0.05 | 0.65 | 0.92 | ||||
| Tm ii | 2 | 0.95 | 0.57 | 0.10 | ||||
| Yb ii | 3 | 0.46 | 0.24 | 0.19 | 0.20 | 0.20 | 0.20 | 0.92 |
| Lu ii | 1 | 0.62 | 0.90 | 0.20 | 0.25 | 0.24 | 0.22 | 0.10 |
| Hf ii | 2 | 0.15 | 0.92 | 0.85 | ||||
| W ii | 2 | 0.40 | 0.57 | 0.65 | ||||
| Os ii | 2 | 0.13 | 0.35 | 0.14 | 0.15 | 0.15 | 0.15 | 1.40 |
| Ir i | 1 | 1.50 | 1.87 | 1.38 | ||||
| Pt i | 2 | 0.22 | 0.35 | 0.11 | 0.15 | 0.13 | 0.14 | 1.62 |
| Hg ii | 1 | 0.30 | 0.75 | 1.17 | ||||
| Pb i | 1 | 1.08 | 0.79 | 0.30 | 0.32 | 0.32 | 0.32 | 2.04 |
We use the UVES spectrum to derive abundances of additional elements for the first time in HD 94028 (catalog HD 94028). We derive these abundances using the spectrum synthesis method. These lines are listed in Table 2.2.
Roederer et al. (2014a) searched for lines that yielded abundances consistently deviant from the mean abundance of each species. That study defined a set of empirical corrections for these optical lines, listed in their Table 16, and we apply the corrections for metal-poor main sequence stars to our rederived optical abundances when available. These corrections are reflected in the values presented in Table 3.
Finally, we adopt corrections for deviations from local thermodynamic equilibrium (LTE) for a few of the light elements examined: Li (Lind et al., 2009), O (Fabbian et al., 2009), Na (Lind et al., 2011), Al (Andrievsky et al., 2008), and K (Takeda et al., 2002). These corrections are also reflected in the abundances presented in Table 3. We apply no non-LTE corrections for heavy-element abundances. Non-LTE corrections have been derived for individual lines of a few heavier elements in other stars, but published grids—like those available for the light elements noted here—do not yet exist to the best of our knowledge.
4. Results
4.1. Possible Trends with Wavelength
Offsets of varying magnitude between the abundances of lines derived from optical and NUV spectra have been noted in recent years (Roederer et al., 2010, 2012b, 2014b, 2014c; Lawler et al., 2013; Wood et al., 2013, 2014; Placco et al., 2014, 2015; Sneden et al., 2016). These offsets are frequently found by comparing the abundance derived from many Fe i lines at a wide range of wavelengths. The causes of these offsets are not understood at present, but missing sources of continuous opacity and departures from LTE may each be partly responsible.
Our initial list of Fe i and ii lines in the NUV was much longer than the final list presented in Table 2. Lines with obvious blends have been discarded, and lines that yielded abundances deviant by more than 2 from the mean abundance were iteratively culled from the list. Our final list contains 53 Fe i lines and 40 Fe ii lines with wavelengths between 2070 Å and 3100 Å. The list of optical Fe i and ii lines (96 and 10 lines, respectively) is taken from Roederer et al. (2014a) and rederived using the model atmosphere described in Section 3.1.
Figure 1 illustrates our results. The mean abundance derived from the NUV Fe i lines is [Fe/H] 1.94 0.03 ( 0.23), which is moderately lower than that derived from optical Fe i lines, [Fe/H] 1.81 0.01 ( 0.11). The mean abundance derived from the NUV Fe ii lines is [Fe/H] 1.52 0.06 ( 0.38), which is in agreement with that derived from optical Fe ii lines, [Fe/H] 1.57 0.03 ( 0.10). Note that the scatter is considerably larger among the NUV lines, which probably reflects unidentified blends and the challenge of identifying the continuum in the NUV.

If missing continuous opacity is the cause of the small Fe i abundance offset, we would expect a similar offset for all abundances, including those derived from Fe ii lines. No offset is observed in the case of abundances derived from Fe ii lines. If non-LTE or another effect specific to Fe i is the cause of the discrepancy, there is no need to apply a global correction to the abundances derived from lines of other species. Lacking compelling evidence, we do not apply any corrections to the abundances derived from lines in the NUV.
4.2. Heavy Elements in the NUV
Roederer (2012) derived abundances of Ge, As, Se, and Pt in HD 94028 (catalog HD 94028). We expand this inventory to include Cu, As (including one more line), Mo, Ru, Pd, Ag (upper limit only), Cd, Te, Yb, Lu, W (upper limit only), Os, Pt (one more line), Hg (upper limit only), and Pb (one more line). These abundances are listed in Table 3. The [X/Fe] ratios, where X represents a given element, are computed using the Solar reference abundances given in Asplund et al. (2009). All [X/Fe] ratios are constructed using the abundances derived from species in the same ionization state; i.e., neutrals to neutrals and ions to ions. Abundances or ratios denoted with the ionization state are defined to be the total elemental abundance derived from transitions of that ionization state after ionization corrections have been applied.
Table 3 also lists several sets of uncertainties. The statistical uncertainty, , is computed from equation A17 of McWilliam et al. (1995), which includes uncertainties in the equivalent widths or synthesis matching and values. The total uncertainty, , is computed from equation A16 of McWilliam et al., which includes the statistical uncertainty and uncertainties in the model atmosphere parameters. The other two uncertainties listed in Table 3 are computed from approximations of equations A19 and A20 of McWilliam et al., which give uncertainties in the abundance ratios. To calculate the uncertainty in the ratio of two elements A and B, , we recommend that for element A be added in quadrature with for element B when element B is derived from lines of neutral species. Similarly, we recommend that for element A be added in quadrature with for element B when element B is derived from lines of ionized species.
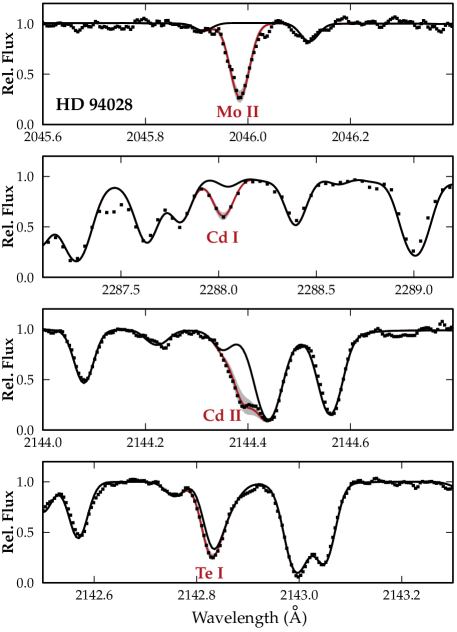
The Te i line at 2142.822 Å is extremely blended with an Fe i line at 2142.832 Å, as shown in Figure 2. The value of the blending Fe i line is unconstrained by experiment. We follow our earlier work on HD 160617 (catalog HD 160617) (Roederer & Lawler, 2012) and attempt to fit the overall line profile using the abundance of Te and the value of the Fe i line as free parameters in the fit. The value favored by our best fit, 2.7, is moderately different than the value favored by our best fit in HD 160617 (catalog HD 160617), 3.1. We attribute only a small fraction of the absorption at this wavelength to Te i, and the line has little sensitivity to the Te abundance, thus we caution that the Te abundance derived from this line is highly uncertain.
The abundance derived from the Lu ii line at 2615.41 Å is higher than would be expected based on the abundances of neighboring elements Yb and Hf (Section 5.2). We have no reason to discount our Lu measurement, shown in Figure 3, but we caution that it is derived from a single line. Other observations of the Lu ii line at 2615 Å would be useful to diagnose any unidentified systematics.
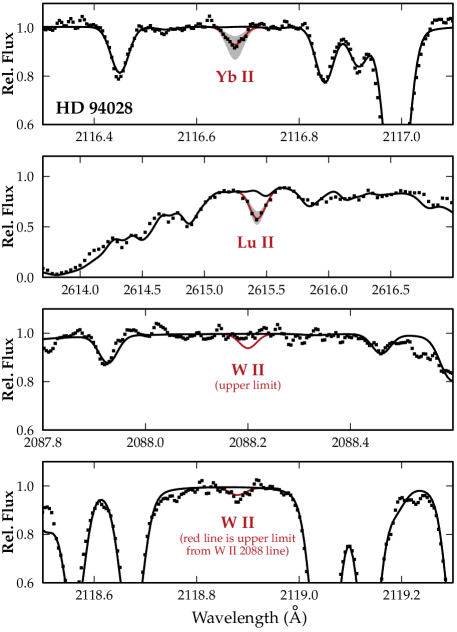
Figure 3 illustrates the two lines of W ii that we have examined. We do not detect absorption coincident with the W ii line at 2088.02 Å, and we derive an upper limit from this line. We do, however, detect absorption coincident with the W ii line at 2118.88 Å. The upper limit derived from the former line is inconsistent with the absorption detected at the latter. The red line shown in the bottom panel of Figure 3 is the 3 upper limit inferred from the line in the third panel of Figure 3, not a fit to the line shown. We conclude that the absorption detected at 2118.88 Å is not due to W ii, so we derive only an upper limit on the W abundance.
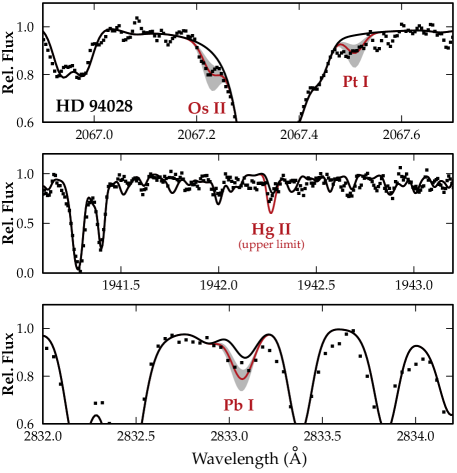
The Hg ii line at 1942.27 Å presents an interesting case. Absorption is clearly detected at this wavelength, but as shown in Figure 4, our syntheses provide a poor fit to the spectral region surrounding this line. The S/N here is low ( 10–15). Other hints of absorption at 1941.61 Å, 1941.84 Å, 1941.96 Å, 1942.43 Å, 1942.66 Å, and 1942.90 Å correspond to 12C16O transitions. Fe ii may also contribute to the absorption at 1942.99 Å. These absorption features also appear in a spectrum of HD 160617 (catalog HD 160617) of similar quality, so they are likely to be real lines and not noise. Another 12C16O transition of comparable strength is predicted at 1942.27 Å, which coincides with the Hg ii line. Our syntheses fail to adequately reproduce the strengths and the wavelengths of these CO lines. The absorption at 1942.27 Å is slightly stronger than the other predicted CO lines, so Hg ii might be present here; however, we advise against attempts to derive an abundance from this blended, noisy line. The upper limit on Hg that we report in Table 2.2 is based on the entire absorption feature at 1942.27 Å resulting from an -process isotopic mixture of Hg ii.
4.3. Multiple Species of Cu, Zn, Mo, and Cd
With access to the NUV spectrum of HD 94028 (catalog HD 94028), we have now detected both the neutral and singly-ionized states of Cu, Zn, Mo, and Cd. Both states give abundances in agreement for Cu and Zn. [Mo ii/Fe] is higher than [Mo i/Fe] by 0.42 0.28 dex, and [Cd ii/Fe] is lower than [Cd i/Fe] by 0.59 0.33 dex. Roederer et al. (2014b) derived [Cd/Fe] ratios from Cd i and ii lines in two stars, and in both cases they agreed.
Peterson (2011) derived abundances in HD 94028 (catalog HD 94028) using the same STIS spectra we have used. All abundance ratios in common with Peterson are in excellent agreement. The surprising result of her study was an enhanced [Mo/Fe] ratio in HD 94028 (catalog HD 94028), 1.0, which we confirm, 0.97 0.16. Both results are derived from Mo ii lines in the NUV. When one optical Mo i line is used, the [Mo/Fe] ratio is lower by a little more than 1, [Mo/Fe] 0.55 0.22. Roederer & Lawler (2012) and Roederer et al. (2014b) derived [Mo/Fe] ratios from neutral and ionized lines in two stars, and in all cases the [Mo/Fe] ratios derived from different species agreed.
We suggest that the differences for [Cd/Fe] and [Mo/Fe] reflect the difficult nature of deriving abundances from small numbers of lines in crowded spectral regions. Ideally, these ratios should be examined in larger samples of stars to identify potential systematic effects. In the subsequent discussion, we adopt the abundances derived from neutral lines for Zn, ionized lines for Cu and Mo, and the average of the two for Cd.
5. Discussion
5.1. AGB Models
Substantial portions of some of the heaviest elements—like Ba, Ce, and Pb—may be produced by the process in a star (or stars) that passed through the thermally-pulsing AGB (TP-AGB) phase of evolution. The process occurs in the He-intershell, where freshly synthesized elements are brought to the surface by recurrent mixing episodes. Convection also dredges up lighter elements such as C and F, which are produced together with the process (see reviews by Herwig, 2005; Karakas & Lattanzio, 2014).
We use the low-metallicity AGB evolution and nucleosynthesis models from Karakas et al. (2014) and Shingles et al. (2015). These models were calculated with an initial metallicity of ([Fe/H] ), which is close to the derived metallicity of HD 94028 (catalog HD 94028). The models cover a range in mass from 1.7, with a lifetime of 1.4 Gyr, to 6, with a lifetime of 61 Myr. The low-mass models ( 3) require a pocket for the formation of -process elements, and the predicted distribution at these low metallicities is peaked at Ba and Pb (Busso et al., 2001; Travaglio et al., 2004). In contrast, the He-intershells of the intermediate-mass models ( 3) are hot enough to ignite the e(,)g reaction more efficiently. This typically produces elements at the first -process peak near Rb and Sr.
Many uncertainties affect the AGB model predictions, including mass loss and convection. The AGB phase is terminated by mass loss, which also therefore determines the maximum enrichment. AGB stars in low-metallicity environments show similar mass-loss rates to AGB stars in our Galaxy (Sloan et al., 2009; Lagadec et al., 2009). We use the Vassiliadis & Wood (1993) mass-loss rate, which has an implicit metallicity dependence in that the equation for the pulsation period depends on the radius. More thermal pulses are predicted for the lower metallicity models (e.g., Karakas, 2014) compared with models at solar metallicity. This may indicate that our mass-loss rates may be too low for most of the AGB phase. Reducing the AGB lifetime would decrease the number of mixing episodes and would lower the yields of C and -process elements. The treatment of convection and non-convective mixing processes is also uncertain. We refer to Karakas & Lattanzio (2014) for a detailed discussion, but we note that including extra mixing in the envelopes of precursor low-mass AGB stars may lower the final yield of C.
5.2. Comparison with AGB Nucleosynthesis Predictions
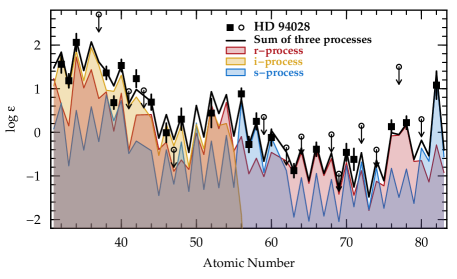
We illustrate the heavy element abundance pattern in HD 94028 (catalog HD 94028) in Figure 5. Most heavy elements, X, are only moderately overabundant, with 0 [X/Fe] 1. We compare this pattern with six sets of low-metallicity ([Fe/H] 1.4) AGB nucleosynthesis yields, with 0.24, taken from Karakas et al. (2014) and Shingles et al. (2015). Several example fits are shown. To create the fits shown in Figure 5, we mix the final ejected AGB yields with an -process “foundation” of material (e.g., Bisterzo et al. 2012; Lugaro et al. 2012). Nearly all metal-poor stars contain some -process material (e.g., Roederer 2013), and we assume that HD 94028 (catalog HD 94028) also inherited -process material from its natal cloud. We refer to this -process material as the -process foundation.
The pattern of the -process abundance foundation is inferred by a two step process. We begin by adopting the solar -process residual pattern. This pattern is suspect for elements below the second -process peak, so we modify it for 32 34 and 38 48. The modifications are made using abundances from the metal-poor -process-enhanced star HD 108317 (catalog HD 108317) (Roederer et al., 2012b, 2014b). In other words, each modified element X is normalized to Eu in the -process residual pattern using the X/Eu ratio in HD 108317 (catalog HD 108317).

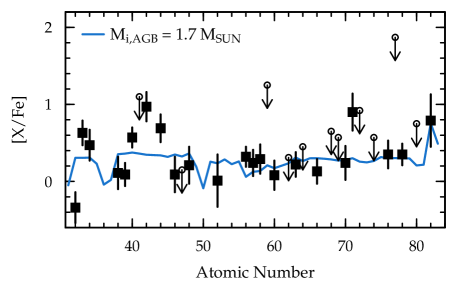
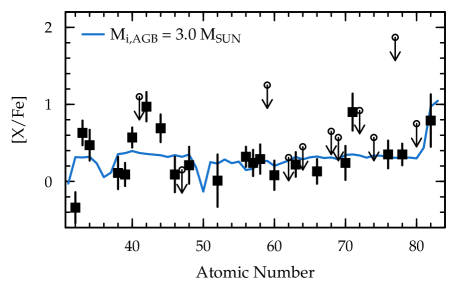
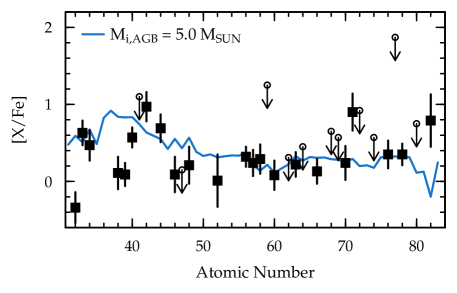
We adjust the relative proportions of the -process foundation and the -process material by eye to provide reasonable fits to the observed abundance pattern. These proportions are well constrained by the elements beyond the second -process peak, many of which are predominantly produced by only one of the two processes. Elements whose production is dominated by the process (e.g., Eu, Dy, Pt) are reasonably fit by scaling up the -process foundation by a factor of two relative to HD 108317 (catalog HD 108317). Dilution factors for the -process material range from 1.2% for the 1.7 model to 16% for the 6.0 model. In other words, only a small percentage of the -process material ejected by the AGB models is incorporated into HD 94028 (catalog HD 94028). We cannot reproduce the overall shape of the abundance pattern using any combination of -process and -process curves for the 4.0, 5.0, and 6.0 AGB models. As shown for the 5.0 model, the first -process peak is over-produced by 0.2 to 0.8 dex, and the Pb abundance is under-produced by 1.0 dex. The lower-mass AGB models provide better fits for most elements.
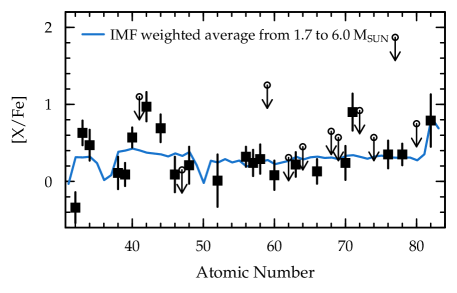
A fourth panel in Figure 5 illustrates a scenario in which HD 94028 (catalog HD 94028) is assumed to have acquired its -process material from its natal cloud. In this case, the -process contribution to the model curve shown reflects the yields of AGB stars from 1.7 to 6.0 , weighted by their relative numbers in a Salpeter (1955) IMF and the ejected Ba mass. The dilution of the integrated -process yields in this case is 1.8%. This also provides a reasonable fit for most abundances, which is not surprising since the low-mass AGB stars dominate by number and total mass of -process material ejected per star.
5.3. Possible Nucleosynthesis Scenarios
Our Ge, As, Mo, Ru, Ag, and Lu predictions deviate from the - and -process fits by more than 1.5 times the observational uncertainties. No model or combination of models can simultaneously reproduce the enhanced [Zr/Fe], [Mo/Fe], and [Ru/Fe] ratios and the solar [Sr/Fe], [Y/Fe], [Pd/Fe], [Ag/Fe], and [Cd/Fe] ratios. The super-solar [As/Ge] ratio, 0.99 0.23 dex, is also incompatible with -process nucleosynthesis or any reasonable combination of -process and -process material. The use of the un-modified -process residuals does not improve the fit for these elements, particularly in the Sr–Ru mass region. In this section, we investigate and exclude several nucleosynthesis processes as the sources of these ratios.
The [As/Ge] 0.99 and [Se/As] 0.16 ratios effectively exclude several possible scenarios. These are not compatible with the classical weak process and different types of neutron-rich neutrino wind components in core-collapse supernovae (CCSNe; e.g., Fröhlich et al. 2006; Farouqi et al. 2009; Roberts et al. 2010; Arcones & Montes 2011). This signature is also not found in earlier electron-capture SN simulations (e.g., Hoffman et al. 2008; Wanajo et al. 2009). More recent two-dimensional hydrodynamic explosion models of electron-capture SNe also produce [As/Ge] 1 (Wanajo et al., 2011a). Models for nucleosynthesis in proton-rich neutrino wind components predict a large scatter among the relative ratios of Ge, As, and Se, and the integrated [(GeAsSe)/Fe] ratio in CCSN ejecta is not often available (e.g., Kratz et al. 2008; Roberts et al. 2010; Arcones & Montes 2011; Wanajo et al. 2011b; Arcones et al. 2012). Previously, most studies have focused on the Sr–Ag mass region (e.g., Hansen et al. 2012). Now that observational data are available for metal-poor stars, we recommend checking whether possible combinations of neutrino-driven wind components could explain the observed ratios in the Ge–Se mass region. Another scenario that could be explored is the neutrino-induced process in the He-shell of CCSNe, where neutrons are made by the interaction between neutrinos and He nuclei (Banerjee et al., 2011).
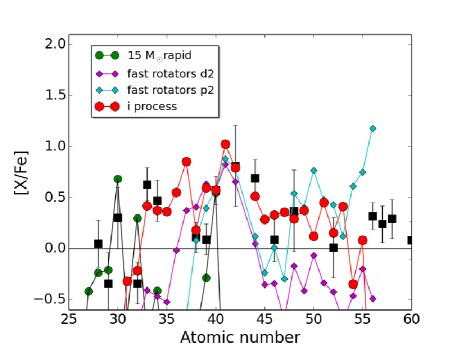
The -rich freezeout component is made in the deepest ejecta of CCSNe (e.g., Woosley & Hoffman 1992). It is thought to be the main source of 64Zn in the solar system and Zn in the early Galaxy (e.g., Nomoto et al. 2013). In Figure 6, we compare the abundances in HD 94028 (catalog HD 94028) with the products of a 15 CCSN model by Pignatari et al. (2013), which includes -rich freezeout ejecta. The progenitor structure was computed using the stellar code GENEC (Eggenberger et al., 2008), and the CCSN explosion simulations include the fallback prescription “rapid” according to Fryer et al. (2012). The predictions are inconsistent with the observations. The -rich freezeout component in these models mainly produces Zn, Ge, and Zr, and the production of As is negligible. These yields are affected by many uncertainties, including the details of the explosion, fallback, and progenitor mass. The ability to predict the relative production of elements in different mass regions (e.g., Zn and Zr) is limited. Predictions for neighboring elements produced in similar conditions should be more reliable, and the enhanced [As/Ge] ratio found in HD 94028 (catalog HD 94028) is inconsistent with theoretical predictions for the -rich freezeout (Woosley & Hoffman, 1992).
The AGB yields discussed in Section 5.2 all predict 0.2 [As/Ge] 0.0. The low [As/Ge] predictions are mainly due to the local -capture cross sections in the Ge–As mass region along the -process path. As is not made efficiently due to the relatively high 75As(,)76As cross section (e.g., Dillmann et al. 2008; Marganiec et al. 2009). This conclusion is independent of the stellar source of the process or stellar uncertainties affecting the -process production at low metallicity (e.g., Gallino et al. 1998; Straniero et al. 2006; Bisterzo et al. 2012; Lugaro et al. 2012; Karakas & Lattanzio 2014). In other words, the nuclear physics limits the amount of As that the process can make.
The process in fast-rotating massive stars has been proposed as one of the possible scenarios to explain a sample of old, metal-poor stars with enhanced Sr, Y, and Zr (e.g., Pignatari et al. 2008; Frischknecht et al. 2012). The boosted process at low metallicity is due to the primary production of 14N and 22Ne, and 22Ne is the main neutron source in these stellar models. In Figure 6, we compare the abundances in HD 94028 (catalog HD 94028) with two models of fast-rotating massive stars by Pignatari et al. (2008), using the 22Ne(,)25Mg rate multiplied and divided by a factor of 2 (see discussion in Pignatari et al. 2008 for details). The abundance pattern is not compatible with the observations in HD 94028 (catalog HD 94028). In particular, the models cannot reproduce the [Mo/Ru] ratio, and they do not efficiently produce elements in the Ge–As region. The [As/Ge] ratio is sub-solar for both models, as expected for an -process source.
5.4. The -process Contribution
A scenario that may be compatible with the observed abundance pattern among the lighter -capture elements in HD 94028 (catalog HD 94028) is the process (Cowan & Rose, 1977). The process is a -capture process triggered by the rapid ingestion of a substantial quantity of H in He-burning convective regions. H is captured by 12C to produce 13N. The 13N decays to 13C, and the 13C(,)16O reaction is efficiently activated. The conditions leading to -process nucleosynthesis may be found in multiple stellar sites, including super-AGB and post-AGB stars, He-core and He-shell flashes in low-metallicity low-mass stars, and massive stars.
The H-ingestion episodes that activate the process are quite different from those that form the 13C pockets in AGB stars. 13C pockets form when a small amount of H is mixed into the He-burning region on timescales of 102 yr, comparable to the timescale for dredge-up episodes, which lead to neutron densities cm-3. The key for the process is that the neutron density is governed by the interplay of two coincidentally similar timescales (see Herwig et al. 2011 for more details). The first is the convective turn-over timescale of 10–20 min, where the ingested H is advected into deeper and hotter layers of the He-burning convection zone. 13N is released when the timescale of the 12C(,)13N reaction equals this convective mixing timescale. The second is the decay timescale of 13N, 9.6 min, which limits how fast 13C can be produced. Generally speaking, the robustness of the -process neutron density is based on the universal nature of these timescales, which ensure that a neutron density cm-3 is produced whenever H is ingested into He-burning driven convection.
In contrast, the neutron exposure does change from one -process site to another, since the -process conditions are inherently three-dimensional and hydrodynamic in nature. The 12C(,)13N reaction releases large amounts of energy that affect the convective flow. Present models (Herwig et al., 2014) indicate that the star responds with a global oscillation of shell H-ingestion. Its non-spherical nature implies that the stellar response to the energy release from H-ingestions cannot be known from spherically-symmetric simulations alone. Hydrodynamic simulations indicate that the stellar response may be violent, and it is possible that the hydrodynamic feedback will terminate the conditions suitable for the process. This termination would be different for each site (e.g., low-mass AGB stars, post-AGB stars, or super-AGB stars). The result would be nucleosynthetic signatures that share a common intermediate neutron density but differ substantially in neutron exposure. For example, we observe overabundances at and beyond Ba in some CEMP-/ stars, suggestive of an process with a large neutron exposure (Dardelet et al., 2015). We observe a significant enhancement of first-peak elements in post-AGB stars, suggestive of an process with a lower neutron exposure (Herwig et al., 2011).
These three-dimensional hydrodynamical models can be used to inform one-dimensional stellar models (Herwig et al., 2011; Stancliffe et al., 2011; Herwig et al., 2014; Woodward et al., 2015) and calculations involving the -process products (e.g., Cristallo et al. 2009; Herwig et al. 2011; Bertolli et al. 2013). Bertolli et al. provided an -process trajectory to explore the main properties of this process. This one-zone trajectory has, by design, the same neutron density that we associate with convective ingestion of H into a He-burning layer. We use this trajectory and assume a stellar metallicity of [Fe/H] 2 to calculate a set of -process abundance ratios. Figure 6 shows the results of this calculation. We adjust the conditions (neutron exposure and termination time) to maximize production in the As–Mo region. These conditions also produce super-solar [As/Ge] ratios, and production drops beyond Te. The -process fit is not perfect. For example, it over-produces Y compared to the observations. This is a simple trajectory, and more comprehensive models will be necessary to verify or refute this scenario. Nevertheless, the process provides a scenario that can simultaneously explain the [As/Ge] and [Se/As] ratios and the enhancement in Mo and Ru.
5.5. Light Elements
The elements with 30 in HD 94028 (catalog HD 94028) are all normal when compared with other main sequence or subgiant stars with similar metallicity. This material presumably originated in prior generations of CCSNe.
The AGB models discussed in Section 5.2 also indicate that significant amounts of light elements (C to P, 6 15) are produced. The light and heavy elements produced by AGB stars should have the same dilution factor when material is transferred to HD 94028 (catalog HD 94028) or its natal cloud. The dilution factors derived in the fits to the heavy elements are so small ( 2%) that any contributions from the AGB stars to N, O, Na, Mg, Al, Si, and P are negligible ([X/Fe] 0.03 dex) when compared with the material produced in CCSNe.
The [C/Fe] ratio, 0.06 0.19, tells a different story. This ratio is in agreement with the mean [C/Fe] ratio for main sequence and subgiant stars with [Fe/H] 2, [C/Fe] 0.12 (e.g., Gratton et al. 2000; Roederer et al. 2014a). Our low-mass and IMF-weighted models over-predict the [C/Fe] ratio for HD 94028 (catalog HD 94028) by 0.4 dex after dilution. In other words, a self-consistent enrichment scenario for the C and -process material in HD 94028 (catalog HD 94028) would predict that HD 94028 (catalog HD 94028) is mildly C-enhanced, whereas no C enhancement is observed.
This discrepancy is not resolved by shortcomings of our model atmosphere. Comparisons of [C/Fe] ratios derived from CH lines in one- and three-dimensional model atmosphere calculations of metal-poor dwarfs reveal large discrepancies (Asplund, 2004; Behara et al., 2010). They indicate that one-dimensional models overestimate the [C/Fe] ratio, however, so this is unlikely to be the source of the discrepancy.
Our [C/Fe] ratio is in agreement with previous analyses of CH molecular bands in HD 94028 (catalog HD 94028). Gratton et al. (2000) derived [C/Fe] 0.07 0.09, Simmerer et al. (2004) derived [C/Fe] 0.05 0.2, and Lai et al. (2007) derived [C/Fe] 0.05 0.17. Tomkin et al. (1992) examined both CH and C i features in HD 94028 (catalog HD 94028), finding that [C/Fe] 0.2 0.15 from the molecular lines, 0.32 0.09 from the atomic lines (assuming LTE), and 0.28 0.09 from the atomic lines (assuming non-LTE). They found offsets between the CH and C i abundance indicators in other stars in their sample, but the results from the atomic lines showed a dependence on . Tomkin et al. suggested that the abundances derived from the C i lines were too high and affected by a systematic error. We conclude that [C/Fe] is not enhanced above the solar ratio in HD 94028 (catalog HD 94028), so the tension with our AGB model predictions stands.
The degree of the C discrepancy could be reduced if extra mixing occurs in the envelopes of low-mass AGB stars, as discussed in Section 5.1. Alternatively, the discrepancy could be resolved if no AGB stars contributed to HD 94028 (catalog HD 94028). This seems unlikely, however, since the elements at the second and third -process peaks are enhanced.
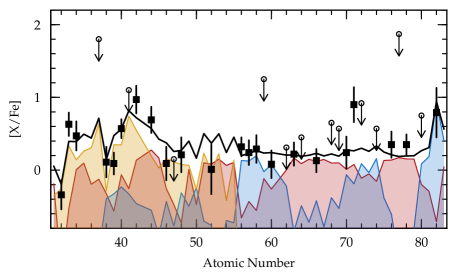
5.6. The Enrichment of HD 94028
In this section, we explore scenarios where the -capture abundances in HD 94028 (catalog HD 94028) result from the combined contributions of the , , and processes. These are illustrated in Figure 7. The agreement is superb for most elements, and only Y, Pd, and Lu deviate by 2. The process contributes the largest share for most elements with 50 in HD 94028 (catalog HD 94028). An inferior fit is obtained if we omit any -process contribution to the elements lighter than Te. Using the un-modified -process residuals over-predicts the [Ge/Fe] and [As/Fe] ratios but has no substantial impact on Se or the Sr–Ru region. The -process contribution is still required regardless of whether we use the modified or un-modified -process pattern. The heaviest elements ( 56) owe their origin only to the process and process. The process dominates the production of elements near the rare-earth and third peaks, while the process dominates the production of the light rare-earth elements and Pb.


Is HD 94028 (catalog HD 94028) a single star, or does it have an unseen white dwarf companion? HD 94028 (catalog HD 94028) shows no compelling evidence of radial velocity variations; measurements by Latham et al. (2002) span more than 5100 d and have an rms of only 0.64 km s-1. If, however, there is a companion and the system is observed face-on, it would also show no radial velocity variations.
Is the presence of -process material evidence that HD 94028 (catalog HD 94028) must be in a binary system with a white dwarf companion? Casagrande et al. (2011) derived an age of HD 94028 (catalog HD 94028) of 12.35 Gyr (7.5 to 13.8 Gyr at 95% confidence intervals) from comparison with Padova and BASTI isochrones. The longest-lived AGB star considered in Sections 5.1 and 5.2 has a lifetime of 1.4 Gyr. Such stars could have formed, evolved through the TP-AGB phase, and polluted the ISM before HD 94028 (catalog HD 94028) was born. In other words, the presence of -process material does not require a more-evolved companion star for HD 94028 (catalog HD 94028).
We are unable to exclude either the single-star or binary system scenarios. We expect that HD 94028 (catalog HD 94028) acquired its -process material from its natal cloud. The -process and -process material may have also been present in the natal cloud or added later by a companion.
5.7. The -process in Other Stars in the Early Galaxy
Evidence for the process has been observed in the post-AGB star known as Sakurai’s object (V4334 Sgr (catalog V4334 Sgr); Herwig et al. 2011) and in presolar grains found in pristine meteorites (Fujiya et al., 2013; Jadhav et al., 2013; Liu et al., 2014). There are hints that the process may also be responsible for some of the abundance patterns observed in young open clusters (Mishenina et al., 2015), the CEMP- stars (Dardelet et al., 2015; Jones et al., 2016), and low-mass post-AGB stars in the Magellanic Clouds (Lugaro et al., 2015).
Our observations may be generalized to suggest that super-solar [As/Ge] and solar or sub-solar [Se/As] ratios could signal the operation of the process in the early Galaxy. These are a common feature in the nine metal-poor stars analyzed by Roederer (2012) and Roederer et al. (2012b, 2014b). The [As/Ge] ratios range from 0.65 to 1.00 in five stars with 2.5 [Fe/H] 0.5. [As/Ge] is constrained to be 0.75 in two other stars, and only upper limits (1.34) are available for two more. The [Se/As] ratios in these stars range from 0.53 to 0.54 with a mean of 0.10. The observational uncertainties on these ratios are typically 0.3–0.4 dex for [As/Ge] and 0.3–0.7 dex for [Se/As], which reflects the challenge of measuring absorption lines in the crowded regions of the NUV spectrum.
No non-LTE calculations exist for Ge i, As i, or Se i lines in late-type stars. Ge has a lower first ionization potential (7.90 eV) than As (9.79 eV) or Se (9.75 eV). If overionization occurs, it is more likely to preferentially affect Ge i lines. This would reduce the [As/Ge] ratios. Non-LTE corrections for other species with low first ionization potentials are typically 0.1–0.2 dex and rarely exceed 0.5 dex (e.g., Takeda et al. 2005; Bergemann et al. 2012; Yan et al. 2015) in late-type stars, however. We conclude that it is unlikely that non-LTE effects can produce solar or sub-solar [As/Ge] ratios in these stars.
Peterson (2011) pointed out that the enhanced [Mo/Fe] ratios found in HD 94028 (catalog HD 94028) and HD 160617 (catalog HD 160617) were uncommon. Subsequent data support this assertion. Mo was detected in 30 of the 311 metal-poor stars examined by Roederer et al. (2014b). Two of those 30 stars are highly enriched in -process material (CS 22892–052 (catalog BPS CS 22892-052) and CS 31082–001 (catalog BPS CS 31082-001)), and they are not representative of the majority of metal-poor stars. Among the remaining 28 stars, none show [Mo/Fe] 0.6. Similarly, in the sample of stars with [Fe/H] 1 examined by Hansen et al. (2014), only 4 of the 34 stars with detected Mo show [Mo/Fe] 0.6. In contrast, super-solar [As/Ge] and solar or sub-solar [Se/As] ratios appear common, at least among the limited metal-poor stars where Ge, As, and Se have been studied. This contrast may illustrate the diverse paths leading to -process nucleosynthesis.
6. Conclusions
We have performed a detailed abundance analysis of elements detectable in the NUV and optical spectra (1885–8000 Å) of the metal-poor main sequence star HD 94028 (catalog HD 94028). We have derived abundances of many trace elements that are rarely studied in late-type stars. Our analysis reveals that several of these elements, including Ge, As, Se, and Mo, hold important—and previously unrecognized—clues necessary to identify the -capture processes responsible for creating the heavy elements observed in HD 94028 (catalog HD 94028) and other metal-poor stars.
We find that no combination of -process and -process material can fully account for the abundances of elements from Ge to Pb in HD 94028 (catalog HD 94028). Some -process material is clearly present, as revealed by the rare earth elements and third -process peak. The -process pattern observed among other elements from Ba to Pb favors relatively low-mass AGB stars ( 1.7 or so), although it is difficult to reconcile this with the solar [C/Fe] ratio observed in HD 94028 (catalog HD 94028). Including the contributions from another -capture process, the process, improves the fit for elements from Ge to Te. This is necessary to fit the super-solar [As/Ge], solar or sub-solar [Se/As], and enhanced [Mo/Fe] and [Ru/Fe] ratios. We exclude scenarios involving the classical weak process, -rich freezeout in CCSNe, and the process in fast-rotating massive stars. Other explosive-nucleosynthesis components in CCSNe and in electron-capture SNe need to be tested in detail for this mass region to verify which scenarios are compatible and which can be ruled out.
Our analysis establishes a new constraint for stellar nucleosynthesis. These are the crucial questions: what are the nucleosynthesis conditions that lead to super-solar [As/Ge] and solar or sub-solar [Se/As] ratios, and can some scenarios be excluded? The Ge-As-Se mass region has never been a focus of detailed analysis of the different neutrino-wind nucleosynthesis components because of a lack of observations. The impact of internal stellar dynamics and nuclear uncertainties also need to be considered. Here, our preliminary results indicate that the process may be a good candidate to explain these abundance patterns.
References
- Andrievsky et al. (2008) Andrievsky, S. M., Spite, M., Korotin, S. A., et al. 2008, A&A, 481, 481
- Arcones & Montes (2011) Arcones, A., Montes, F. 2011, ApJ, 731, 5
- Arcones et al. (2012) Arcones, A., Fröhlich, C., Martínez-Pinedo, G. 2012, ApJ, 750, 18
- Asplund (2004) Asplund M. 2004, Mem. Soc. Astron. Italiana, 75, 300
- Asplund et al. (2009) Asplund, M., Grevesse, N., Sauval, A. J., Scott, P. 2009, ARA&A, 47, 481
- Ayres (2010) Ayres, T. R. 2010, ApJS, 187, 149
- Banerjee et al. (2011) Banerjee, P., Haxton, W. C., Qian, Y.-Z. 2011, Phys. Rev. Lett., 106, 201104
- Barbuy et al. (2011) Barbuy, B., Spite, M., Hill, V., et al. 2011, A&A, 534, A60
- Behara et al. (2010) Behara, N. T., Bonifacio, P., Ludwig, H.-G., et al. 2010, A&A, 513, A72
- Bergemann et al. (2012) Bergemann, M., Hansen, C. J., Bautista, M., & Ruchti, G. 2012, A&A, 546, A90
- Bertolli et al. (2013) Bertolli, M. G., Herwig, F., Pignatari, M., Kawano, T. 2013, arXiv:1310.4578
- Biémont et al. (2000) Biémont, E., Garnir, H. P., Palmeri, P., Li, Z. S., Svanberg, S. 2000, MNRAS, 312, 116
- Bisterzo et al. (2012) Bisterzo, S., Gallino, R., Straniero, O., Cristallo, S., K appeler, F. 2012, MNRAS, 422, 849
- Busso et al. (2001) Busso, M., Gallino, R., Lambert, D. L., Travaglio, C., Smith, V. V. 2001, ApJ, 557, 802
- Casagrande et al. (2011) Casagrande, L., Schönrich, R., Asplund, M., et al. 2011, A&A, 530, A138
- Carney et al. (1994) Carney, B. W., Latham, D. W., Laird, J. B., Aguilar, L. A. 1994, AJ, 107, 2240
- Castelli & Kurucz (2003) Castelli, F., Kurucz, R. L. Proc. IAU Symp. No 210, Modelling of Stellar Atmospheres, N. Piskunov et al., eds. 2003, A20
- Clementini et al. (1999) Clementini, G., Gratton, R. G., Carretta, E., Sneden, C. 1999, MNRAS, 302, 22
- Cowan & Rose (1977) Cowan, J. J., Rose, W. K. 1977, ApJ, 212, 149
- Cowan et al. (1996) Cowan, J. J., Sneden, C., Truran, J. W., Burris, D. L. 1996, ApJ, 460, L115
- Cowan et al. (2002) Cowan, J. J., Sneden, C., Burles, S., et al. 2002, ApJ, 572, 861
- Cowan et al. (2005) Cowan, J. J., Sneden, C., Beers, T. C., et al. 2005, ApJ, 627, 238
- Cristallo et al. (2009) Cristallo, S., Piersanti, L., Straniero, O., et al. 2009, Pub. Astron. Soc. Australia, 26, 139
- Dardelet et al. (2015) Dardelet, L., Ritter, C., Prado, P., et al. 2015, Proceedings of Science, Nuclei in the Cosmos XIII, 145 (arXiv:1505.05500)
- Dekker et al. (2000) Dekker, H., D’Odorico, S., Kaufer, A., Delabre, B., Kotzlowski, H. 2000, Proc. SPIE, 4008, 534
- Den Hartog et al. (2005) Den Hartog, E. A., Herd, M. T., Lawler, J. E., et al. 2005, ApJ, 619, 639
- Dillmann et al. (2008) Dillmann, I., Plag, R., Heil, M., Käppeler, F., Rauscher, T. 2008, Proceedings of Science, Nuclei in the Cosmos IX, 90 (arXiv:0806.2016)
- Eggenberger et al. (2008) Eggenberger, P., Meynet, G., Maeder, A., et al. 2008, Ap&SS, 316, 43
- Fabbian et al. (2009) Fabbian, D., Asplund, M., Barklem, P. S., Carlsson, M., Kiselman, D. 2009, A&A, 500, 1221
- Farouqi et al. (2009) Farouqi, K., Kratz, K.-L., Mashonkina, L. I., et al. 2009, ApJ, 694, L49
- Frischknecht et al. (2012) Frischknecht, U., Hirschi, R., Thielemann, F.-K. 2012, A&A, 538, L2
- Fröhlich et al. (2006) Fröhlich, C., Hix, W. R., Martínez-Pinedo, G., et al. 2006, New Astron. Rev., 50, 496
- Fryer et al. (2012) Fryer, C. L., Belczynski, K., Wiktorowicz, G., et al. 2012, ApJ, 749, 91
- Fujiya et al. (2013) Fujiya, W., Hoppe, P., Zinner, E., Pignatari, M., Herwig, F. 2013, ApJ, 776, L29
- Gallino et al. (1998) Gallino, R., Arlandini, C., Busso, M., et al. 1998, ApJ, 497, 388
- Gratton et al. (2000) Gratton, R. G., Sneden, C., Carretta, E., Bragaglia, A. 2000, A&A, 354, 169
- Hansen et al. (2012) Hansen, C. J., Primas, F., Hartman, H., et al. 2012, A&A, 545, A31
- Hansen et al. (2014) Hansen, C. J., Andersen, A. C., Christlieb, N. 2014, A&A, 568, A47
- Herwig (2005) Herwig, F. 2005, ARA&A, 43, 435
- Herwig et al. (2011) Herwig, F., Pignatari, M., Woodward, P. R., et al. 2011, ApJ, 727, 89
- Herwig et al. (2014) Herwig, F., Woodward, P. R., Lin, P.-H., Knox, M., Fryer, C. 2014, ApJ, 792, L3
- Hoffman et al. (2008) Hoffman, R. D., Müller, B., Janka, H.-T. 2008, ApJ, 676, L127
- Holmgren (1975) Holmgren, L. 1975, Phys. Scr, 11, 15
- Ivarsson et al. (2004) Ivarsson, S., Wahlgren, G. M., Dai, Z., Lundberg, H., Leckrone, D. S. 2004, A&A, 425, 353
- Jacobson et al. (2014) Jacobson, H. R., Thanathibodee, T., Frebel, A., et al. 2014, ApJ, 796, LL24
- Jadhav et al. (2013) Jadhav, M., Pignatari, M., Herwig, F., et al. 2013, ApJ, 777, L27
- Jasniewicz & Mayor (1988) Jasniewicz, G., Mayor, M. 1988, A&A, 203, 329
- Jones et al. (2016) Jones, S., Ritter, C., Herwig, F., et al. 2016, MNRAS, 455, 3848
- Karakas (2014) Karakas, A. I. 2014, MNRAS, 445, 347
- Karakas & Lattanzio (2014) Karakas, A. I. Lattanzio, J. C. 2014, Publ. Astron. Soc. Aust., 31, 30
- Karakas et al. (2014) Karakas, A. I., Marino, A. F., Nataf, D. M. 2014, ApJ, 784, 32
- Kedzierski et al. (2010) Kedzierski, D., Kusz, J., Muzolf, J. 2010, Spectrochimica Acta B, 65, 248
- Kimble et al. (1998) Kimble, R. A., Woodgate, B. E., Bowers, C. W., et al. 1998, ApJ, 492, L83
- Kramida et al. (2014) Kramida, A., Ralchenko, Y., Reader, J., and the NIST ASD Team. 2014, NIST Atomic Spectra Database (v. 5.2), online, URL: http://physics.nist.gov/asd
- Kratz et al. (2008) Kratz, K.-L., Farouqi, K., Mashonkina, L. I., Pfeiffer, B. 2008, New Astron. Rev., 52, 390
- Kurucz & Bell (1995) Kurucz, R. L., Bell, B. 1995, Kurucz CD-ROM, Cambridge, MA: Smithsonian Astrophysical Observatory
- Lagadec et al. (2009) Lagadec, E., Zijlstra, A. A., Sloan, G. C., et al. 2009, MNRAS, 396, 598
- Lai et al. (2007) Lai, D. K., Johnson, J. A., Bolte, M., Lucatello, S. 2007, ApJ, 667, 1185
- Latham et al. (2002) Latham, D. W., Stefanik, R. P., Torres, G., et al. 2002, AJ, 124, 1144
- Lawler et al. (2013) Lawler, J. E., Guzman, A., Wood, M. P., Sneden, C., Cowan, J. J. 2013, ApJS, 205, 11
- Lind et al. (2009) Lind, K., Asplund, M., Barklem, P. S. 2009, A&A, 503, 541
- Lind et al. (2011) Lind, K., Asplund, M., Barklem, P. S., Belyaev, A. K. 2011, A&A, 528, A103
- Liu et al. (2014) Liu, N., Savina, M. R., Davis, A. M., et al. 2014, ApJ, 786, 66
- Lucatello et al. (2005) Lucatello, S., Tsangarides, S., Beers, T. C., et al. 2005, ApJ, 625, 825
- Lugaro et al. (2012) Lugaro, M., Karakas, A. I., Stancliffe, R. J., Rijs, C. 2012, ApJ, 747, 2
- Lugaro et al. (2015) Lugaro, M., Campbell, S. W., Van Winckel, H., et al. 2015, A&A, 583, A77
- Marganiec et al. (2009) Marganiec, J., Dillmann, I., Pardo, C. D., et al. 2009, Phys. Rev. C, 79, 065802
- McWilliam et al. (1995) McWilliam, A., Preston, G. W., Sneden, C., Searle, L. 1995, AJ, 109, 2757
- Mishenina et al. (2015) Mishenina, T., Pignatari, M., Carraro, G., et al. 2015, MNRAS, 446, 3651
- Morton (2000) Morton, D. C. 2000, ApJS, 130, 403
- Nilsson et al. (2008) Nilsson, H., Engström, L., Lundberg, H., et al. 2008, Eur. Phys. J. D, 49, 13
- Nomoto et al. (2013) Nomoto, K., Kobayashi, C., Tominaga, N. 2013, ARA&A, 51, 457
- Peterson (2011) Peterson, R. C. 2011, ApJ, 742, 21
- Peterson & Kurucz (2015) Peterson, R. C., Kurucz, R. L. 2015, ApJS, 216, 1
- Pignatari et al. (2008) Pignatari, M., Gallino, R., Meynet, G., et al. 2008, ApJ, 687, L95
- Pignatari et al. (2013) Pignatari, M., Herwig, F., Hirschi, R., et al. 2013, arXiv:1307.6961
- Placco et al. (2013) Placco, V. M., Frebel, A., Beers, T. C., et al. 2013, ApJ, 770, 104
- Placco et al. (2014) Placco, V. M., Beers, T. C., Roederer, I. U., et al. 2014, ApJ, 790, 34
- Placco et al. (2015) Placco, V. M., Beers, T. C., Ivans, I. I., et al. 2015, ApJ, 812, 109
- Primas et al. (1999) Primas, F., Duncan, D. K., Peterson, R. C., Thorburn, J. A. 1999, A&A, 343, 545
- R Core Team (2014) R Core Team, 2014. “R: A language and environment for statistical computing,” R Foundation for Statistical Computing, Vienna, Austria. URL http://www.R-project.org/.
- Roberts et al. (2010) Roberts, L. F., Woosley, S. E., Hoffman, R. D. 2010, ApJ, 722, 954
- Roederer et al. (2009) Roederer, I. U., Kratz, K.-L., Frebel, A., et al. 2009, ApJ, 698, 1963
- Roederer et al. (2010) Roederer, I. U., Sneden, C., Lawler, J. E., Cowan, J. J. 2010, ApJ, 714, L123
- Roederer et al. (2012a) Roederer, I. U., Lawler, J. E., Cowan, J. J., et al. 2012a, ApJ, 747, L8
- Roederer & Lawler (2012) Roederer, I. U., Lawler, J. E. 2012, ApJ, 750, 76
- Roederer (2012) Roederer, I. U. 2012, ApJ, 756, 36
- Roederer et al. (2012b) Roederer, I. U., Lawler, J. E., Sobeck, J. S., et al. 2012b, ApJS, 203, 27
- Roederer (2013) Roederer, I. U. 2013, AJ, 145, 26
- Roederer et al. (2014a) Roederer, I. U., Preston, G. W., Thompson, I. B., et al. 2014a, AJ, 147, 136
- Roederer et al. (2014b) Roederer, I. U., Schatz, H., Lawler, J. E., et al. 2014b, ApJ, 791, 32
- Roederer et al. (2014c) Roederer, I. U., Jacobson, H. R., Thanathibodee, T., Frebel, A., Toller, E. 2014c, ApJ, 797, 69
- Roman (1954) Roman, N. G. 1954, AJ, 59, 307
- Salpeter (1955) Salpeter, E. E. 1955, ApJ, 121, 161
- Shingles et al. (2015) Shingles, L. J., Doherty, C. L., Karakas, A. I., et al. 2015, MNRAS, 452, 2804
- Sikström et al. (2001) Sikström, C. M., Pihlemark, H., Nilsson, H., et al. 2001, Journal of Physics B Atomic Molecular Physics, 34, 477
- Simmerer et al. (2004) Simmerer, J., Sneden, C., Cowan, J. J., et al. 2004, ApJ, 617, 1091
- Siqueira Mello et al. (2013) Siqueira Mello, C., Spite, M., Barbuy, B., et al. 2013, A&A, 550, A122
- Sloan et al. (2009) Sloan, G. C., Matsuura, M., Zijlstra, A. A., et al. 2009, Science, 323, 353
- Sneden (1973) Sneden, C. A. 1973, Ph.D. Thesis, Univ. of Texas at Austin
- Sneden et al. (1998) Sneden, C., Cowan, J. J., Burris, D. L., Truran, J. W. 1998, ApJ, 496, 235
- Sneden et al. (2003) Sneden, C., Cowan, J. J., Lawler, J. E., et al. 2003, ApJ, 591, 936
- Sneden et al. (2008) Sneden, C., Cowan, J. J., Gallino, R. 2008, ARA&A, 46, 241
- Sneden et al. (2016) Sneden, C., Cowan, J. J., Kobayashi, C. 2016, ApJ, in press (arXiv:1511.05985)
- Sobeck et al. (2011) Sobeck, J. S., Kraft, R. P., Sneden, C., et al. 2011, AJ, 141, 175
- Stancliffe et al. (2011) Stancliffe, R. J., Dearborn, D. S. P., Lattanzio, J. C., Heap, S. A., Campbell, S. W. 2011, ApJ, 742, 121
- Straniero et al. (2006) Straniero, O., Gallino, R., Cristallo, S. 2006, Nuclear Physics A, 777, 311
- Stryker et al. (1985) Stryker, L. L., Hesser, J. E., Hill, G., Garlick, G. S., Okeefe, L. M. 1985, PASP, 97, 247
- Takeda et al. (2002) Takeda, Y., Zhao, G., Chen, Y.-Q., Qiu, H.-M., Takada-Hidai, M. 2002, PASJ, 54, 275
- Takeda et al. (2005) Takeda, Y., Hashimoto, O., Taguchi, H., et al. 2005, PASJ, 57, 751
- Thorburn & Hobbs (1996) Thorburn, J. A., Hobbs, L. M. 1996, AJ, 111, 2106
- Tomkin et al. (1992) Tomkin, J., Lemke, M., Lambert, D. L., Sneden, C. 1992, AJ, 104, 1568
- Travaglio et al. (2004) Travaglio, C., Gallino, R., Arnone, E., et al. 2004, ApJ, 601, 864
- van Leeuwen (2007) van Leeuwen, F. 2007, A&A, 474, 653
- Vassiliadis & Wood (1993) Vassiliadis, E., Wood, P. R. 1993, ApJ, 413, 641
- Wanajo et al. (2009) Wanajo, S., Nomoto, K., Janka, H.-T., Kitaura, F. S., Müller, B. 2009, ApJ, 695, 208
- Wanajo et al. (2011a) Wanajo, S., Janka, H.-T., Müller, B. 2011a, ApJ, 726, L15
- Wanajo et al. (2011b) Wanajo, S., Janka, H.-T., Kubono, S. 2011b, ApJ, 729, 46
- Wickliffe et al. (1994) Wickliffe, M. E., Salih, S., Lawler, J. E. 1994, J. Quant. Spec. Radiat. Transf., 51, 545
- Wood et al. (2013) Wood, M. P., Lawler, J. E., Sneden, C., Cowan, J. J. 2013, ApJS, 208, 27
- Wood et al. (2014) Wood, M. P., Lawler, J. E., Sneden, C., Cowan, J. J. 2014, ApJS, 211, 20
- Woodgate et al. (1998) Woodgate, B. E., Kimble, R. A., Bowers, C. W., et al. 1998, PASP, 110, 1183
- Woodward et al. (2015) Woodward, P. R., Herwig, F., Lin, P.-H. 2015, ApJ, 798, 49
- Woosley & Hoffman (1992) Woosley, S. E., Hoffman, R. D. 1992, ApJ, 395, 202
- Xu et al. (2006) Xu, H. L., Sun, Z. W., Dai, Z. W., et al. 2006, A&A, 452, 357
- Yan et al. (2015) Yan, H. L., Shi, J. R., & Zhao, G. 2015, ApJ, 802, 36