EVN Observations of HESS J1943+213: Evidence for an Extreme TeV BL Lac Object
Abstract
We report on the 1.6 GHz (18 cm) VLBI observations of the unresolved, steady TeV source HESS J1943+213 located in the Galactic plane, performed with the European VLBI Network (EVN) in 2014. Our new observations with a nearly full EVN array provide the deepest image of HESS J1943+213 at the highest resolution ever achieved, enabling us to resolve the long-standing issues of the source identification. The milliarcsecond-scale structure of HESS J1943+213 has a clear asymmetric morphology, consisting of a compact core and a diffuse jet-like tail. This is broadly consistent with the previous e-EVN observations of the source performed in 2011, and re-analyzed in this work. The core component is characterized by the brightness temperature of K, which is typical for low-luminosity blazars in general. Overall, radio properties of HESS J1943+213 are consistent with the source classification as an “extreme high-frequency-peaked BL Lac object”. Remarkably, we note that since HESS J1943+213 does not reveal any optical or infrared signatures of the AGN activity, it would never be recognized and identified as a BL Lac object, if not its location close to the Galactic plane where the High Energy Stereoscopic System has surveyed, and the follow-up dedicated X-ray and radio studies triggered by the source detection in the TeV range. Our results suggest therefore a presence of an unrecognized, possibly very numerous population of particularly extreme HBLs, and simultaneously demonstrate that the low-frequency VLBI observations with high-angular resolution are indispensable for a proper identification of such objects.
1 Introduction
A variety of very-high-energy (VHE; GeV) -ray sources have been discovered in the Galactic plane by recent systematic surveys with the High Energy Stereoscopic System (H.E.S.S.; Carrigan et al., 2013). The majority of these sources are Galactic objects with extended structures such as supernova remnants (SNRs), evolved pulsar wind nebulae (PWNe), or molecular clouds. Unresolved or point-like H.E.S.S. sources in the Galactic plane have been identified with Galactic high-mass X-ray binaries (HMXBs), or young PWNe (e.g., Crab Nebula). On the other hand, outside of the Galactic plane, the vast majority of the unresolved -ray sources are radio-loud active galactic nuclei (AGNs). More than 50 AGNs have been detected in VHE -ray regime so far, which are mostly blazars of the BL Lacertae type (hereafter BL Lacs)111http://tevcat.uchicago.edu.
The unresolved, steady TeV source HESS J1943+213 (henceforth J1943+213) was discovered in the Galactic plane with three-years H.E.S.S. observations between 2005 and 2008 (Abramowski et al., 2011). The nature of J1943+213 is puzzling and subjected to an ongoing debate. It is located within the error circle of an unidentified hard X-ray INTEGRAL source IGR J19443+2117, which was also seen with ROSAT, Chandra and Swift (Tomsick et al., 2009; Landi et al., 2009; Cusumano et al., 2010). Abramowski et al. (2011) discussed in detail the AGN and PWN identification of J1943+213 and, based on the gathered multi-wavelength data, concluded that the most likely classification of the source is that of an “extreme high-frequency-peaked BL Lac object” (“extreme HBL” for short).
On the other hand, following-up radio observations with optically-connected stations in European VLBI Network (e-EVN mode) revealed a compact radio counterpart to the TeV emitter, J1943+2113 (Gabányi et al., 2013, henceforth GDG13). GDG13 reported non-detection of signals on the longest baselines between European stations and the African station at Hartebeesthoek (Hh), indicative of a source extension on milliarcsecond-scale. This, along with the derived low brightness temperature, argued against the blazar identification. Leahy & Tian (2012) reported the HI absorption spectrum indicating the source distance exceeding 16 kpc. However, it is not conclusive evidence for its extragalactic origin, since it can still be a PWN at a distance of 17 kpc (GDG13).
Recently, new X-ray observations of J1943+213 with Suzaku have been reported by Tanaka et al. (2014, hereafter TSF14), who re-analyzed also the infrared data for the source from the WISE and UKIDSS surveys, as well as the Fermi Large Area Telescope (Fermi/LAT) data integrated over 4.5 years (yielding the GeV flux upper limits improved over those derived in Abramowski et al. 2011). The best-quality X-ray spectrum revealed a single power-law continuum extending up to 25 keV, with a moderate absorption in excess of the Galactic value. Moreover, the re-analyzed infrared data have been found to be consistent with the presence of a luminous elliptical host located at the luminosity distance of Mpc. All these findings, together with the broad-band modeling of the source spectral energy distribution (SED) performed by TSF14 in the framework of the extreme HBL scenario, supported the blazar identification of J1943+213. This was further substantiated by Peter et al. (2014), who carried-out near-infrared imaging of the host candidate with the CAHA telescope, and also reported the source detection in the accumulated five-year-long Fermi/LAT dataset. Note that Straal et al. (2016) have recently reported on the Arecibo observations failing to uncover the putative pulsar powering the PWN, again supporting the extreme HBL scenario.
The small-scale radio structure of J1943+213 is the remaining key puzzle in the discussion regarding the nature of the source. Although the previous high-sensitivity e-EVN observations have enabled to successfully detect and locate the radio counterpart to J1943+213, the corresponding spatial resolution and imaging sensitivity were rather limited by poor coverages due to the lack of other EVN stations and hour-angle coverages. More sensitive observations at higher angular resolution are therefore indispensable for a proper characterization of the source at radio frequencies.
In this Letter, we report on the new EVN observations of J1943+213, combined with the re-analysis of the e-EVN data taken in 2011 (from GDG13). Our new EVN observations with nearly full array provide the deepest image of the radio structure of J1943+213 on milliarcsecond scales at the highest achievable resolution.
2 Observations and Data Reductions
2.1 2011 observations
We reduced the archival e-EVN data for J1943+213 at 1.6 GHz, which were presented before in GDG13. Observations were performed with seven telescopes, as summarized in Table 1, at a recording rate of 1024 Mbit s-1 on May 2011 for h. The total bandwidth was 128 MHz per polarization.
Initial calibrations were performed in the Astronomical Image Processing System (AIPS). The visibility amplitudes were calibrated in the AIPS task APCAL based on the system temperature and aperture efficiency measured at each station.
We found that non-detections of fringes on the longest baselines from European telescopes to the Hh station in Africa reported in GDG13 are not owing to the extended structure. GDG13 performed phase-reference VLBI observations towards J1943+213, since the source position was highly uncertain, and calibrated the data with the EVN pipeline222http://www.evlbi.org/pipeline/user_expts.html. In the pipeline processing, the visibility phase was calibrated with the nearby phase calibrator J1946+2300. We found that no fringes were detected on Hh baselines for J1946+2300 in the pipeline calibrations, because the source structure is resolved out in long baselines. This would be the reason why GDG13 missed the fringes also in the case of J1943+213, where the fringe-search solutions of J1946+2300 were applied.

| Date | Frequency | Obs Code | Stations | Beam Size | Beam PA | Peak Intensity | Image rms |
|---|---|---|---|---|---|---|---|
| (yyyy-dd-mm) | (GHz) | (mas) | (∘) | (mJy beam-1) | (Jy beam-1) | ||
| 2011-05-18 | 1.664 | RSG03 | Jb Wb Ef On Tr Mc Hh | 33.12.03 | 83.9 | 18.2 | 64 |
| 2014-11-02 | 1.658 | EA056B | Jb Wb Ef On Sh Tr Sv Zc Bd Hh | 3.48 | 85.4 | 19.9 | 12 |
In this work, fringe fitting was directly applied to J1943+213 in the AIPS task FRING, after removing phase, delay and rate offsets due to the source positional error by correcting its coordinate to measured in GDG13 with the AIPS task CLCOR. We successfully detected fringes directly even on the Hh baselines with reliable signal-to-noise ratios (S/Ns).
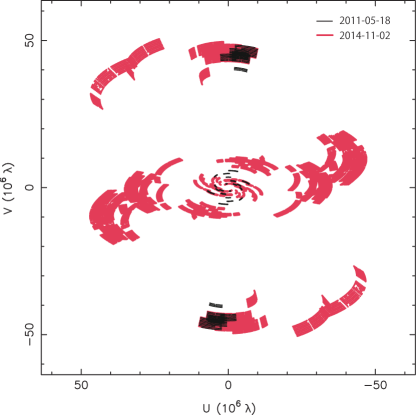
Data were averaged for the integration time of 30 s, and then self-calibrated in the package Difmap. The resultant uv-coverage is shown in Fig. 1. The imaging fidelity and spatial resolution are limited by the relatively poor coverage, due to the lack of intermediate/long baselines in the east-west direction and short hour-angle coverages (see §3 for details). Thus, we conducted following-up observations with EVN at 1.6 GHz in 2014 as described in the next subsection.
2.2 2014 observations
We conducted EVN observations at 1.6 GHz in November 2014. Observations were performed with 10 telescopes summarized in Table 1 at a recording rate of 1024 Mbit s-1 for h. The total bandwidth was 128 MHz per polarization.
We used pipeline-calibrated data sets. In the pipeline calibration, the visibility amplitudes were calibrated in the AIPS task APCAL based on the system temperature and aperture efficiency measured at each station. Fringe fitting was directly applied to J1943+213 in the AIPS task FRING. The fringe was robustly detected in all the stations with reliable S/Ns, consistently with the 2011 observations.
Data were averaged for the integration time of 30 s, and self-calibrated in Difmap. The resultant coverage, shown in Fig. 1, was significantly improved by involving Russian and East Asian stations, and also by a wider hour-angle coverages.
3 Results
3.1 2011 observations
We have successfully detected fringes on long baselines between Europe and the Hh station in Africa by reducing the data manually. The correlated flux density is typically mJy for these baselines (Fig. 2), which is indeed brighter than the typical baseline sensitivity of 6.6 mJy between the Effelsberg station and the Hh station333http://www.evlbi.org/user_guide/base_sens.html. Note that the newly detected correlated flux density is much larger than that following from the best-fit single Gaussian model with a FWHM size of 15.8 mas (as reported in GDG13), and hence J1943+213 appears more compact in the re-analyzed dataset.
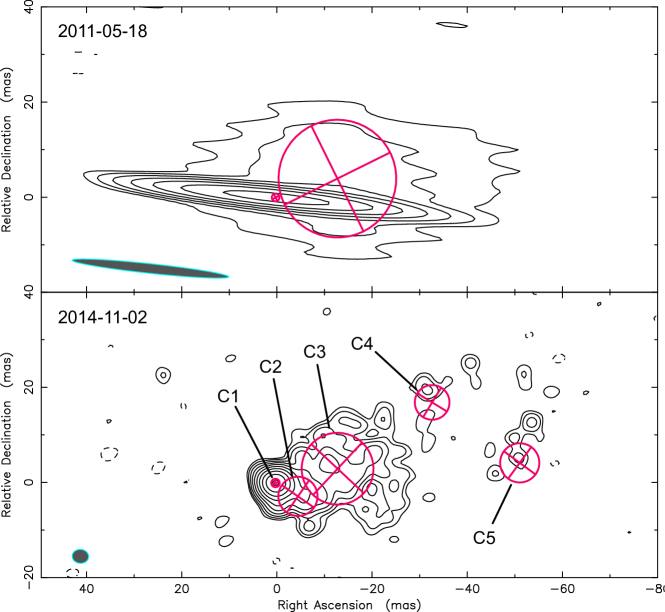
Despite a rather limited coverage (see Fig. 1 and 2), the visibility of J1943+213 can well be modeled with the DIFMAP command modelfit assuming two circular Gaussians components with different sizes. The best-fit model image is shown in Fig. 3, and its fit to the visibility amplitude in Fig. 2. The model image has a core–jet-like structure elongated in the north-west direction. The total flux density is mJy, which is broadly consistent with mJy reported in GDG13.
3.2 2014 observations
Fringes were successfully detected on all the stations throughout the whole observational time. The correlated flux density is typically mJy on long baselines to the Hh station (see Fig. 2) in a good agreement with the 2011 observations.
We show the uniform-weighted CLEAN image in Fig. 3. The image clearly reveal a one-side core–jet morphology typical of blazars, with a compact core and a diffuse emission extending to the west/north-west from the core, consistently with the re-analyzed 2011 e-EVN data. The total flux density of the source is 42 mJy. The source structure can well be modeled with five circular Gaussian components, for which the corresponding parameters are given in Table 2; the best-fit model is also shown in Fig. 3. The positions and sizes of the core component (C1) and the brightest jet feature (C3) are broadly consistent with those resulting from the two-component model applied to the re-analyzed 2011 data. Note that we derived estimates of the 1 uncertainties of each parameter from one-third of its confidence interval using the percentile Bootstrap method (see Akiyama et al., 2013) with data-sets re-sampled from observational data444Note that the errors are purely statistical and then do not include the systematic errors caused by residual calibration gains that are practically difficult to be estimated only with single-epoch observations. Hence, the realistic uncertainties could be larger than estimated values, although it does not affect results and discussions of this Letter..
| ID | Total Flux | Position | FWHM | Brightness | |
|---|---|---|---|---|---|
| Density | RA | Dec | size | Temperture | |
| (mJy) | (mas) | (mas) | (mas) | (K) | |
| C1 | 0 | 0 | |||
| C2 | |||||
| C3 | |||||
| C4 | |||||
| C5 | |||||
Importantly, due to the fact that the source appears more compact in the new EVN data (and also in the re-analyzed e-EVN data) than reported previously, also the source brightness temperature is higher than that derived in GDG13. In particular, from the standard formula55footnotemark: 5
where , , and / are the flux density, observation frequency, and the major-/minor-axis size of the beam or of the Gaussian component, respectively (e.g. Akiyama et al., 2015), we find the peak brightness temperature of K for the peak intensity of the image 19.9 mJy beam-1. Note that since the core component is only marginally resolved, as shown in Fig. 3 (see also Table 2), the corresponding uncertainties in the derived value of are relatively large; still, the peak value of K corresponds to the safe lower limit for the source brightness temperature. 555Here we ignore the redshift-correction factor , due to the anticipated source distance of Mpc only (following TSF14), noting that this particular choice does not affect the main results or conclusions presented in this Letter.
Previous surveys of BL Lacs found typical peak intensities of a few to 100 mJy beam-1 at 8 GHz (Liuzzo et al., 2013, hereafter LGG13) and 10-100 mJy beam-1 at 1.6 GHz (Giroletti et al., 2006), corresponding to the brightness temperatures of K. Recently, Piner & Edwards (2014) reported typical peak brightness temperatures of K for the analyzed sample of 20 BL Lac objects detected at TeV photon energies. The peak intensity and peak brightness temperature derived here for J1943+213 are therefore consistent with those characterizing BL Lacs in general, and TeV BL Lacs in particular.
On the other hand, the other components in the J1943+213 jet are fairly resolved, with the corresponding brightness temperature of K, again in agreement to what is observed in other BL Lac objects (Giroletti et al., 2006; Piner & Edwards, 2014). We also note that the brightness temperatures of all our Gaussian components are anyway much larger than the brightness temperatures of K and K at 1.4 GHz measured for the paradigmatic PWNe Crab (Bietenholz & Kronberg, 1991) and 3C 58 (Bietenholz, 2006).
4 Discussion
Our new observations provide a very strong, basically even conclusive evidence for the blazar identification of the enigmatic TeV emitter J1943+213: the milliarcsecond-scale structure of the source displays a core–jet morphology and a high brightness temperature, both of which are characteristic of HBLs as a class (and at the same time inconsistent with radio properties of Galactic PWNe).
4.1 J1943+213 as an extreme HBL
Extreme HBLs form a peculiar sub-class of BL Lac objects, with intrinsic (i.e., corrected for the absorption on the extragalactic background light) TeV spectra equivalent to, or even harder than . Such spectra, in the framework of conventional one-zone synchrotron-self-Compton (SSC) models widely applied to broad-band SEDs of TeV BL Lacs (e.g. Kino et al., 2002), requires rather extreme physical conditions within blazar emitting zones, and in particular very high jet bulk Lorentz factors, , weak jet magnetic fields, mG, and very high minimum energies of ultra-relativistic jet electrons, (see, e.g., Katarzyński et al., 2006; Tavecchio et al., 2009, 2010). Indeed, , mG, and have been estimated by TSF14 from the one-zone SSC modeling of the broad-band spectrum of J1943+213. We note that up to now only about 10 extreme HBLs are known.
Our observations reveal also a very low “X-ray defined radio-loudness” of J1943+213, which is however comparable to those characterizing other extreme HBLs, with typical X-ray-to-radio flux ratios of, roughly, (e.g. Bonnoli et al., 2015). We measure the J1943+213 core flux spectral energy density of 26.1 mJy, which corresponds to the monochromatic energy flux of erg cm-2 s-1. Meanwhile, the Suzaku 0.5–25 keV spectrum of the source (TSF14) extrapolated down to lower photon energies, returns erg cm-2 s-1. These result in , providing yet another evidence in support of the blazar identification of J1943+213.
Two-epoch VLBI observations with EVN do not show significant flux variations, which might be consistent with previous X-ray and TeV -ray observations showing no time variability at X-ray and TeV bands (Shahinyan & VERITAS collaboration, 2015). Although the statistical errors of the total flux are small ( errors are 0.09 mJy and 0.02 mJy for 2011 and 2015 data, respectively), if we adopt typical a-priori calibration errors of % for EVN (e.g. Bondi et al., 1994), the total flux densities of mJy in 2014 and 34 mJy in 2011 are mostly consistent within . However, a flux density of mJy was recently reported on e-MERLIN observations at 1.5 GHz in 2013 December and 2014 June (Gabanyi et al., 2015), which would be an evidence for the flux variation combined with our data (Straal et al., 2016). Since all of four VLBI observations were performed with quite different -coverages and arrays, more homogeneous observations will be necessary to conclusively confirm the flux variations.
We remark that, since the source is close to the Galactic plane, the flux variation in radio regimes can be extrinsic due to the interstellar scintillation (e.g. Akiyama & Johnson, 2016). For instance, the refractive scale of the interstellar scintillation at the source region is 2.81 mas at 1.6 GHz estimated from the NE2001 model666http://www.nrl.navy.mil/rsd/RORF/ne2001/ (Cordes & Lazio, 2002, 2003), which is comparable to the FWHM size of the radio core. This suggests that a source with the angular size of mas can be modulated by refractive interstellar scattering, and therefore the radio core can be extrinsically scintillated (see Akiyama & Johnson, 2016, for details).
4.2 The source compactness and core dominance
It is instructive to evaluate the source compactness (SC; e.g. LGG13) and the core dominance (CD; Liuzzo et al., 2009) of J1943+213, for a direct comparison with other BL Lacs. The SC is defined as a ratio of total flux densities (or powers) measured on milliarcsecond and arcsecond scales. On the other hand, the CD is the ratio between the observed core radio power and the expected core radio power estimated from the umbeamed total radio power at lower frequencies, based on the relation given in Giovannini et al. (1994). The CD is a good proxy of the jet Doppler factor for blazar sources.
The total flux density of J1943+213 on arcsecond scales at 1.4 GHz, as measured with the NRAO VLA Sky Survey (NVSS), is mJy, giving the SC of . Adopting the source distance of 600 Mpc, as advocated in TSF14, the total radio power of J1943+213 on milliarcsecond and arcsecond scales reads as W Hz-1 and W Hz-1, respectively. The unbeamed core radio power is estimated to be W Hz-1, assuming the average spectrum index of 0.7 between 408 MHz and 1.4 GHz, following LGG13. This gives the CD of 30.
The estimated SC and CD are in the range of typical values found for blazars, where the VLBI scale core flux density is strongly enhanced by the Doppler beaming (LGG13). Moreover, they are qualitatively consistent with the large Doppler factor inffered from the one-zone SSC model applied by TSF14 to the SED of J1943+213. This again supports the blazar identification of the source, and implies that there is nothing unusual about it as long as small-scale radio properties are considered.
4.3 A new population of unrecognized BL Lacs?
J1943+213 has been detected with H.E.S.S. at TeV photon energies only because it happened to be located close to the Galactic plane, and as such it was covered by the H.E.S.S. Galactic Plane Survey. Note in this context that till now no systematic TeV survey has been carried out at high Galactic latitudes by the currently operating Cherenkov telescopes. At the same time, the source is very weak in the GeV range, so that it could be detected (at a marginal level and in a limited energy range) only after five years of the accumulation of the all-sky Fermi/LAT data. The serendipitous H.E.S.S. discovery has triggered the follow-up X-ray (TSF14), near-infrared (Peter et al., 2014), and high-resolution radio (GDG13, this Letter) observations, which enabled to identify the source as a blazar of the “extreme HBL” type. Remarkably, at optical and infrared frequencies, J1943+213 lacks any signatures of an AGN activity. In other words, if not the particular location of J1943+213 on the sky, this object would never be recognized, targeted, and classified as a blazar the first place.
The question is if J1943+213 is an anomaly/outliers in the diverse blazar population, or if it represents possibly quite numerous population of previously unrecognized, particularly extreme HBLs. Since H.E.S.S. found this source over the 1224 deg2 survey (Carrigan et al., 2013), one can expect sources detectable with a sensitivity of existing Chelenkov telescopes over the whole sky, which are already three times larger than the known population of extreme HBLs. This relevant question can be addressed in the near future only by performing a systematic survey of nearby and seemingly “quiet” elliptical galaxies with hard X-ray satellites (NuSTAR, ASTRO-H), high-resolution radio interferometers (VLBI), and sensitive TeV telescopes (Cherenkov Telescope Array).
5 Conclusion
Here we present the new EVN observations of HESS J1943+213 at 1.6 GHz. Our results provide a very strong, basically even conclusive evidence for the blazar identification of this enigmatic TeV emitter:
-
1.
Our high-resolution radio maps reveal that the milliarcsecond-scale structure of J1943+213 displays a clear core–jet morphology, which is typically seen in low-luminosity blazars. The brightness temperatures of the core and other small-scale jet components are consistent with those established for the TeV-emitting BL Lacs as well, and at the same time inconsistent with radio properties of Galactic PWNe.
-
2.
Careful re-analysis of previous e-EVN observations performed in 2011 (GDG13) provides a robust fringe detections on long baselines. The obtained source structure is broadly consistent with our new observations.
-
3.
The radio source compactness, radio core dominance and the X-ray–to–radio flux ratio characterizing J1943+213, are all in agreement to what is observed in other extreme HBLs, and are indicative of a significant Doppler beaming shaping radio appearance of the source on milliarcsecond scales.
As such, J1943+213 — which lack any optical/infrared signatures of an AGN activity — may be either an outliers in the diverse blazar population, or a member of a numerous population of previously unrecognized, particularly extreme HBLs. Regardless of this, our and GDG13 results demonstrate that the low-frequency VLBI observations with high-angular resolution are in general indispensable for a proper identification of extragalactic -ray emitters.
References
- Abramowski et al. (2011) Abramowski, A., Acero, F., Aharonian, F., et al. 2011, A&A, 529, A49
- Akiyama & Johnson (2016) Akiyama, K., & Johnson, M. D. 2016, submitted to ApJ, arXiv:1603.04880
- Akiyama et al. (2013) Akiyama, K., Takahashi, R., Honma, M., Oyama, T., & Kobayashi, H. 2013, PASJ, 65, arXiv:1308.6657
- Akiyama et al. (2015) Akiyama, K., Lu, R.-S., Fish, V. L., et al. 2015, ApJ, 807, 150
- Bietenholz (2006) Bietenholz, M. F. 2006, ApJ, 645, 1180
- Bietenholz & Kronberg (1991) Bietenholz, M. F., & Kronberg, P. P. 1991, ApJ, 368, 231
- Bondi et al. (1994) Bondi, M., Mantovani, F., Sherwood, W., Tzioumis, A., & Venturi, T. 1994, A&AS, 103
- Bonnoli et al. (2015) Bonnoli, G., Tavecchio, F., Ghisellini, G., & Sbarrato, T. 2015, MNRAS, 451, 611
- Carrigan et al. (2013) Carrigan, S., Brun, F., Chaves, R. C. G., et al. 2013, ArXiv e-prints, arXiv:1307.4690
- Cordes & Lazio (2002) Cordes, J. M., & Lazio, T. J. W. 2002, ArXiv Astrophysics e-prints, astro-ph/0207156
- Cordes & Lazio (2003) —. 2003, ArXiv Astrophysics e-prints, astro-ph/0301598
- Cusumano et al. (2010) Cusumano, G., La Parola, V., Segreto, A., et al. 2010, A&A, 510, A48
- Gabanyi et al. (2015) Gabanyi, K. E., Dubner, G., Giacani, E., Frey, S., & Paragi, Z. 2015, ArXiv e-prints, arXiv:1504.03800
- Gabányi et al. (2013) Gabányi, K. É., Dubner, G., Giacani, E., et al. 2013, ApJ, 762, 63, GDG13
- Giovannini et al. (1994) Giovannini, G., Feretti, L., Venturi, T., et al. 1994, ApJ, 435, 116
- Giroletti et al. (2006) Giroletti, M., Giovannini, G., Taylor, G. B., & Falomo, R. 2006, ApJ, 646, 801
- Katarzyński et al. (2006) Katarzyński, K., Ghisellini, G., Tavecchio, F., Gracia, J., & Maraschi, L. 2006, MNRAS, 368, L52
- Kino et al. (2002) Kino, M., Takahara, F., & Kusunose, M. 2002, ApJ, 564, 97
- Landi et al. (2009) Landi, R., Stephen, J. B., Masetti, N., et al. 2009, A&A, 493, 893
- Leahy & Tian (2012) Leahy, D. A., & Tian, W. W. 2012, A&A, 539, A128
- Liuzzo et al. (2009) Liuzzo, E., Giovannini, G., Giroletti, M., & Taylor, G. B. 2009, A&A, 505, 509
- Liuzzo et al. (2013) Liuzzo, E., Giroletti, M., Giovannini, G., et al. 2013, A&A, 560, A23, LGG13
- Peter et al. (2014) Peter, D., Domainko, W., Sanchez, D. A., van der Wel, A., & Gässler, W. 2014, A&A, 571, A41
- Piner & Edwards (2014) Piner, B. G., & Edwards, P. G. 2014, ApJ, 797, 25
- Shahinyan & VERITAS collaboration (2015) Shahinyan, K., & VERITAS collaboration. 2015, ArXiv e-prints, arXiv:1508.07358
- Straal et al. (2016) Straal, S. M., Gabanyi, K. E., van Leeuwen, J., et al. 2016, ApJ in Press., arXiv:1603.01226
- Tanaka et al. (2014) Tanaka, Y. T., Stawarz, Ł., Finke, J., et al. 2014, ApJ, 787, 155, TSF14
- Tavecchio et al. (2010) Tavecchio, F., Ghisellini, G., Foschini, L., et al. 2010, MNRAS, 406, L70
- Tavecchio et al. (2009) Tavecchio, F., Ghisellini, G., Ghirlanda, G., Costamante, L., & Franceschini, A. 2009, MNRAS, 399, L59
- Tomsick et al. (2009) Tomsick, J. A., Chaty, S., Rodriguez, J., Walter, R., & Kaaret, P. 2009, ApJ, 701, 811