Electronic and ionic conductivities in superionic Li4C60
Abstract
The GHz microwave conductivity, and high field, GHz electron spin resonance (HF-ESR) of Li4C60 fulleride is measured in a wide temperature range. We suggest that the majority of ESR active sites and at least some of the charge carriers for are electrons bound to a small concentration of surplus or vacancy ions in the polymer phase. Both and the ESR line shape depend on ionic motion. A change of the activation energy of at K coincides with the onset of the ionic DC conductivity. The ESR line shape is determined mainly by Li ionic motion within octahedral voids below K. At higher temperatures, fluctuations due to ionic diffusion change the environment of defects from axial to effectively isotropic on the ESR time scale. data up to K through the depolymerization transition confirm that the monomeric phase of Li4C60 is a metal.
pacs:
61.48.+c, 76.30.Pk, 76.30.-v, 78.30.-jI Introduction
C60 fullerene molecules form polymeric structures with unusual phenomena, such as e.g. metallic conductivity and antiferromagnetic order along chains Chauvet et al. (1994). Neutral C60 is polymerized by a light Rao et al. (1993) or pressure Nunez-Regueiro et al. (1995) induced [2+2] cycloaddition reaction. In these one- and two-dimensional polymeric structures four-membered carbon rings interconnect the fullerene molecules. The polymerization of C anions is spontaneous in alkali intercalated fulleride salts. The structure of these polymers depends on the fulleride charge, . cycloaddition is favored for low values of , like in AC60 (A K, Rb, Cs)Pekker et al. (1994), while single interfullerene bonds are more stable Oszlányi et al. (1997) for as in Na4C60 and Na2AC60 (A K, Rb)Bendele et al. (1998). The size of the counter-ion also plays a role; e.g. in Na2CsC60 a moderate pressure is needed to stabilize the polymeric structure Margadonna et al. (1999).
Charge storage applications of Li intercalated carbonaceous compounds were proposed as early as 1976 (Ref. Besenhard and Eichinger, 1976). In this respect, the Li4C60 fulleride polymer is of special interest. In the 2D polymeric layers of this compound, fullerenes are connected by single bonds along one direction and by cycloaddition in the otherMargadonna et al. (2004); Riccò et al. (2005); Rols et al. (2015). Li4C60 is a superionic conductorRiccò et al. (2009) with a high ionic conductivity ( S/cm at K). The ionic conductivity of Li4C60 is intrinsic and it arises from the special structure; at low temperatures half of the Li ions have an unoccupied neighbor site which is easily occupied at higher temperatures Riccò et al. (2009).
Recently Mg2C60, a fulleride electronically and structurally similar to Li4C60, was also found to be an ionic conductorPontiroli et al. (2013). In the case of alkali fullerides, ionic conductivity is limited to fullerenes with small alkali metal ions, as the small trigonal aperture connecting interstitial sites within the polymeric framework hinders ionic diffusion. In fulleride crystals with larger alkali metal ions, diffusion requires a reorganization of the fullerene molecular positions. Larger alkali metal ions rearrange or diffuse only at phase transitions or at high temperatures, e.g. above K in Na2C60 [Ref. Klupp et al., 2006a]. The electronic properties under pressure and calorimetric measurements of Li, Na and K doped fullerides were carried out in detail by the group of Sundqvist et al.Sundqvist et al. (2008); Yao et al. (2010); Sundqvist et al. (2011, 2015); Inaba et al. (2015). The ionic conductivity depends also on other factors than the barrier between sites; counter-intuitively, the DC conductivity of Li4C60 polymer increases under pressure.
Nuclear magnetic resonance (NMR) and electron spin resonance showed that Li4C60 polymer has a non-magnetic, insulating ground state Riccò et al. (2005) while the high temperature monomer phase is metallic [Ref. Riccò et al., 2007]. The frequency and temperature dependence of the electric conductivity provides a direct information on the ionic and electronic conductivities and on structural changes. In the Li4C60 polymer, the low frequency conductivity up to MHz is dominated by the ionic contributionRiccò et al. (2005), while the microwave conductivity is electronic. Microwave frequencies (typically GHz) are well above the characteristic frequency of Li+ ion movement and far below the plasma edge in fulleride metals Gunnarsson (1997) (typically eV, THz); thus the microwave conductivity is dominated by electronic contributions. Unpaired electrons at Li vacancy and/or Li surplus sites are ESR active and are affected by Li ion diffusion. A complex behavior above K of the electron spin resonance at GHz was reported in a previous study Arčon et al. (2008). The high spectral resolution at GHz of this study allows to follow the onset of Li+ ion diffusion at the ESR active defect sites.
Here, we present microwave conductivity and high frequency electron spin resonance (HF-ESR) measurements on Li4C60 in the K temperature range. We study the electronic properties of the polymeric and the monomeric phases with particular attention to the dynamics of electrons in the superionic phase and to the depolymerization process. We find that diffusion of Li+ ions above K induces an activated electronic conductivity in polymeric Li4C60. Ion diffusion also explains changes in the HF-ESR spectrum in the same temperature range. We trace the depolymerization process up to K and confirm that the high temperature monomer phase is a good conductor, in accordance with previously reported resultsRiccò et al. (2007).
II Experimental
Li4C60 samples were prepared as described previously Margadonna et al. (2004). A careful X-ray and NMR characterization confirmed the polymeric structure and the stoichiometry LixC60 with , similarly to the samples investigated in Refs. Riccò et al., 2009 and Riccò et al., 2007. For infrared (IR) measurements, the sample was pressed in an Ar filled glove box into KBr pellets. Li and Na doped species were measured in the glove box with a Bruker Alpha spectrometer, K4C60 was measured in an air tight sample holder in a Bruker IFS 66v spectrometer at room temperature with a resolution of cm-1.
Powder samples of Li4C60 were sealed in quartz tubes under mbar He for the microwave conductivity and ESR measurements. Microwave conductivity was measured using the cavity perturbation technique which is well suited for air sensitive powder samples and thus allows the study of alkali fulleride compounds Bommeli et al. (1995). This method is based on the measurement of changes in the quality factor, , of a microwave cavity arising from microwave eddy currents in the sampleNebendahl et al. (2001). The GHz TE copper cavity has an unloaded quality factor of . A nitrogen gas flow quartz cryostat allowed to vary the sample temperature between K and K while keeping the cavity temperature at K. Measurements in the K temperature range were performed in a similar cavity placed in a liquid He cryostat. The powder samples were placed at the center of the cavity where in highly conducting samples the electric field is not excluded by depolarization effects. The grain size of the sample was smaller than the microwave penetration depth and the conductivity is proportional to [Ref. Klein et al., 1993] where and are the quality factors of the cavity with and without the sample, respectively Buravov and Shchegolev (1971). Only relative variations of the conductivity are measured as the proportionality factor between microwave losses and conductivity depends on the unknown grain size distribution.
High frequency electron spin resonance spectra were recorded with a home-built spectrometer Nagy et al. (2011) operating at GHz (corresponding to T for a -factor of ). The maximum output power of the microwave source is mW. Microwave radiation is transmitted by a quasi-optical bridge and is detected with an InSb detector operating at K. The spectrometer has a sensitivity of about spins /( T). The resolution of ESR lines determined by the homogeneity of the magnet is mT.
III Results and discussion
III.1 Infrared spectroscopy
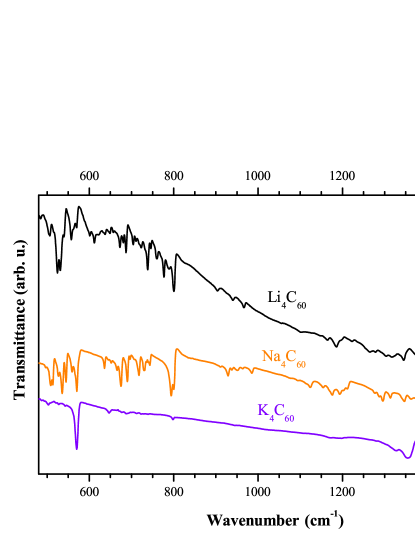
Fig. 1 shows the infrared (IR) spectrum of Li4C60 and for comparison, the spectra of Na4C60 and K4C60, where the charge state of the fullerene is also C. The IR spectrum of Li4C60 resembles that of Na4C60, in agreement with the polymeric nature of both compounds. Na4C60 is a two-dimensional polymer with single bonds Oszlányi et al. (1997). Polymer formation significantly distorts the C60 ball Long et al. (2000) and the original icosahedral symmetry of C60 is lowered to in Li4C60 [Ref. Margadonna et al., 2004] and in Na4C60 [Ref. Oszlányi et al., 1997]. This results in the large number of IR active modes in contrast to the four allowed IR modes of C60. On the other hand, the larger size of the alkali ion hinders the polymer formation in K4C60. Although there is a Jahn-Teller distortion Klupp et al. (2006b) even in this case, the distortion of the C60 ball is smaller than in polymers and the IR active modes emerging from the lower symmetry are weak.
The strong band at cm-1 in Li4C60 and Na4C60 arises from a single bond between fullerenes Quintavalle et al. (2008) and is not an intramolecular mode. Thus the infrared spectra confirm that single bonds are present in the Li4C60 polymer as determined by the structural characterization Margadonna et al. (2004).
Infrared spectroscopy can in general provide information about the conductivity of materials. In the case of powders in KBr pellets, the effects of light scattering obscure the exact shape of the free-carrier (Drude) absorption, but the signs of metallic character are a strong background absorption and the change of the vibrational bands from Lorentzian to Fano shapeZadik et al. (2015); Kamarás and Klupp (2014). We do not observe any of these effects here, which confirms the absence of such additional spectral weight in the IR spectrum of Li4C60 at room temperature. This invokes that the electronic conductivity is negligible in agreement with Ref. Riccò et al., 2009. Due to the large mass of the charge carrying ions in fulleride compounds, the Drude peak corresponding to the ionic conductivity is well below the usually accessible frequency of cm-1.
III.2 Electronic and ionic conductivities in the polymer phase
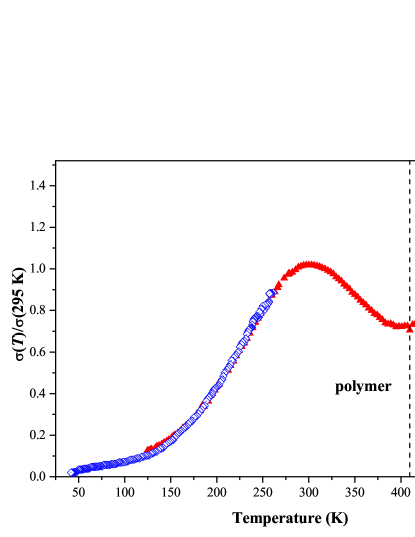
Fig. 2 shows the temperature dependence of the GHz microwave conductivity, , of Li4C60 normalized to the room temperature value. Data above K are for increasing temperature only. Below K, data taken in heating and cooling are indistinguishable. The conductivity was too small to measure the microwave loss below K. At low temperature, increases with increasing ; it has a maximum around K and a minimum at K. Thermal cycles around the polymerization temperature show that the data in Fig. 2 below K corresponds to the polymeric phase. The subsequent rapid increase arises from the onset of depolymerization and is discussed in Sec. III.4.
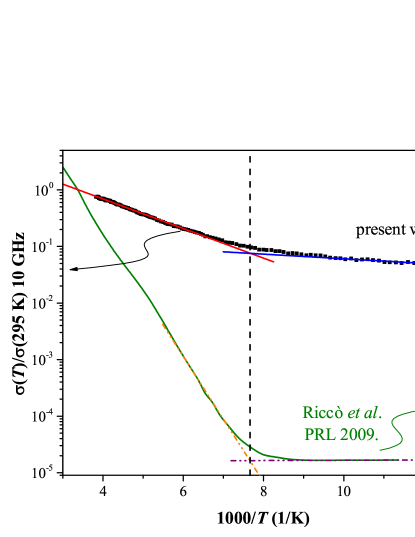
Fig. 3 compares the low temperature microwave conductivity with the DC conductivity data of Ref. Riccò et al., 2009 using an Arrhenius presentation. An activated behavior with different activation energies, , above and below K fits well the microwave conductivity data. The corresponding parameters are summarized in Table LABEL:Table. The activation energy of the DC ionic conductivity is much larger than for the microwave conductivity. Although the absolute value of the microwave conductivity is not known, it is certainly much larger than the DC conductivity at K, the onset of ionic diffusion and most likely remains larger up to K.
| Regime | (arb. u.) | |
|---|---|---|
The different temperature dependence of the DC and microwave conductivities suggest these have different origins. In our viewRiccò et al. (2009), above the K onset of Li+ ionic diffusion to about ambient temperatures the DC conductivity arises mainly from the ionic conductivity, involving all Li ions. (Sundqvist et al. Sundqvist et al. (2015) raised, however some doubts about this). On the other hand, we suggest that the microwave conductivity is the electronic conductivity at GHz associated with a small concentration of charged defects.
There is ample evidence for Li ionic diffusion at ambient temperatures and belowArčon et al. (2008); Riccò et al. (2009). It was observed by the motional narrowing of the 7Li NMR line and, as explained in Sec. III.3, the narrowing of the ESR line above K is also well understood by Li ionic diffusion. The strong temperature and frequency dependence of the DC conductivity supports the dominant role of the ionic contributionCattaneo et al. (2016).
The microwave conductivity has an electronic origin; the ionic conduction is negligible at GHz. Except for very low frequencies, the ionic conductivity decreases strongly with frequency. An extrapolation of the low frequency data at K and below shows that at Hz is well below the sensitivity of the microwave cavity conductivity measurement technique. The total conductivity (i.e. ionic plus electronic) as a function of frequency has a temperature dependent minimum somewhere between and Hz. From DC to frequencies of the order of Hz the conductivity is dominated by the ionic contribution while at higher frequencies the conductivity is due to electrons bound to charged defects.
According to the IR experiment (Sec. III.1), the material is essentially an electronic insulator at ambient temperatures; the electronic band gap is large and most electrons do not contribute to the conductivity. We suggest that the electronic conductivity is associated with a small concentration of electrons trapped at defects of the lattice. Li vacancy or Li surplus sites are obvious candidates; for these sites the microwave conductivity and ESR originate from the same electrons. As explained in Sec. III.3, the unpaired defect electrons are confined to well defined states at octahedral voids below K. The associated microwave electronic conductivity is due to electron hopping between states in the vicinity of the charged defects. Calorimetric measurements also support this proposal. A contribution to the specific heat was attributed to Li+ motion within octahedral voids from temperatures as low as K [Ref. Inaba et al., 2015]. The disorder induced by Li ionic diffusion above K creates new electronic states and allows electronic diffusion of the small concentration of defect electrons to larger distances. This explains the stronger increase of conductivity above the onset of Li ionic diffusion at K.
Finally, we note that one may associate the slowly hopping localized electronic states giving rise to the microwave conductivity of the polymeric phase to small-polaronsKittel (1986); Sólyom (2009); Holstein (1959); Jaime et al. (1997). Li4C60 is an ionic salt with an insulator ground state. According to HF-ESR results (discussed in Section III.3), at low temperatures the excited states are confined to the vicinity of octahedral voids. These localized excitations diffuse slowly as temperature is raised. The small-polaron motion is a thermally activated process, which agrees well with our findings shown in Fig. 3. The concentration of mobile electrons is small and small-polaron conduction in Li4C60 contributes significantly to the conductivity only at high frequencies, where the ionic contribution is negligible. At microwave frequencies, the electronic (polaronic) conduction determines the conductivity. The presence of polarons can also be inferred from HREELS measurements indicating coupling of electrons to low-energy (alkali metal or intermolecular) phonons [Ref. Macovez et al., 2008].
III.3 Narrowing of the ESR spectrum by Li diffusion
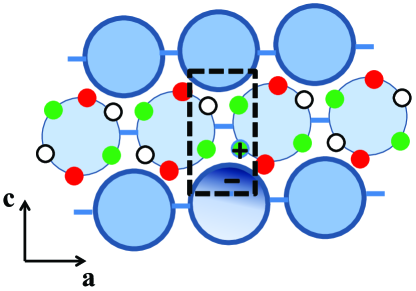
The ESR spectrum arises from defects of the polymeric matrix or from unpaired electrons in the polymeric structure bound to charges arising from a slight off-stoichiometry of the Li concentration. The ESR active defect concentration is one spin per hundred C60 molecules Arčon et al. (2008). As explained below, at low temperatures the large majority of the ESR active sites have the same environment and we suggest that the ESR arises mostly from off-stoichiometry. Fig. 4 is a schematic view of a charged ESR active site bound to a surplus Li+ ion in an octahedral void. The resonance frequency of the ESR, characterized by the -factor, is sensitive to small variations in the electronic configuration surrounding defects. The anisotropic -shift depends on the spin-orbit interaction and the crystal field in an environment with lower than cubic symmetry and is very small in materials composed of light atomsFazekas (1999). The previous ESR study Arčon et al. (2008) at GHz observed the deviation from cubic symmetry as a splitting of the ESR signal. The present higher resolution GHz ESR work follows the evolution of the environment of ESR active defects in detail. We find that the majority of defects evolve from an axial symmetry configuration at low temperatures to an effectively isotropic configuration at ambient temperatures.
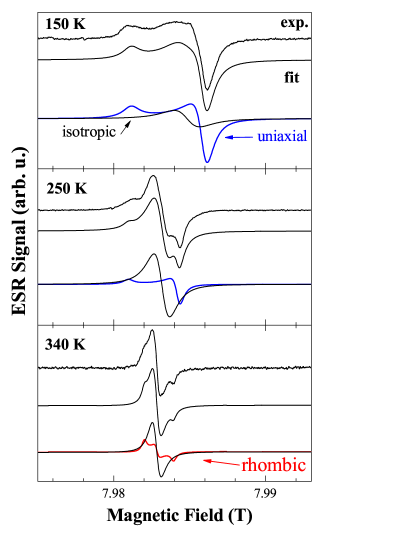
Fig. 5 displays the temperature evolution of the ESR spectrum of as-prepared Li4C60. The spectrum is the superposition of ‘anisotropic’ and ‘isotropic’ components. The anisotropic component is a powder spectrum broadened by the -factor anisotropy in the magnetic field. The line shape is characteristic of a uniaxial -factor anisotropy (blue curve in Fig. 5) Slichter (1989); Atherton (1973). The width of the anisotropic component decreases with temperature. Above K only a small intensity anisotropic line with a different line shape remains that possibly reflects a lower, rhombic, symmetry. The decrease of the line width of the anisotropic component is characteristic of a fluctuating environment in which the average -factor anisotropy is reduced but remains finite. The isotropic component is a single line with a Lorentzian line-shape (solid line in Fig. 5), characteristic of sites with a cubic static environment or with a rapidly varying environment that averages the -factor anisotropy to zero.

Fig. 6 displays the detailed variation of the relative intensity and the line width for the anisotropic component. The intensity of the isotropic component relative to the total intensity of the spectrum, / is constant at low temperatures and increases in a step-like fashion between and K (Fig. 6a). The spectrum is dominated by the anisotropic component between and K and by the isotropic component above K. The -factor anisotropy of the anisotropic component decreases gradually with increasing temperature from mT at K to mT at K (Fig. 6b). The defect concentration changes less than a factor of below K since the spin susceptibility, measured by the ESR spectrum intensity, , depends little on temperatureArčon et al. (2008) between K and K. The long electronic spin-lattice relaxation time prevents reliable intensity measurements at lower temperatures. The spin susceptibility increases rapidly above K, indicating the formation of new ESR active defects.
We interpret the unusual temperature dependence of the ESR spectrum as a consequence of the fluctuation of the -factor tensor of unpaired localized electrons arising from Li+ motion. At low temperatures, Li ions in tetrahedral sites are static. Li ions in octahedral voids are hopping between a few possible sites and remain within voids for long times. We assume that the anisotropic component arises from unpaired electrons bound to octahedral voids with a third Li ion in addition to the two Li ions of the majority sites. (Electron holes bound to Li vacancies is another possibility). The charge of the Li ion nearest to the unpaired electron is the most important factor for the deviation from cubic symmetry of the crystal field at the unbound electron. The orientations and principal values of the -factor tensor of a given ESR active site fluctuates between a few well defined values due to hopping of Li ions within the voids but within the ESR time scale the anisotropy is not averaged to zero. The relevant ESR time scale is given by the low temperature width of the anisotropic line. Non-identified sites, representing percent of the localized unpaired electron defects, give a narrow, isotropic line at low temperatures.
At higher temperatures, the density of unpaired electronic states increases gradually with the increasing disorder and this decreases the effective -factor anisotropy. At temperatures above K, the fluctuations of the -factor due to diffusion of Li ions between different voids in the polymeric structure becomes important and the line shape changes in a qualitative way. Electrons bound to (or in the vicinity of) the diffusing surplus ions experience a rapidly changing environment between many more states than experienced at lower temperatures. Diffusion involves all Li ions between voids according to Ref. Riccò et al., 2009. Each C60 molecule of the polymer is surrounded by equidistant tetrahedral and octahedral voids. Diffusion in and out the large number of sites averages the -factor anisotropy and contributes the to a narrow, on-the-average isotropic line intensity. The concentration of unpaired electrons at isotropic sites increases rapidly between and K but the total defect concentration does not change. Above K Li ion hopping between octahedral voids determines the ESR lineshape. At K only a very small intensity anisotropic line is observed around the isotropic line.
The motion of Li ions was observed in a broad temperature range by the narrowing of the 7Li NMR spectrum Arčon et al. (2008). The temperature dependence of the NMR and the ESR spectra are qualitatively similar. The NMR spectrum at low temperatures has an ”anisotropic” broad component due to the distribution of electric field gradients (EFG) at octahedral Li sites. Motion of the Li ions reduces the time-averaged EFG measured by the NMR line width of the broad component. Like for the anisotropic ESR, there are two temperature ranges. The NMR line narrows moderately with temperature up to K. At higher temperatures the EFG decreases rapidly in a step-like fashion and the narrow line at high temperature is characteristic of an isotropic environment on the NMR time scale.
Microwave conductivity, 7Li NMR, and ESR are sensitive to both intra- and inter-void hopping but at different time scales. The DC ionic conductivity senses only ion diffusion between voids. The onset of the increasing isotropic ESR signal intensity (shown with an arrow in Fig. 6) is thus associated with the onset of Li+ ion hopping between voids around K. This temperature is slightly higher than the onset temperature of the rapid narrowing of the anisotropic 7Li NMR line. The DC ionic conductivity is more sensitive to the onset of hopping between voids and is observed from much lower temperatures. As discussed earlier, the microwave electronic conductivity is also influenced by the ionic motion.
Narrowing of the ESR spectra allows to estimate the correlation time for Li diffusion between voids as it is of the order of the correlation time, of the -factor fluctuation Slichter (1989).
| (1) |
where is the width of the static low temperature anisotropic spectrum (in angular frequency units) and is the width of the high temperature isotropic line. Inserting ( GHz/T is the electron gyromagnetic ratio) and = mT, we find .
III.4 Depolymerization and metallic conductivity in the monomeric phase
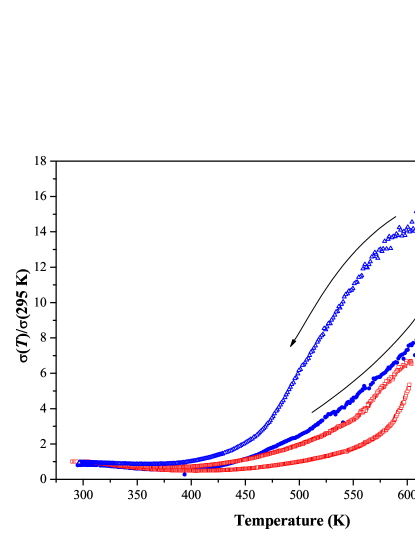
X-ray diffraction at high temperatures shows a depolymerization of the low temperature monoclinic polymeric phase of Li4C60 into a cubic monomeric phase Riccò et al. (2007). The depolymerization is hysteretic; in the XRD study a mixture of monoclinic and cubic phases appears between 470 and 600 K. ESR, NMR, and Raman spectroscopy data suggests that the cubic monomer phase is metallic Riccò et al. (2007); Arčon et al. (2008). We confirm in this work the metallic character of the high temperature phase by a direct measurement of the electronic conductivity. The structural phase transition between the electronic insulating low temperature polymeric phase and the high temperature metallic monomeric Li4C60 phases is followed in the GHz microwave conductivity. Fig. 7 displays two examples of the several temperature cycles performed. The heating and cooling cycle between and K is between the polymeric phase, well below the depolymerization temperature, to above K where the material is homogeneously monomeric. In the other cycle displayed, a large part of the material remains polymeric up to K.
The GHz conductivity has a local maximum at K and a minimum at about K in all heating curves with various heating rates and history. The anomaly differs little between the heating and cooling parts of the and K cycle where the transition to the monomer phase is only partial. Thus the maximum in the conductivity at K is a feature of the polymeric phase. We suggest that the anomalous decrease in the GHz electronic conductivity between K and K is due to the reversible breaking of some of the polymeric bonds.
Above K, the conductivity increases rapidly in the heating cycle as metallic domains of the monomeric phase are formed. The hysteresis of the GHz conductivity places the polymerization temperature at about 550 K in agreement with the X-ray diffraction data Riccò et al. (2007). For the cycle shown in Fig. 7, hysteresis is very small above K. The conductivity is approximately temperature independent above this temperature and an under-cooling effect is observed well below K. The monomer phase is metallic with more than an order of magnitude higher conductivity than in the polymeric phase at ambient temperature. As expected for a metal, the spin susceptibility of the monomer phase measured by ESR is high and approximately temperature independent Arčon et al. (2008). (This measurement was, however in cooling from K of an incompletely polymerized sample).
IV Conclusions
We studied the Li4C60 fulleride using microwave conductivity and high field electron spin resonance spectroscopy in a wide temperature range. Low temperature microwave conductivity changes near the temperature where ionic conduction starts, which indicates a connection between the electronic and ionic conductions. HF-ESR measurements demonstrate that the Li+ ion dynamics deeply influences the electronic configuration of the paramagnetic centers in the polymer superionic phase. For K, the ions are static and localize the electrons which give rise to an ESR line with -factor anisotropy. When Li+ ions motion is activated, localized electrons start to diffuse with different velocities. The hopping of localized electrons gives the most important contribution to the conductivity of the polymer phase in the microwave frequency range where the ionic conductivity is negligible. Near 300 K, the conductivity has a maximum due to the onset of defect formation in the polymeric phase. The complex dynamics of the electrons in the polymer phase also results in an unusual temperature dependence of the -factor anisotropy. Microwave conductivity measurements confirm the metallic nature of the high temperature monomeric phase Li4C60 compound.
V Acknowledgments
Work supported by the ERC Starting Grant No. ERC-259374-Sylo and OTKA 105691.
References
- Chauvet et al. (1994) O. Chauvet, G. Oszlányi, L. Forró, P. W. Stephens, M. Tegze, G. Faigel, and A. Jánossy, Phys. Rev. Lett. 72, 2721 (1994).
- Rao et al. (1993) M. Rao, P. Zhou, K. A. Wang, G. T. Hager, J. M. Holden, Y. Wang, W. T. Lee, X. X. Bi, and P. C. Eklund, Science 259, 955 (1993).
- Nunez-Regueiro et al. (1995) M. Nunez-Regueiro, L. Marques, J.-L. Hodeau, O. Béthoux, and M. Perroux, Phys. Rev. Lett. 74, 278 (1995).
- Pekker et al. (1994) S. Pekker, L. Forró, L. Mihály, and A. Jánossy, Solid State Commun. 90, 349 (1994).
- Oszlányi et al. (1997) G. Oszlányi, G. Baumgartner, G. Faigel, and L. Forró, Phys. Rev. Lett. 78, 4438 (1997).
- Bendele et al. (1998) G. M. Bendele, P. W. Stephens, K. Prassides, K. Vavekis, K. Kordatos, and K. Tanigaki, Phys. Rev. Lett. 80, 736 (1998).
- Margadonna et al. (1999) S. Margadonna, C. M. Brown, A. Lappas, K. Prassides, K. Tanigaki, K. D. Knudsen, T. L. Bihan, and M. Mézouar, J. Solid State Chem. 145, 471 (1999).
- Besenhard and Eichinger (1976) J. O. Besenhard and G. Eichinger, J. Electroanal. Chem. 68, 1 (1976).
- Margadonna et al. (2004) S. Margadonna, D. Pontiroli, M. Belli, T. Shiroka, M. Riccò, and M. Brunelli, J. Am. Chem. Soc. 126, 15032 (2004).
- Riccò et al. (2005) M. Riccò, T. Shiroka, M. Belli, D. Pontiroli, M. Pagliari, G. Ruani, D. Palles, S. Margadonna, and M. Tomaselli, Phys. Rev. B 72, 155437 (2005).
- Rols et al. (2015) S. Rols, D. Pontiroli, C. Cavallari, M. Gaboardi, M. Aramini, D. Richard, M. R. Johnson, J. M. Zanotti, E. Suard, M. Maccarini, et al., Phys. Rev. B 92, 014305 (2015).
- Riccò et al. (2009) M. Riccò, M. Belli, M. Mazzani, D. Pontiroli, D. Quintavalle, A. Jánossy, and G. Csányi, Phys. Rev. Lett. 102, 145901 (2009).
- Pontiroli et al. (2013) D. Pontiroli, M. Aramini, M. Gaboardi, M. Mazzani, A. Gorreri, M. Riccò, I. Margiolaki, and D. Sheptyakov, Carbon 51, 143 (2013).
- Klupp et al. (2006a) G. Klupp, P. Matus, D. Quintavalle, L. F. Kiss, É. Kováts, N. M. Nemes, K. Kamarás, S. Pekker, and A. Jánossy, Phys. Rev. B 74, 195402 (2006a).
- Sundqvist et al. (2008) B. Sundqvist, M. Yao, and T. Wågberg, High Pressure Research 28, 597 (2008).
- Yao et al. (2010) M. Yao, T. Wågberg, and B. Sundqvist, Phys. Rev. B 81, 155441 (2010).
- Sundqvist et al. (2011) B. Sundqvist, T. Wågberg, and M. Yao, Diamond & Related Materials 20, 600 (2011).
- Sundqvist et al. (2015) B. Sundqvist, O. Andersson, C. Gong, B. Liu, B. Tonpheng, J. Yu, and M. Yao, New Journal of Physics 17, 023010 (2015).
- Inaba et al. (2015) A. Inaba, Y. Miyazaki, P. P. Michalowski, E. Gracia-Espino, B. Sundqvist, and T. Wågberg, The Journal of Chemical Physics 142, 164706 (2015).
- Riccò et al. (2007) M. Riccò, M. Belli, D. Pontiroli, M. Mazzani, T. Shiroka, D. Arčon, A. Zorko, S. Margadonna, and G. Ruani, Phys. Rev. B 75, 081401 (2007).
- Gunnarsson (1997) O. Gunnarsson, Rev. Mod. Phys. 69, 575 (1997).
- Arčon et al. (2008) D. Arčon, A. Zorko, M. Mazzani, M. Belli, M. Riccò, and S. Margadonna, New Journal Physics 10, 033021 (2008).
- Bommeli et al. (1995) F. Bommeli, L. Degiorgi, P. Wachter, Ö. Legeza, A. Jánossy, G. Oszlányi, O. Chauvet, and L. Forró, Phys. Rev. B 51, 14794 (1995).
- Nebendahl et al. (2001) B. Nebendahl, D.-N. Peligrad, M. Požek, A. Dulčić, and M. Mehring, Rev. Sci. Instrum. 72, 1876 (2001).
- Klein et al. (1993) O. Klein, S. Donovan, M. Dressel, and G. Gruner, International Journal of Infrared and Millimeter Waves 14, 2423 (1993).
- Buravov and Shchegolev (1971) L. I. Buravov and I. F. Shchegolev, Instrum. Exp. Tech. 14, 528 (1971).
- Nagy et al. (2011) K. L. Nagy, D. Quintavalle, T. Fehér, and A. Jánossy, Applied Magnetic Resonance 40, 47 (2011).
- Oszlányi et al. (1997) G. Oszlányi, G. Baumgartner, G. Faigel, and L. Forró, Phys. Rev. Lett. 78, 4438 (1997).
- Long et al. (2000) V. C. Long, J. L. Musfeldt, K. Kamarás, G. B.Adams, J. B.Page, Y.Iwasa, and W. E.Mayo, Phys. Rev. B 61, 13191 (2000).
- Klupp et al. (2006b) G. Klupp, K. Kamarás, N. M. Nemes, C. M. Brown, and J. Leao, Phys. Rev. B 73, 085415 (2006b).
- Quintavalle et al. (2008) D. Quintavalle, F. Borondics, G. Klupp, A. Baserga, F. Simon, A. Jánossy, K. Kamarás, and S. Pekker, Phys. Rev. B 77, 155431 (2008).
- Zadik et al. (2015) R. H. Zadik, Y. Takabayashi, G. Klupp, R. H. Colman, A. Y. Ganin, A. Potocnik, P. Jeglic, D. Arčon, P. Matus, K. Kamarás, et al., Sci. Advances 1, e1500059 (2015).
- Kamarás and Klupp (2014) K. Kamarás and G. Klupp, Dalton Trans. 43, 7366 (2014).
- Cattaneo et al. (2016) A. S. Cattaneo, V. Dall’Asta, D. Pontiroli, M. Riccò, G. Magnani, C. Milanese, C. Tealdi, E. Quartarone, and P. Mustarelli, J. Mat. Chem. A submitted (2016).
- Kittel (1986) C. Kittel, Introduction to Solid State Physics (Wiley, New York, 1986), VIth ed.
- Sólyom (2009) J. Sólyom, Fundamentals of the Physics of Solids: Volume II - Electronic Properties (Springer, Berlin, 2009).
- Holstein (1959) T. Holstein, Ann. Phys. 8, 325 (1959).
- Jaime et al. (1997) M. Jaime, H. T. Hardner, M. B. Salamon, M. Rubinstein, P. Dorsey, and D. Emin, Phys. Rev. Lett. 78, 951 (1997).
- Macovez et al. (2008) R. Macovez, R. Savage, L. Venema, J. Schiessling, K. Kamarás, and P. Rudolf, J. Phys. Chem. C 112, 2988 (2008).
- Fazekas (1999) P. Fazekas, Lecture Notes on Electron Correlation and Magnetism, Series in Modern Condensed Matter Physics (World Scientific, 1999).
- Slichter (1989) C. P. Slichter, Principles of Magnetic Resonance (Spinger-Verlag, New York, 1989), 3rd ed.
- Atherton (1973) N. M. Atherton, Electron Spin Resonance; Theory and Applications (E. Horwood; Halsted Press Chichester New York, 1973).