Profiles of electrostatic potential across the water-vapor, ice-vapor and ice-water interfaces
Abstract
Ice-water, water-vapor interfaces and ice surface are studied by molecular dynamics simulations with the SPC/E model of water molecules having the purpose to estimate the profiles of electrostatic potential across the interfaces. We have proposed a methodology for calculating the profiles of electrostatic potential based on a trial particle, which showed good agreement for the case of electrostatic potential profile of the water-vapor interface of TIP4P model calculated in another way. The measured profile of electrostatic potential for the pure ice-water interface decreases towards the liquid bulk region, which is in agreement with simulations of preferential direction of motion of Li+ and F- solute ions at the liquid side of the ice-water interface. These results are discussed in connection with the Workman-Reynolds effect.
Key words: ice-water interface, ice surface, water-vapor interface, solute ions, profile of electrostatic potential, Workman-Reynods effect, molecular dynamics simulations
PACS: 61.20.Qg, 05.20.-y, 82.45.Gj
Abstract
Границi роздiлу лiд-вода, вода-пара та поверхня льоду були дослiдженi комп’ютерним моделюванням методом молекулярної динамiки з SPC/E моделлю молекул води маючи на метi визначити профiлi електростатичного потенцiалу через границi роздiлу фаз. Ми запропонували методологiю для розрахунку профiлiв електростатичного потенцiалу з використанням пробної частинки. Запропонований пiдхiд показав добре узгодження з профiлем електростатичного потенцiалу для границi роздiлу вода-пара в моделi води, розрахованого iншою методикою. Отриманий профiль електростатичного потенцiалу для чистої границi роздiлу лiд-вода зменшується в сторону рiдкої фази, що узгоджується з моделюванням переважаючого напрямку руху домiшкових iонiв Li+ та F- на рiдиннiй сторонi границi роздiлу лiд-вода. Отриманi результати обговорюються з точки зору їх вiдношення до ефекту Воркмана-Рейнольдса.
Ключовi слова: границя роздiлу лiд-вода, поверхня льоду, границя роздiлу вода-пара, домiшковi iони, профiль електростатичного потенцiалу, ефект Воркмана-Рейнольдса, моделювання методом молекулярної динамiки
1 Introduction
Fundamental presence of water, ice and their ice-water, ice-vapor(air) and water-vapor(air) interfaces in nature defines huge interest to exploration of their structural and dynamic properties [1, 2]. Microscopic structure and dynamics of the interfaces can be studied by atomistic molecular dynamics (MD) computer simulations using either models of water molecules with effective interactions or on ab initio level with explicit account for electron subsystem. Among the different ice and water interfaces, the ice-water interface has been studied much less, although by the date the issues of stability of the water-ice interface [3, 4, 5], its width [6, 7, 8, 9] and interfacial free energy [10, 11, 12, 13] are quite well elaborated.
Not only the pure interfaces are of great interest — even more interesting and fascinating problem is the behavior of different molecular and atomic solutes in the interfacial regions. One can mention a problem of the effect of solutes on the surface tension of aqueous solutions [14, 15], a problem of ionic transfer across aqueous and ice interfaces [16, 17, 18, 19], the effects of salt on premelting the surface layers of ice [20, 21, 22], and the Workman-Reynolds effect [23, 24, 25, 26, 27, 28, 29] observed during the freezing of dilute aqueous solutions. The Workman-Reynolds effect of the emergence of freezing potential between the solid and liquid phases is connected with a charge separation occuring at a growing ice surface (moving ice-water interface). For simple aqueous solutions of NaCl, NaF, NaI, LiCl, etc., the Workman-Reynolds experiments gave evidence of positive potential of liquid with respect to ice, i.e., the charge separation with an excess of positive ions on the liquid side of the ice-aqueous solution interface. By date it is not clear what causes the observed charge separation at the ice-water interface.
Computer simulations support the observations of the charge separation occuring in Workman-Reynolds effect. Following a molecular dynamics study of the tendencies in ionic solute motion close to the water/dichloroethane interface [30], one may use the same methodology and place positive/negative ions on the liquid side of the ice-water interface. Upon proper equilibration, one can observe the preferable direction of motion of the ions towards/outwards the interface. Such a study with Na+ and Cl- solute ions at the liquid side of ice-water interface was reported in [10]. The positive sodium ions were moving towards the bulk water region of the two-phase system, while the negative Cl- ions were trying to penetrate deeper into the interface heading towards the ice bulk region. These results for behaviour of positive/negative ions at the ice-water interface imply that the preferential direction of motion of solute ions can be caused by a difference in electrostatic potential between the solid and liquid sides of the pure interface. Therefore, the aim of this study was to check if the same effect is observed for the ions at the ice-water interface other than those reported in [10], and to estimate the profiles of electrostatic potential across three different interfaces: the water-vapor, ice-vapor and ice-water ones — and then compare them. The profile of electrostatic potential has already been calculated for water-vapor interface [31, 32], while for ice surface there are experimental estimates of the surface potential, as well as there were reported the profiles of the potential of the mean force for positive/negative ions [10, 22]. The rest of the paper is organized as follows: in the next section we supply the details of our molecular dynamics simulations as well as the methodology of calculations of the profile of electrostatic potential will be explained. In section 3, we report the results for the profiles of electrostatic potential for the water-vapor, ice-vapor and ice-water interfaces and discuss our findings. The last section contains a conclusion of this study.
2 Methodology of calculations
Molecular dynamic simulations for the three two-phase systems (containing water-vapor, ice-vapor and ice-water interfaces) were performed with the rigid SPC/E model [33] of water molecules. The simulated model ice-water system consisted of 2304 water molecules, ice-vapor and water-vapor systems — each of 1344 molecules. The average temperature in simulations of ice-water and ice-vapor systems was 225 K, i.e., nearly at the melting point for ice of the SPC/E model [4, 34], and for the water-vapor system the temperature was 298 K. For the case of ice-water and ice-vapor interfaces, we studied only the basal face of the interfaces, although the other orientations of ice form ice-water interfaces with a bit smaller 10–90 widths than the basal face (see [9]), however, this should not change the general tendency of the behavior of ions at the inerface. Calculations of electrostatic profiles for the prism, () and () interfaces will be reported elsewhere.
The preparation of the interfaces for simulations at ambient pressure was described in detail in [10]. We used the same sequence of (), () and () ensembles in order to first prepare the bulk ice and the bulk water systems at the same ambient pressure, and then to bring water and ice into contact having the same area and equilibrate the two-phase system by fluctuating only the -box length at -component of pressure tensor fixed to 1 bar. The size of equilibrated ice-water system of 2304 SPC/E water molecules was . The ultimate production runs of simulations with the purpose of calculating the electrostatic potentials were performed in ensemble with Nose-Hoover thermostats. The electrostatics in simulations was treated by 3D Ewald method in all three cases of different interfaces. The cut-off distance for short-range part of potentials was 10 Å. All the simulations were performed by DL_POLY package [35].
We also performed nanosecond-long simulations of the behaviour of single Li+ and F- ions on the liquid side of the basal face of ice-water interface at K. For ion interaction with the oxygens of SPC/E water molecules we used the following parameters for short-range Lennard-Jones potential: kcal/mol, Å and kcal/mol, Å. The ions at initial positions were slowly grown in at a fixed -position first as a neutral particle with an increasing size every 500 timesteps (up to the mentioned Lennard-Jones parameter ), and then gradually increasing its charge by every 500 steps [10]. This procedure allowed us to grow in the solute ions without any structural damages for the ice-water interface.
Calculations of the electrostatic potential across the simulated two-phase system can be performed by means of the estimated charge-density profiles using their Fourier-transforms to solve the Poisson equation. For the case of ice-water and ice-vapor interfaces, the charge-density profiles contain positive and negative sharp peaks [9] in the solid phase which makes a direct application of the standard fast Fourier-transform programs problematic. In fact, sharp peaks in the charge-density profiles come from the locations of the effective charges of oxygens and hydrogens in the atomic planes. However, the solute ions never reach the locations of these point charges on oxygens and hydrogens. Therefore, we used a simple methodology which is based on a trial neutral particle which moves in a plane with constrained -coordinate and the single-particle electrostatic energy is calculated every few steps at the position of the trial particle (as if it had a charge ). The trial particle interacts via soft-core potential with the oxygens and hydrogens and, therefore, it practically moves freely in the atomic plane with constrained avoiding only the locations of the point charges on oxygens and hydrogens due to soft-core repulsion. In that case (having in mind that we can apply the Ewald methodology to calculate the single-particle electrostatic energy as if the trial particle had the charge ) the electrostatic potential is simply the average of single-particle electrostatic (Ewald) energies over configurations with the same -coordinate of the trial particle minus the Ewald self-interaction. Note, that in order to avoid a shift of the interfaces in a system with a constrained particle, the motion of the simulation cell is constrained by removing the -component of the velocity at every step during the molecular dynamics simulations, similarly as it was proposed in [36, 37] and was used earlier in our simulations reported in [10].
The -coordinate of trial particle was changing with a step of Å. In order to grow in the trial particle at a new -position, we slowly increased the effective parameter every 500 time steps. After several thousand steps, the trial particle was grown in at a new -position practically without any effect on the structure of the interface.
3 Results and discussion
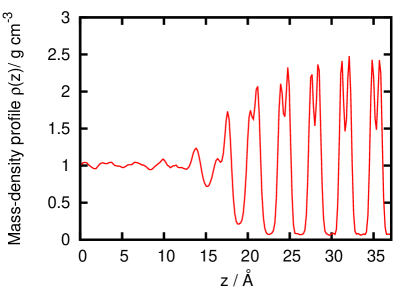
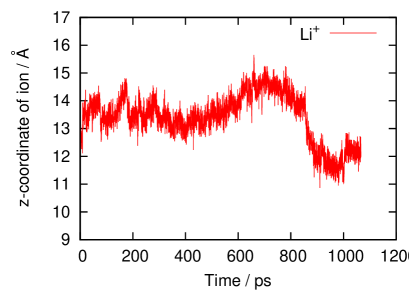
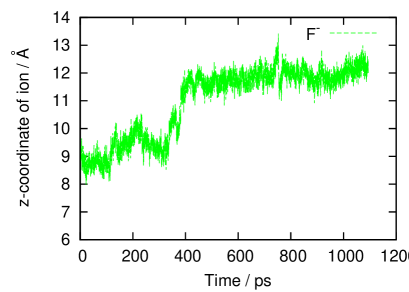
Although it is known that the solute ions are expelled from the ice bulk phase, and free energy calculations [38, 39] and MD simulations [40] support this fact, the observations for the direction of preferential motion of positive/negative ions at the ice-water interface can shed light on the Workman-Reynolds effect [23]. We observed in MD simulations of the stable ice-water interface (the mass-density profile for the equilibrium relaxed basal face of ice in contact with water simulated with the SPC/E model [33] at K is shown in figure 1) the same tendencies in the preferential direction of motion for simple Li+ and F- ions (see figure 2) as were observed earlier for the larger in size Na+ and Cl- solute ions at the liquid side of ice-water interface [10]. It is seen from figure 2, that the negative F- ion moves on the liquid side of the ice-water interface and is heading towars the bulk ice region, while the positive Li+ ion shows a very similar behaviour with the Na+ [10] having short-time trapping in cages on the liquid side of the interface, although with the long-time tendency of motion towards the water bulk region.
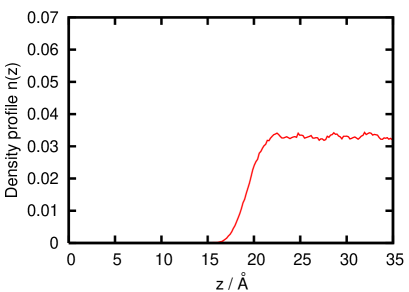
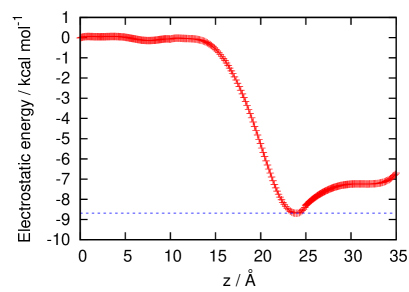
Before calculating the profile of electrostatic potential across the ice-water interface we tested our methodology on a simpler case of SPC/E water-vapor interface. In figure 3 we show the results for the density and electrostatic potential profile across the water-vapor interface. The interface is located between Å and Å, and namely in this region one observes a strong drop of the electrostatic potential, which shows a minimum nearly at the liquid side of the interface. In the literature there were reported calculations of the electrostatic potentials for the water-vapor interface of TIP4P water molecules [31, 32] and very similar (to our case of SPC/E model) profile of electrostatic potential was obtained. The minimum in profile of electrostatic potential was observed at the distance Å in the interface with respect to the Gibbs dividing plane, and the drop of potential between the vapor and minimum in the electrostatic potential in [32] was eV. In our case of the SPC/E water-vapor interface, we observed a minimum in the obtained profile of the electrostatatic potential also approximately at a distance 3 Å from the Gibbs dividing surface of the water-vapor density profile, and the drop in electrostatic potential was kcal/mol (figure 3), which corresponds to meV, and is in good agreement for the estimate for TIP4P model [31], keeping in mind that the two water models (SPC/E and TIP4P) result in slightly different values of dielectric permittivity. Hence, our proposed methodology of estimation of the profile of electrostatic potential for the case of water-vapor interface gives a very reasonable agreement with the calculations by other methodology.
For the case of the pure ice surface, we used the same methodology of calculation of the profile of electrostatic potential. The obtained density profile and electrostatic potential are shown in figure 4. Qualitatively, the profile of eletrostatic potential for the ice surface is similar to the water-vapor interface, although the surface potential is smaller than for the water-vapor interface and is kcal/mol. There is a well-pronounced minimum in the electrostatic potential located in the top smeared-out atomistic layer which actually corresponds to the liquid-like layer on the ice surface. The MD simulations of the solute ions at the ice surface [22] gave evidence of localization of the positive solute ions in the liquid-like layer, while the negative ions were trying to penetrate deeper in the interface creating more defects and practically destroying the remaining order in the top surface layers. In the literature, there is not much information on the surface potential of pure ice surface. We were able to find some experimental estimates for the pure ice surface potential from measurements with gold electrodes at temperatures between C and C [25]. The ice surface potential with respect to gold electrode was reported to be in the range meV, which, however, upon riming changed the sign and became meV. Our MD calculations for the pure ice surface potential (with an existing liquid-like layer) give the value of meV. It is obvious that the presence of the liquid-like layer on the surface of ice at melting temperature (at which the MD simulations were performed) should give a comparable value and the same sign of the surface potential as were obtained for the water-vapor interface.
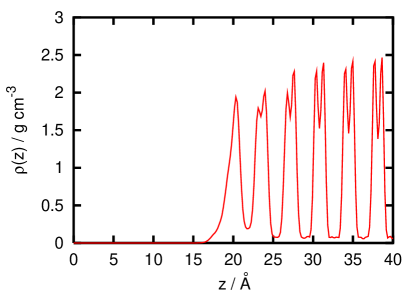
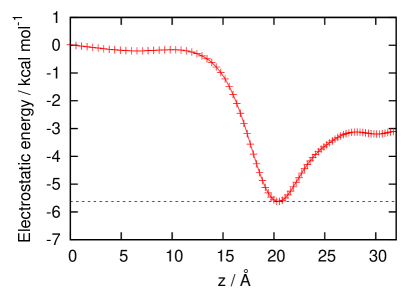
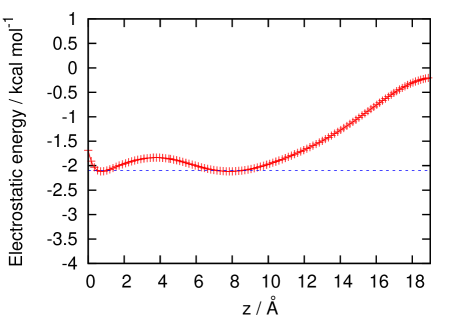
Figure 5 reports the profile of electrostatic potential, that corresponds to the ice-water interface with the mass-density profile shown in figure 1. Our calculations show an increase of the electrostatic potential from the water to the ice phase with approximately 2.1 kcal/mol ( meV) net difference. This is in agreement with our observations of the tendencies of the preferential motion of the positive solute ion towards liquid phase and of the negative ion towards the bulk ice. Note that the ice-water interface has the smallest change in the profile of electrostatic potential in comparison with the water-vapor interface and ice surface. It is obvious that in the crystal bulk region the profile of electrostatic potential should have the periodicity of the charge-density profile. We did not extend our calculations into the ice bulk region for the ice-water and ice-vapor interfaces. In order to recover the periodicity of the electrostatic potential in ice bulk region one has to use in our methodology much smaller step in constrained -position for the trial particle.
4 Conclusions
In MD simulations of Li+ and F- ions at the ice-water interface we have observed different tendencies in the preferential direction of motion which were the same as in the earlier reported behavior of larger in size ions Na+ and Cl- in MD simulations [10]. In both cases, the positive ions had a preferential direction of motion towards the bulk water region, while the negative ions showed an opposite direction and were trying to penetrate deeper in the interface. These observations are in agreement with the Workman-Reynolds effect of emerging freezing potential at the growing ice in the aqueous solutions, which reflects the charge separation with the excess of positive ions in the liquid phase.
In order to get insight into electrostatic effects which occur at different interfaces, we calculated from MD simulations the profiles of electrostatic potential for the pure ice-water, water-vapor interfaces and pure ice surface. We have proposed a new methodology of calculating the profiles of electrostatic potentials by making use of a trial particle which moves in a plane with a fixed -coordinate and due to soft-core repulsion avoids the positions of point charges. Calculations of a single-particle electrostatic energy by Ewald method at the instantaneous position of the trial particle is connected with the electrostatic potential at this point, which after the average over different configurations results in the profile of electrostatic potential. Our check performed for the water-vapor interface showed good agreement with the profile of electrostatic potential for the water-vapor interface simulated with TIP4P model [31].
Our results indicate that among the three interfaces, the pure water-vapor interface has the largest decrease of the profile of electrostatic potential in the liquid phase, while the ice-water interface has the smallest difference. The obtained profile of electrostatic potential for the pure ice-water interface decreases towards the bulk water region which can explain the observed difference in the preferential direction of motion of the positive/negative solute ions observed in MD simulations.
References
- [1] Howe J.M., Interfaces in Materials, Wiley, NewYork, 1997.
- [2] Laird B.B., Haymet A.D.J., Chem. Rev., 1992, 92, 1819; doi:10.1021/cr00016a007.
- [3] Karim O.A., Haymet A.D.J., Chem. Phys. Lett., 1987, 138, 531; doi:10.1016/0009-2614(87)80118-5.
- [4] Bryk T., Haymet A.D.J., Mol. Simul., 2004, 30, 131; doi:10.1080/0892702031000152172.
- [5] Yoo S., Xantheas S.S., J. Chem. Phys., 2011, 134, 121105; doi:10.1063/1.3573375.
- [6] Nada H., Furukawa Y., Jpn. J. Appl. Phys., 1995, 34, 583; doi:10.1143/JJAP.34.583.
- [7] Bàez L., Clancy P., J. Chem. Phys., 1995, 103, 9744; doi:10.1063/1.469938.
- [8] Hayward J.A., Haymet A.D.J., J. Chem. Phys., 2001, 114, 3713; doi:10.1063/1.1333680.
- [9] Bryk T., Haymet A.D.J., J. Chem. Phys., 2002, 117, 10258; doi:10.1063/1.1519538.
- [10] Haymet A.D.J., Bryk T., Smith E.J., In: Ionic Soft Matter: Modern Trends in Theory and Applications, Henderson D., Holovko M., Trokhymchuk A. (Eds.), NATO Science Series II, Vol. 206, Springer, Dordrecht, 2005, 333–359; doi:10.1007/1-4020-3659-0_13.
-
[11]
Handel R., Davidchack R.L., Anwar J., Brukhno A., Phys. Rev. Lett., 2008,
100, 036104;
doi:10.1103/PhysRevLett.100.036104. - [12] Pirzadeh P., Beaudoin E.N., Kusalik P.G., Cryst. Growth Des., 2012, 12, 124; doi:10.1021/cg200861e.
-
[13]
Davidchack R.L., Handel R., Anwar J., Brukhno A.V., J. Chem. Theory Comput., 2012, 8, 2383;
doi:10.1021/ct300193e. - [14] Heydweiller A., Ann. Phys. (Leipzig), 1910, 33, 145; doi:10.1002/andp.19103381108.
- [15] Levin Y., dos Santos A.P., Diehl A., Phys. Rev. Lett., 2009, 103, 257802; doi:10.1103/PhysRevLett.103.257802.
- [16] Wick C.D., Dang L.X., Chem. Phys. Lett., 2008, 458, 1; doi:10.1016/j.cplett.2008.03.097.
- [17] Lee A.J., Rick S.W., J. Phys. Chem. Lett., 2012, 3, 3199; doi:10.1021/jz301411q.
- [18] Soniat M., Rick S.W., J. Chem. Phys., 2015, 143, 044702; doi:10.1063/1.4874256.
- [19] Soniat M., Kumar R., Rick S.W., J. Chem. Phys., 2015, 143, 044702; doi:10.1063/1.4926831.
- [20] Dash J.G., Rempel A.W., Wettlaufer J.S., Rev. Mod. Phys., 2006, 78, 695; doi:10.1103/RevModPhys.78.695.
- [21] Kim J.S., Yethiraj A., J. Chem. Phys., 2008, 129, 124504; doi:10.1063/1.2979247.
- [22] Bryk T., Haymet A.D.J., J. Mol. Liq., 2004, 112, 47; doi:10.1016/j.molliq.2003.11.008.
- [23] Workman E.J., Reynolds S.E., Phys. Rev., 1950, 78, 254; doi:10.1103/PhysRev.78.254.
- [24] Gross G.W., J. Geophys. Res., 1965, 70, 2291; doi:10.1029/JZ070i010p02291.
- [25] Caranti J.M., Illingworth A.J., Nature, 1980, 284, 44; doi:10.1038/284044a0.
- [26] Caranti J.M., Illingworth A.J., J. Geophys. Res., 1983, 88, 8483; doi:10.1029/JC088iC13p08483.
- [27] Bronshteyn V.L., Chernov A.A., J. Cryst. Growth, 1991, 112, 129; doi:10.1016/0022-0248(91)90918-U.
- [28] Wilson P.W., Haymet A.D.J., J. Phys. Chem. B, 2008, 112, 11750; doi:10.1021/jp804047x;
- [29] Wilson P.W., Haymet A.D.J., J. Phys. Chem. B, 2008, 112, 15260; doi:10.1021/jp807642s.
- [30] Benjamin I., Science, 1993, 261, 1558; doi:10.1126/science.261.5128.1558.
- [31] Wilson M.A., Pohorille A., Pratt L.R., J. Chem. Phys., 1988, 88, 3281; doi:10.1063/1.453923.
- [32] Wilson M.A., Pohorille A., Pratt L.R., J. Chem. Phys., 1989, 90, 5211; doi:10.1063/1.456536.
-
[33]
Jorgensen W.L., Chandrasekhar J., Madura J.D., Impey R.W., Klein M.L.,
J. Chem. Phys., 1983, 79, 926;
doi:10.1063/1.445869. -
[34]
Sanz E., Vega C., Abascal J.L.F., MacDowell L.G., Phys. Rev. Lett., 2004,
92, 255701;
doi:10.1103/PhysRevLett.92.255701. - [35] http://www.ccp5.ac.uk/DL_POLY_CLASSIC/.
- [36] Dang L.X., Chang T.-M., J. Phys. Chem. B, 2002, 106, 235; doi:10.1021/jp011853w.
- [37] Dang L.X., J. Phys. Chem. B, 2002, 106, 10388; doi:10.1021/jp021871t.
- [38] Smith E.J., Bryk T., Haymet A.D.J., J. Chem. Phys., 2005, 123, 034706; doi:10.1063/1.1953578.
- [39] Smith E.J., Bryk T., Haymet A.D.J., J. Chem. Phys., 2007, 126, 237102; doi:10.1063/1.2738062.
- [40] Vrbka L., Jungwirth P., Phys. Rev. Lett., 2005, 95, 148501; doi:10.1103/PhysRevLett.95.148501.
Ukrainian \adddialect\l@ukrainian0 \l@ukrainian
Профiлi електростатичного потенцiалу для границь роздiлу вода-пара, лiд-пара та лiд-вода Т. Брик, А.Д.Дж. Геймет
Iнститут фiзики конденсованих систем НАН України,
вул. I. Свєнцiцького, 1, 79011 Львiв, Україна
Iнститут прикладної математики та фундаментальних наук,
Нацiональний Унiверситет ‘‘Львiвська Полiтехнiка’’, 79013 Львiв, Україна
Iнститут океанографiї Скрiппса, Унiверситет Калiфорнiї
Сан-Дiєго, Сан-Дiєго, Калiфорнiя 92093-0210, США