On the Role of the Limit in the Formation of Population III Massive Stars
Abstract
We explore the role of the modified Eddington limit due to rapid rotation (the so-called limit) in the formation of Population III stars. We performed one-dimensional stellar evolution simulations of mass-accreting zero-metallicity protostars at a very high rate () and dealt with stellar rotation as a separate post-process. The protostar would reach the Keplerian rotation very soon after the onset of mass accretion, but mass accretion would continue as stellar angular momentum is transferred outward to the accretion disk by viscous stress. The protostar envelope expands rapidly when the stellar mass reaches and the Eddington factor sharply increases. This makes the protostar rotate critically at a rate that is significantly below the Keplerian value (i.e., the limit). The resultant positive gradient of the angular velocity in the boundary layer between the protostar and the Keplerian disk prohibits angular momentum transport from the star to the disk, and consequently further rapid mass accretion. This would prevent the protostar from growing significantly beyond . Another important consequence of the limit is that the protostar can remain fairly compact () and avoid a fluffy structure () that is usually found with a very high mass accretion rate. This effect would make the protostar less prone to binary interactions during the protostar phase. Although our analysis is based on Pop III protostar models, this role of the limit would be universal in the formation process of massive stars, regardless of metallicity.
Subject headings:
cosmology: early universe — stars: evolution — stars: formation — stars: Population III – stars : rotation1. Introduction
The first stars are believed to have formed in dark matter minihaloes of about according to many cosmological simulations (e.g., Bromm & Yoshida, 2011). Since there were only light elements from the Big-Bang nucleosynthesis in the early Universe, the first stars are often called ‘Population III(Pop III)’ stars. The absence of heavy elements results in a high Jeans mass because of inefficient cooling in star-forming regions. Recent studies of the initial masses of Pop III stars indicate that they may range from to , implying a ‘top-heavy’ initial mass function (IMF)(Hosokawa et al., 2011, 2012; Hirano et al., 2014; Susa et al., 2014).
Pop III stars are important in the evolution of the early Universe. They are considered to be important reionization sources, which could end up the cosmic dark age (Tumlinson & Shull, 2000; Bromm et al., 2001), and the first producers of heavy elements via supernova explosions. A good understanding of their IMF is therefore crucial to the study of the stellar feedback of Pop III stars for the evolution of the early Universe, because the IMF largely determines the number of ionizing photons from Pop III stars, their final fates and the resultant nucleosynthesis (e.g., Heger & Woosley, 2010; Limongi & Chieffi, 2012; Yoon et al., 2012; Nomoto et al., 2013).
One of the key factors that determines the initial mass of Pop III stars is the mass accretion rate during the protostar evolution phase. As mentioned above, lack of efficient coolants in the early Universe leads to higher gas temperature ( K) than in present-day star-forming clumps ( K). The consequent mass accretion rate on Pop III protostars has been expected to be as high as , which is about 100 times higher than the case in the present-day universe (e.g., Omukai & Palla, 2003; Hirano et al., 2014). Mass accretion would stop when the stellar feedback becomes important, and then the stellar initial mass is determined. One of the most important stellar feedbacks is stellar UV radiation. When an accreting protostar settles on the zero-age main sequence (ZAMS) in thermal equilibrium, it radiates a large number of UV photons due to its high surface temperature. They evaporate the circumstellar accretion disk, which can prohibit further mass accretion (McKee & Tan, 2008; Hosokawa et al., 2011; Stacy et al., 2012). Mass accretion could also be restricted by strong radiation pressure, which counteracts the free-fall of gas onto the protostar (Omukai & Palla, 2001, 2003; Hosokawa & Omukai, 2009). This effect would be particularly important when the stellar luminosity reaches the Eddington limit.
Rotation is another potentially important factor in the feedback process of protostars (Tan & McKee, 2004). Recent hydrodynamic simulations indicate that Pop III protostars would be rapid rotators and they would gain most of their mass via an accretion disk (Stacy et al. 2011; Greif et al. 2012; see, however, Machida & Doi 2013). It is likely that the protostars would gain angular momentum along with mass, but the effect of rotation on the structure and evolution of mass-accreting protostars has not been much studied yet. Haemmerlé et al. (2013) followed the angular momentum evolution of massive protostars at solar metallicity. In this study, they enforced the angular velocity of the accreted material to be the same as that of the equatorial surface of the protostar, assuming strong magnetic torques between the protostar and the disk. However, Rosen et al. (2012) showed that magnetic braking of the protostar by the accretion disk is not efficient if the mass accretion rate is sufficiently high (i.e., ). This implies that Pop III protostars would easily reach the break-up velocity as shown by Stacy et al. (2011). Lin et al. (2011) investigated the role of gravitational torques between the protostar and the disk, finding that the rotational velocity of the protostar may be stabilized at around 50% of the Keplerian value under certain circumstances, which is not very far from the break-up value.
We note that such rapid rotation would have an important consequence in the protostar feedback. As a protostar becomes more massive, the surface luminosity increases to gradually approach the Eddington limit. In this case, the critical value of the rotational velocity for the break-up should decrease accordingly, and cannot be a Keplerian value any more (Langer, 1997). In other words, the Eddington limit should be modified with rapid rotation, as the critical luminosity can be achieved much before it reaches the classical Eddington limit because of the reduced effective gravity. This modified Eddington limit is nowadays often called the -limit in the literature (Maeder & Meynet, 2000).
To our knowledge, the role of the -limit has never been addressed in the previous work on the formation of massive stars. The purpose of this paper is therefore to discuss whether or not the -limit can have any impact on the protostar feedback during the formation of massive Pop III stars. In section 2 we present the evolutionary models of Pop III protostars with various accretion rates. In section 3 we discuss the evolution of angular momentum in the protostar and the possible role of the -limit in determining the initial mass of Pop III stars. We give a conclusion and brief summary in section 4.
2. Evolution of Pop III protostars with rapid mass accretion
2.1. Physical Assumptions
We constructed evolutionary models of Pop III protostars using the one-dimensional stellar evolution code MESA (Modules for Experiments in Stellar Astrophysics; Paxton et al., 2010, 2011, 2013)111http://mesa.sourceforge.net/. We first made a pre-main-sequence star model with . This pre-main-sequence model is constructed by using an polytrope with a given central temperature, lower than , and a given initial mass (Paxton et al., 2011, 2013). Then we evolved it with a constant mass accretion rate until it grew to . Mass fractions of chemical elements in the initial protostar model are set to be 0.23 for 4He, for 3He, for 2H, and the rest for 1H. The initial mass of may seem too high compared to the values adopted in many other calculations. For example, was used in Omukai & Palla (2003) and Hosokawa et al. (2010). But the time spent in accreting mass from to is much shorter than the total accretion time, and this difference in the initial mass would hardly affect the overall conclusions of our work. For example, Ohkubo et al. (2009) calculated accretion onto Pop III protostar with an initial mass of and their calculation shows good agreements with other results for a given mass accretion rate.
We first calculated the evolution at various constant mass accretion rates: , and . The accreted matter has the same chemical composition as the initial composition of the model. However, in the Universe the mass accretion rate is not constant. Observations on low-mass protostars such as T Tauri stars or FU Orionis stars indicate that the mass accretion history is episodic (Hartmann & Kenyon, 1996). This episodic mass accretion in the present universe is theoretically supported because it can solve the so-called luminosity problem, which means that observed low-mass protostars are less luminous than the expected accretion luminosity (Dunham et al., 2010). Hydrodynamic simulations on Pop III star formation show that fragmenation of the accretion disk results in highly time-dependent mass accretion rates (e.g., Clark et al., 2011; Smith et al., 2012; Stacy et al., 2013). We discuss its possible consequence in Sect. 3.6.
Here we treat rotation of the protostar as a post-process: we first calculate non-rotating evolutionary models of the mass-accreting protostar and then investigate the evolution of stellar angular momentum assuming rigid-body rotation in the protostar (see Sects. 3.1 and 3.2 for more details).
In this calculation, we follow the case of ‘cold disk accretion’ described originally in Palla & Stahler (1992) and recently in Hosokawa et al. (2010), which means that we adopt the photospheric boundary condition. In this case the matter accreted onto the protostar has the same entropy as the stellar surface (Hosokawa & Omukai, 2009; Hosokawa et al., 2010). We chose this boundary condition because theoretical studies imply that Pop III protostars accrete mass via an accretion disk (e.g., Stacy et al., 2010; Clark et al., 2011). However, there are some claims that the mass accretion rate in massive star formation is so high that the accreted matter cannot fully radiate its thermal energy away even under disk accretion due to inefficient cooling (Popham et al., 1993; Hosokawa et al., 2010). We discuss possible effects of higher thermal energy settlement on the stellar envelope in Sect. 3.5.
2.2. Result
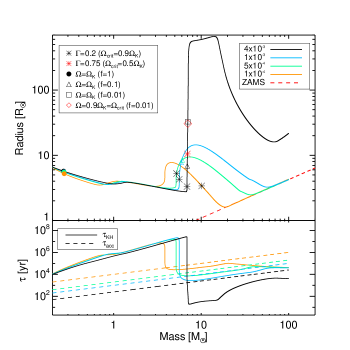
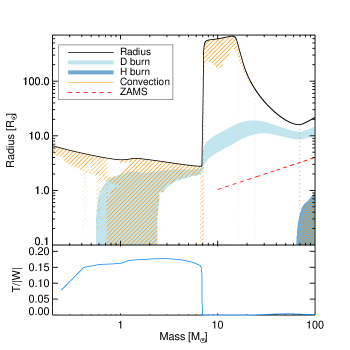
The overall evolution of the protostar for different accretion rates is shown in Figure 1. It is well known that, with a sufficiently high mass accretion rate, the radius of a protostar increases rapidly before growing grow to (Omukai & Palla, 2003; Hosokawa & Omukai, 2009). The mass where this rapid expansion occurs is generally higher for a higher mass accretion rate. The radius evolution before the rapid expansion phase in our calculation is slightly different from that of the fiducial model (MD3-D) of Hosokawa et al. (2010): the radius of our protostar model does not increase gradually but decreases until the rapid expansion occurs. This discrepancy may be attributed to the difference in the internal structure of the starting models, as discussed in Hosokawa et al. (2010) (see Figure 15 and Appendix A of their paper). This also leads to slightly different sizes of the convective core and the deuterium burning layer. In Figure 2 the detailed internal structure is shown for the model sequence with . We find that the convective core size and the deuterium burning layer before the envelope expansion are more similar to the case of MD3-D-b0.1 in Hosokawa et al. (2010) rather than to that of their fiducial model. However, this uncertainty is not important for the later phase of the evolution where the rapid envelope expansion occurs, which is the main concern of our study.
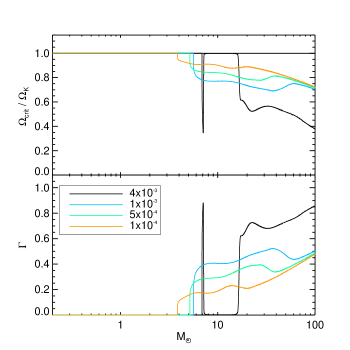
The rapid envelope expansion results from the transport of a large amount of energy during thermal readjustment to reach thermal equilibrium inside the protostar (Hosokawa et al., 2010). When this energy reaches the envelope, it swells to consume this huge energy input by expansion work. Hosokawa et al. (2010) show that extremely rapid envelope expansion occurs if the protostellar luminosity reaches or higher during the expansion and contraction phase. They suggest that the corresponding mass accretion rate for is . Such an extreme envelope expansion also appears in our model with in Figure 1. The Eddington luminosity decreases due to increasing surface opacity during the expansion, while the stellar luminosity increases quickly. The Eddington factor () accordingly increases steeply (Figure 3).
While the Eddington factor keeps increasing for most cases, its evolution after the steep increase is somewhat complicated for the case with . Unlike the other cases, the Eddington factor shows a local peak, then decreases nearly to zero, and rapidly increases again. In the case of , as the radius increases from to , the surface luminosity and temperature increase from to and to respectively. The surface opacity also changes from (cm2/g) to . After reaching the local peak of the Eddington factor, the radius remains relatively large until the protostar grows to 10, but the surface temperature cools down to which causes partial ionization on the envelope. This makes the surface opacity drop to and the Eddington factor decreases accordingly. This is the reason why, unlike the other cases, the Eddington factor in the model with soon decreases nearly to zero after the rapid expansion phase. As the protostar begins to contract at , the surface temperature rises and the Eddington factor increases again.
Unlike the other model sequences that follow the well-defined mass-radius relation of ZAMS stars in thermal equilibrium (hereafter, the ZAMS line) at about , the model sequence with does not converge to the ZAMS mass-radius relation. This is because thermal contraction after the rapid expansion phase is somewhat impeded by strong radiation pressure produced by this high mass accretion rate, as discussed by Omukai & Palla (2001), Omukai & Palla (2003) and Hosokawa & Omukai (2009). Hydrogen burning in the core in this case starts much later () as a result (see Figure 2). These authors also argued that if the mass accretion rate exceeds a certain threshold value such that the surface luminosity becomes close to the Eddington limit, no more steady accretion would be possible. Our result implies that this threshold value should be at zero metallicity (Figure 2), which is in good agreement with the previous works. However, several authors recently found solutions that allow formation of very massive Pop III stars () with higher accretion rates (Hosokawa et al., 2012, 2013; Schleicher et al., 2013).
3. Effect of rotation
The Keplerian angular velocity is defined as the angular velocity at the equatorial surface when the centrifugal force becomes comparable to the gravity (hereafter, the Keplerian limit). When radiation pressure becomes strong enough, i.e. when the surface luminosity approaches the Eddington luminosity, not only stellar rotation but also radiation pressure reduces the effective gravity. The corresponding critical rotation can become significantly slower than the Keplerian rotation (the so-called -limit), as discussed by Langer (1997), Glatzel (1998), and Maeder & Meynet (2000). In this section, we investigate under which conditions these limits can be reached in mass-accreting Pop III protostars and discuss the implications for their evolution.
3.1. Solid-body rotation of protostars
To investigate under what conditions Pop III protostars can reach the -limit, we assume here that a protostar accretes angular momentum along with mass. In this consideration, redistribution of angular momentum in the stellar interior is not explicitly included when solving the stellar structure equations. Instead, we simply assume that the protostar rotates as a solid body. We do not consider the effect of the centrifugal force on the stellar structure either, but with solid-body rotation, the radius change with rotation for a given stellar mass would be limited to about 40% compared to the non-rotating case (e.g., Monaghan & Roxburgh, 1965), which does not significantly affect the main conclusions of our study.
The assumption of solid-body rotation presupposes rapid redistribution of angular momentum inside the protostar. In convective regions, angular momentum transport occurs on a dynamical timescale, which is much shorter than . As shown in Figure 2, our protostar models become fully convective when , for which solid-body rotation can be easily established. Even in the radiative layers that are found when and , a few different mechanisms still can lead to rapid transport of angular momentum. Spruit (2002) argues that the interplay between amplification of toroidal magnetic fields by differential rotation and creation of poloidal magnetic fields by the Tayler instability can result in dynamo actions (the so-called Tayler-Spruit dynamo), which can impose nearly flat rotation inside stars via magnetic torques (Spruit, 2002; Heger et al., 2005; Maeder & Meynet, 2005). Rapid angular momentum redistribution inside stars is also implied by many observations including the spin rates of isolated white dwarfs and young neutron stars and the internal rotation profiles of low-mass stars inferred from asteroseismological data (e.g. Heger et al., 2005; Eggenberger et al., 2005; suijs08; Eggenberger et al., 2012; Cantiello et al., 2014).
Even if magnetic torques are negligible, the transport of angular momentum can occur via Eddington-Sweet circulations (Meynet & Maeder, 1997; Haemmerlé et al., 2013). No significant chemical stratification is present in Pop III protostars, and therefore Eddington-Sweet circulations would not be inhibited by the effect of the chemical gradient (Meynet & Maeder, 1997). The timescale of angular momentum transport in this case would be comparable to the Kelvin-Helmholtz timescale () (e.g., Kippenhahn & Weigert, 1990). In our model sequences, this timescale remains much longer than the accretion timescale () until the rapid expansion phase, but it decreases rapidly once the rapid expansion occurs because of the dramatic increase in both the luminosity and the radius, leading to (Figure 1). Even without the effect of magnetic fields, the rotation profile in the protostar would not be far from the solid-body rotation after the rapid expansion phase, which is most relevant to our discussion on the -limit below.
On the other hand, with slow angular momentum transport, most of the accreted angular momentum would be stored in the outer layers. As a result, the equatorial surface of the accreting protostar would reach the critical velocity earlier than in the case of solid-body rotation. The assumption of solid-body rotation therefore offers the upper limit to when the accreting star reaches the critical velocity.
3.2. Angular momentum of accreting materials
The accretion disk should rotate roughly at the Keplerian angular velocity. Accreted mass elements should carry angular momentum of the Keplerian value (). It is well known that an initially non-rotating star reaches the Keplerian rotation soon after the onset of mass accretion (Shu et al., 1988; Paczýnski, 1991). In Figure 1 such points for all the model sequences are plotted as filled circles. In all cases, the Keplerian rotation is reached very quickly at around 0.3. However, it might be possible that some matter is accreted with non-Keplerian angular momentum, losing some portion of the angular momentum by magnetic torques or turbulent viscous stress. Here we define the angular momentum accretion efficiency as the ratio of the accreted angular momentum to the Keplerian value:
| (1) |
The points where the surface rotation reaches the Keplerian value for an accretion efficiency of are marked in Figure 1. It is noticeable that even under such conditions the accreting protostar can reach the Keplerian rotation well before the onset of core hydrogen burning. For the case of , however, most of the models do not reach the Keplerian rotation. Only the model with can reach the Keplerian rotation when the envelope expands rapidly. Although the expansion of the envelope tends to make the outermost layer spin down because of angular momentum conservation, rapid transport of angular momentum from the inner layers to the envelope (with our assumption of solid-body rotation) can compensate it. On the other hand, decreases with increasing radius. These factors make the protostar reach the critical rotation more easily with more significant expansion of the envelope.
While the accreting protostar can reach the Keplerian rotation quickly, the existence of massive young stellar objects explicitly implies that there must be some mechanisms that enable mass accretion even after reaching the Keplerian value or that can keep the rotation velocity of the accreting star significantly below the Keplerian limit. According to accretion theories, if the stellar magnetic field is strong enough, the central star accretes mass along strong magnetic field lines that are connected to the accretion disk. During mass accretion, magnetic torques induced by twisted magnetic field lines in the accretion disk can remove angular momentum from the central star and spin it down significantly below the Keplerian limit (Shu et al., 1994; Matt & Pudritz, 2005). This mechanism is often called ”disk-locking”. However, the efficiency of disk-locking may depend on the mass accretion rate. Rosen et al. (2012) showed that the magnetic coupling cannot be maintained for a mass accretion rate higher than about . As a result stellar angular momentum is not effectively eliminated and massive stars would become rapid rotators. Since Pop III stars are expected to have a very high mass accretion rate, disk-locking via magnetic fields may not play an important role in eliminating stellar angular momentum.
On the other hand, Lin et al. (2011) investigated the role of gravitational torques in the spin-down of a protostar that accretes matter via an accretion disk. In their simulations, the rotational speed of the protostar does not exceed 50% of the Keplerian value. This is because the protostar undergoes significant deformation of its shape as it spins up, which in turn enhances the efficiency of gravitational torques that slow it down. This deformation of the protostar presumably resulted from the bar-mode instability, given the very high ratio of the rotational energy () to the gravitational energy (; i.e., in Figure 11 of Lin et al. 2011; e.g., Chandrasekhar 1969). However, with our assumption of solid-body rotation, the value of the protostar remains below 0.2 throughout the evolution, and it becomes close to zero once the rapid expansion phase starts as shown in Figure 2, for which the bar-mode type instability may not easily occur (Chandrasekhar, 1969). Since we have assumed solid-body rotation and the protostar is rotating at the Keplerian value, the ratio is given by the following equation,
| (2) | |||||
| (3) |
since , where denotes the coefficient of the moment of inertia and is the gravitational potential energy constant. This means that, with our assumption of solid-body rotation, the rapid change in the ratio is due solely to the envelope expansion. This change in structure occurs on a timescale much shorter than the thermal timescale (1), but it is possible to maintain solid-body rotation during this phase with magnetic torques as discussed above.
This implies that the deformation of the protostar would be much weaker than what is found in the simulations of Lin et al. (2011) once the rapid expansion occurs, and it would be difficult for gravitational torques to efficiently keep the protostar rotation significantly below the Keplerian value. We ignore the effect of gravitational torques in most discussions below, but its possible consequence is briefly discussed in Sects. 3.4 and 3.5.
3.3. Mass and angular momentum accretion at the Keplerian limit
Colpi et al. (1991), Paczýnski (1991), and Popham & Narayan (1991) (hereafter CPP) investigated whether the protostar can accrete matter at the Keplerian limit, using polytropic star-disk models. They introduced viscous stress with the -description to deal with the exchange of angular momentum between the star and the disk. In this case, the angular momentum accretion rate can be given by
| (4) |
where denotes the column density of the disk, the kinematic coefficient of viscosity in the standard -description, the distance from the center of the star, and the local angular velocity (Popham & Narayan, 1991). The angular velocity gradient in the above equation is the key term in our discussion. Regardless of the way in which viscous stress is applied and described, all the approaches in CPP have this gradient term in common. While all the other variables (e.g. ) are always positive, only can have a negative value.
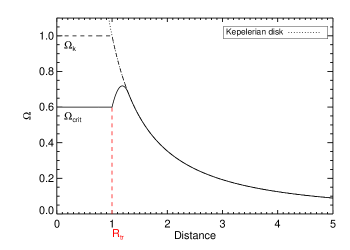
Before accretion begins, the protostar would be practically non-rotating. As angular momentum is accreted along with mass accretion via the Keplerian disk, the rotation rate gradually increases. The sign of remains positive across the boundary between the star and the disk, as long as the star rotates at a sub-Keplerian value. Then the protostar would soon reach the Keplerian limit (). This situation is depicted schematically with a dashed line in Figure 4. At this point, the sign of at the boundary between the star and the disk becomes negative, and the angular momentum accretion rate () can become close to zero or even have a negative value. This means that angular momentum could be transferred outward from the star to the disk while mass is accreted from the disk to the star.
CPP indeed found that, as the accreting star approaches the Keplerian rotation, the angular momentum accretion rate drops drastically to zero and then soon becomes negative. According to Popham & Narayan (1991), the angular momentum accretion rate becomes negative when the stellar rotation exceeds about 0.914 . This sudden change results from the change in sign of in Equation (4), as the angular velocity profiles in Paczýnski (1991) show. It means that mass accretion can continue even if the protostar reaches the limit.
3.4. The -limit and the initial mass of a Pop III star
As shown above, the surface luminosity of the protostar becomes very high during the rapid expansion phase. If the surface luminosity approaches the Eddington limit (), the critical rotation rate becomes significantly lower than the Keplerian value (Langer, 1997; Glatzel, 1998; Maeder & Meynet, 2000). To precisely determine the consequent critical rotation, we have to consider force balance between gravitational, radiative, and centrifugal forces, gravity darkening due to rotation, and multi-dimensional effects of energy transport (e.g., Tassoul, 2000; Lovekin et al., 2006). In the following section (Sect. 3.4.1) we first consider the simplified approach of Langer (1997) where gravity darkening due to rotation is neglected. Then we discuss the effect of gravity darkening that was investigated by Glatzel (1998) and Maeder & Meynet (2000) in Sect. 3.4.2. As discussed below, these two cases would represent two extreme boundaries for the critical rotation: the former and the latter give the lowest and highest critical rotation rates, respectively, for a given Eddington factor . In other words, the critical luminosity for a given rotational velocity (i.e., the modified Eddington limit with rapid rotation) would be lowest and highest for the former and latter cases, respectively.
3.4.1 The simplified case without gravity darkening
Consideration of the balance between gravitational, radiative, and centrifugal forces leads to the modified critical rotation velocity at the equatorial surface as
| (5) | |||||
| (6) |
(Langer, 1997). In this case, the accreting protostar would reach break-up, for example, at if . This example () is schematically illustrated in Figure 4. While stellar rotation reaches break-up, in the layer across the boundary between the star and the Keplerian disk would remain still positive, as long as decreases sharply from the stellar surface along the boundary layer. This assumption of a rapid decrease in can be justified for two reasons. First, the infalling material must be optically thick with the considered accretion rate (), and the contribution of the stellar radiation to the force balance inside the boundary layer would be negligible. Second, the accretion luminosity produced in the boundary layer, which is given by
| (7) |
where and denote the stellar mass and radius, respectively (e.g., Gilfanov & Sunyaev, 2014), is expected to be much lower than the Eddington luminosity for a sufficiently high ratio of . For example, with and , we have during the rapid envelope expansion phase (i.e., and ). Therefore, it is likely that has a positive value in the boundary layer as assumed in Figure 4. Note also that the transport of angular momentum as described by Equation (4) is irrelevant to the Eddington factor. Once the star reaches the limit, therefore, mass accretion cannot continue by transporting angular momentum outward from the star to the disk, in contrast to the case of the Keplerian limit: a solution with and no longer exists.
This transition from the Keplerian limit to the limit occurs when radiation pressure becomes important. Here we define the critical Eddington factor () as the Eddington factor when the mass accretion cannot continue with the same because of a large positive value of in the boundary layer at the break-up velocity. We can roughly infer the value of from Popham & Narayan (1991), who found that for . In other words, it becomes difficult to find a solution with for a given positive if . Given that , this limit corresponds to . If the protostar reaches the critical rotation with , therefore, mass accretion would not continue with the same accretion rate. In other words, the protostar that was previously rotating at would be able to adjust its rotation velocity down to about by transporting angular momentum outward until the Eddington factor increased from to . Further accretion beyond this point would not be possible unless the accretion rate were altered.
The protostar mass when reaches (=0.2) is marked in Figure 1 with black asterisks. Except for the case of , all the models reach soon after the rapid expansion phase starts. The corresponding mass is about 5.5 – 7.0 . Note that this critical mass is not sensitive to the choice of because of the steep increase in the Eddington factor during the rapid expansion phase. For example, in the case of the masses when and differ by only about (corresponding to only about 1 yr). Therefore, even if we assumed that the protostar is kept rotating at due to the gravitational torques (Lin et al., 2011), the protostar would inevitably reach the limit as long as the mass accretion rate is sufficiently high ().
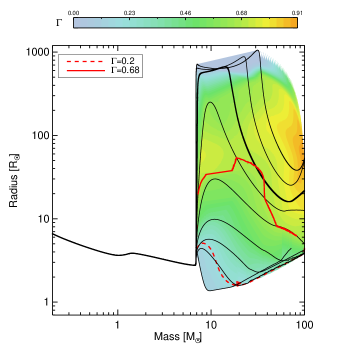
After reaching the critical Eddington factor, further mass accretion would still be possible if the mass accretion rate decreased to maintain . To make a conjecture on how the mass accretion should be adjusted, we additionally calculated the evolution with several arbitrarily changed mass accretion rates (i.e., , , , , , , , and ), from the point when reaches with . Although we expect a decrease in once is reached, a few higher accretion rates are also considered in the figure for comparison. Evolutionary tracks of these models are shown in Figure 5. By interpolating the obtained Eddington factor for each mass accretion rate, we could obtain the ‘isogamma’ contour. As long as the mass accretion rate is not further decreased by the stellar UV feedback, the evolution of the protostar would follow this isogamma contour and the corresponding mass on the ZAMS line would be . In other words, the ZAMS mass would be determined by the point where the ZAMS star in thermal equilibrium has the corresponding critical Eddington factor, if the stellar UV feedback was ignored. As implied by Figure 6, however, it is likely that the UV feedback gradually becomes important as the star approaches the ZAMS line such that the ZAMS mass may be determined at a somewhat lower value (see discussion below and Hosokawa et al., 2011).
3.4.2 The effect of gravity darkening
von Zeipel (1924) showed that radiative energy flux is proportional to the gradient of the effective potential in rotating stars (the von Zeipel theorem). With rapid rotation, this can lead to a significant variation of luminosity and effective temperature with latitudinal position on the stellar surface, and the equatorial region would be less luminous than the polar region. This so-called gravity darkening would make the critical Eddington factor () higher than what we assumed in the above discussion. Glatzel (1998) and Maeder & Meynet (2000) indeed found that the limit can be reached only when if gravity darkening is taken into account. For example, in the case of (see above) the corresponding critical Eddington factor would be according to the prescription by Maeder & Meynet (2000), compared to with Langer’s approach.
The caveat here is that both observations and multi-dimensional studies indicate less strong gravity darkening in rotating stars than what the von Zeipel theorem predicts (e.g., Lovekin et al., 2006; Che et al., 2011). This would be because of multi-dimensional effects of energy transport (i.e., non-radial radiative energy flux and/or meridional circulations driven by thermal imbalance in rotating stars; Tassoul 2000), which are not considered in the von Zeipel theorem. The actual value of in reality would be between 0.2 and 0.68. Precise derivation of is beyond the scope of this study, and here we only consider the limiting value of in our discussion below. 222 Note also that the von Zeipel theorem cannot be applied in the layers where energy transport is dominated by convection. Sub-surface convection zones are developed in some of our models (in particular the case with ; see Figure 2), but we find that the convective energy transport in those layers is too weak compared to the radiative energy transport during the expansion phase when the surface luminosity rapidly increases. The role of convection may be neglected in our discussion.
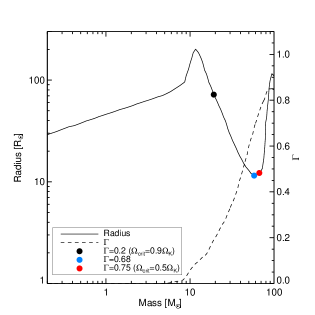
Figure 5 shows how the evolution of a protostar with an initial mass accretion rate of would be influenced by the limit with (see the evolutionary track marked by the red solid line). The mass accretion rate would decrease to when the star reaches the limit at . The radius would still keep increasing slowly until . The star would undergo gradual contraction toward the ZAMS line thereafter. This implies that the limit may effectively prevent the protostar from expanding to a very large radius.
In reality, UV feedback would become important before the star reaches the ZAMS line. Figure 6 indicates that the number of ionizing photons per unit time () emitted from the protostar would become larger than when if the protostar follows the evolutionary track along the isogamma line with . Hosokawa et al. (2011) considered Pop III protostar evolution with accretion rates of , and investigated the UV feedback on the accretion process. Their result shows that UV photons can effectively photoevaporate the surrounding material, and that the mass accretion rate can be greatly reduced when and the mass accretion practically stopping when significantly exceeds . In our considered case, continues to increase to when along the isogamma line with (Figure 6). This implies that the resulting mass on the ZAMS line would not be significantly higher than about . Of course, the extrapolation of Hosokawa et al.’s result to our considered case needs to be justified with a more sophisticated multi-dimensional simulation.
In the case of steady accretion with , on the other hand, the rapid Kelvin-Helmholtz contraction from makes the star gradually hotter, and is reached when . This implies that the resulting final mass on the ZAMS line would not be much different from the case where the effect of limit is considered, if the further evolution from this point was dominated by the effect of UV feedback. For higher accretion rates, however, the points when are significantly delayed compared to the case of the limit. Note also that is the upper limit and the actual value would be significantly lower as discussed above, and that in reality the role of the limit would be more important than in this limiting case of .

Recently, Hosokawa et al. (2012) showed that with very high accretion rates (), Pop III protostars can remain fluffy with an effective temperature below for most of the mass accretion phase. The resultant UV feedback is very weak, and the protostar can easily grow beyond 1000 . As implied by Figures 5 and 6, this conclusion may be modified with the effect of the limit, which would not allow the protostar to become a supergiant by lowering the accretion rate.
In short, our discussion leads to the following conclusion about the initial mass of Pop III stars. As shown in the previous work (e.g., Omukai & Palla, 2003; Hosokawa et al., 2012, see also Figure 1), a very high mass accretion rate () provides a favorable condition for the formation of very massive Pop III stars (). However, with such a high mass accretion rate, the protostar may reach the limit very easily (see Figures 1 and 3), and further growth in mass would be significantly slowed down thereafter. If mass accretion is the dominant mode of Pop III star formation, very massive stars with would be difficult to form. Our argument should be confirmed by future work with a more quantitative analysis including multi-dimensional effects.
It is also important to remark that rapid expansion of the protostar that is found with steady accretion with would result in Roche-lobe overflow if a companion protostar existed within a sufficiently short orbit, significantly affecting the final orbital period and mass ratio (cf. Stacy et al., 2010). As shown in Figure 5, the limit can prevent the protostar from expanding beyond , depending on the value of (Figure 5). This would therefore have consequences in the formation process of Pop III binary systems.
3.5. Effect of hot accretion
We assumed cold disk accretion in the above discussion. While the assumption of disk accretion seems reasonable, the thermal energy of accreted mass may not be fully radiated away during accretion if the mass accretion rate is sufficiently high, and the accreted matter may be hotter than the surface of the star (Hosokawa et al., 2010). Previous calculations indicate that the protostar’s radius becomes generally larger with hot accretion than in the case of cold accretion (Omukai & Palla, 2003; Hosokawa et al., 2010).
The MESA code does not provide an option for hot accretion. Instead of performing detailed calculations, we use the data available in Omukai & Palla (2003) to investigate the effect of hot accretion in more detail. Their fiducial model adopts and . Their underlying assumption was spherical accretion with the shock boundary condition, but this result can also be roughly applied for the case of hot disk accretion (Hosokawa et al., 2010). Given that the moment of inertia becomes very small with such a fluffy structure with hot accretion, the protostar would easily reach the critical rotation rate by mass and angular momentum accretion (see above in Sect. 3.2).
Figure 7 indicates that our limiting values of and 0.68, from which the mass accretion rate is expected to decrease rapidly, can be achieved at . Therefore, the problem of the limit we discussed above still remains to be resolved even with hot accretion, for the protostar to rapidly grow beyond this point by mass accretion. If gravitational torques could retain , the limit would be reached only at (i.e.,; see Figure 7), which can alleviate the problem. However, a very low is generally expected in such a protostar having a fluffy structure (; see Figure 2) , and gravitational torques due to deformation of the protostar may not be efficient in this case (see the discussion in Sect. 3.2).
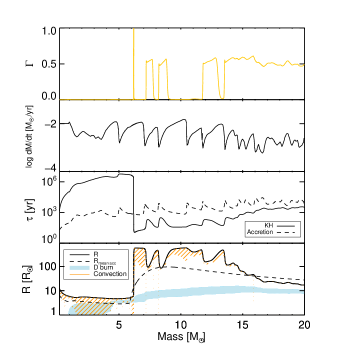
3.6. Effect of episodic mass accretion
In reality, mass accretion would not be steady but episodic (e.g., Hartmann & Kenyon, 1996). To investigate the effect of episodic mass accretion, we adopted the time-dependent mass accretion rate of Smith et al. (2012) with the MESA code, and followed the evolution of the protostar until (see Figures 2 and 6 of Smith et al. (2012)). We find earlier envelope expansion in our result (Figure 8) than what is shown by Figure 6 of Smith et al. (2012), presumably because of the different boundary condition. Compared to the evolution with the time-averaged mass accretion rate, the envelope expansion becomes much more significant in the episodic case. Interestingly, the surface luminosity reaches the Eddington limit in the first rapid expansion phase, because of the very high temporal mass accretion rate () around this time. We conclude that episodic mass accretion would make the protostar reach the limit more easily than in the corresponding case of steady mass accretion.
4. Conclusions
In the present study, we argued that the limit (or the modified Eddington limit; Langer 1997; Maeder & Meynet 2000) is potentially very important for the evolution of Pop III protostars that accrete mass at a very high rate ().
Our argument can be summarized as follows. Given that magnetic braking may not be efficient with this high accretion rate (Rosen et al., 2012), mass accretion via an accretion disk can easily make the protostar reach the Keplerian rotation (Sect. 3). Mass accretion may continue by transporting angular momentum from the star to the disk even at the Keplerian rotation, as long as the luminosity of the protostar is negligibly low compared to the Eddington limit (Colpi et al., 1991; Paczýnski, 1991; Popham & Narayan, 1991). Rapid mass accretion, however, leads to rapid expansion of the protostar when its mass reaches about (Figure 1), and the Eddington factor becomes large () as the surface luminosity increases rapidly. From this point, the rotation of the protostar should be significantly below the Keplerian limit () as imposed by the limit. The outward transport of angular momentum from the protostar to the disk would become difficult as a result, prohibiting further rapid mass accretion (Sect. 3.4): it is therefore expected that a Pop III protostar that accretes matter via an accretion disk may not grow significantly beyond 20 – 40 , depending on the degree of gravity darkening and UV feedback (Sects. 3.4, 3.5 & 3.6). Other mechanisms like binary mergers may be needed for the formation of very massive Pop III stars () as progenitors of pair-instability supernovae and seeds for supermassive black holes that are found at high redshift.
The limit would also have an important impact on the radius of a PopIII protostar: it would remain relatively compact () throughout the mass accretion phase. This effect should be considered in future studies on the formation of PopIII binary systems, because binary interactions during the protostar phase would become more difficult with a smaller protostar.
We conclude that the limit would have significant impact on the IMF and the formation process of binary Pop III stars. Our discussion focusses on Pop III stars for which the mass accretion rate is expected to be systematically higher than in the present-day star-forming regions, but the limit must also be relevant to the formation of massive stars by disk accretion in the local universe because the underlying physics is essentially the same. We suggest that this issue should be seriously addressed in future studies on the formation of massive stars in a more general context.
References
- Bromm et al. (2001) Bromm, V., Kudritzki, R. P., & Loeb, A. 2001, ApJ, 552, 464
- Bromm & Yoshida (2011) Bromm, V., & Yoshida, N. 2011, ARA&A, 49, 373
- Cantiello et al. (2014) Cantiello, M., Mankovich, C., Bildsten, L., Christensen-Dalsgaard, J., & Paxton, B. 2014, ApJ, 788, 93
- Chandrasekhar (1969) Chandrasekhar, S. 1969, Ellipsoidal Figures of Equilibrium, Yale University Press
- Che et al. (2011) Che, X., Monnier, J.D., & Zhao, M. et al. 2011, ApJ, 732, 68
- Clark et al. (2011) Clark, P. C., Glover, S. C. O., Klessen, R., & Bromm, V. 2011, ApJ, 727, 110
- Colpi et al. (1991) Colpi, M., Nannurelli, M., & Calvani, M. 1991, MNRAS, 253, 55
- Dunham et al. (2010) Dunham, M. M., Evans, N. J., II, Terebey, S., Dullemond, C. P., & Young, C. H. 2010, ApJ, 710, 470
- Eggenberger et al. (2005) Eggenberger, P., Maeder, A., & Meynet, G. 2005, A&A, 440, L9
- Eggenberger et al. (2012) Eggenberger, P., Montalb’an, J. & Miglio, A. 2012, A&A, 544, L4
- Gilfanov & Sunyaev (2014) Gilfanov, M.R., & Sunayaev, R.A. 2014, Physics-Uspekhi, 57, 377
- Glatzel (1998) Glatzel, W. 1998, A&A, 339, L5
- Greif et al. (2012) Greif, T. H., Bromm, V., Clark, P. C., et al. 2012, MNRAS, 424, 399
- Hartmann & Kenyon (1996) Hartmann, L., & Kenyon, S. J. 1996, ARA&A, 34, 207
- Haemmerlé et al. (2013) Haemmerlé, L., Eggenberger, P., Meynet, G., Maeder, A., & Charbonnel, C. 2013, A&A, 557, A112
- Heger et al. (2005) Heger, A., Woosley, S. E., & Spruit, H. C. 2005, ApJ, 626, 350
- Heger & Woosley (2010) Heger, A., & Woosley, S. E. 2010, ApJ, 724, 341
- Hirano et al. (2014) Hirano, S., Hosokawa, T., Yoshida, N., et al. 2014, ApJ, 781, 60
- Hosokawa & Omukai (2009) Hosokawa, T., & Omukai, K. 2009, ApJ, 691, 823
- Hosokawa et al. (2010) Hosokawa, T., Yorke, H. W., & Omukai, K. 2010, ApJ, 721, 478
- Hosokawa et al. (2011) Hosokawa, T., Omukai, K., Yoshida, N., & Yorke, H. W. 2011, Science, 334, 1250
- Hosokawa et al. (2012) Hosokawa, T., Omukai, K., & Yorke, H. W. 2012, ApJ, 756, 93
- Hosokawa et al. (2013) Hosokawa, T., Yorke, H. W., Inayashi, K., Omukai, K. & Yoshida, N. 2013, ApJ, 756, 93
- Kippenhahn & Weigert (1990) Kippenhahn, R., & Weigert, A. 1990, Stellar Strucgture and Evolution, Springer-Verlag
- Langer (1997) Langer, N. 1997, in ASP Conf. Ser. 120, Luminous Blue Variables: Massive Stars in Transition, ed. A. Notta & H. J. G. L. M. Lamers (San Francisco : ASP), 83
- Limongi & Chieffi (2012) Limongi, M., & Chieffi, A. 2012, ApJS, 199, 38
- Lin et al. (2011) Lin, M.-K., Krumholtz, M.R., & Kratter, K.M. 2011, MNRAS, 416, 580
- Lovekin et al. (2006) Lovekin, C. C., Deupree, R. G., & Short, C. I. 2006, ApJ, 643, 460
- Machida & Doi (2013) Machida, M. N., & Doi, K. 2013, MNRAS, 435, 3283
- McKee & Tan (2008) McKee, C. F., & Tan, J. C. 2008, ApJ, 681, 771
- Maeder & Meynet (2000) Maeder, A., & Meynet, G. 2000a, A&A, 361, 159
- Maeder & Meynet (2005) Maeder, A., & Meynet, G. 2005, A&A, 440, 1041
- Matt & Pudritz (2005) Matt, S., & Pudritz, R. E. 2005, MNRAS, 356, 167
- Meynet & Maeder (1997) Meynet, G., & Maeder, A. 1997, A&A, 321, 465
- Monaghan & Roxburgh (1965) Monaghan, F.F., & Roxburgh, I.W. 1965, MNRAS, 131, 13
- Nomoto et al. (2013) Nomoto, K., Kobayashi, C., & Tominaga, N. 2013, ARA&A, 51, 457
- Ohkubo et al. (2009) Ohkubo, T., Nomoto, K., Umeda, H., Yoshida, N., & Tsuruta, S. 2009, ApJ, 706, 1184
- Omukai & Palla (2001) Omukai, K., & Palla, F. 2001, ApJ, 561, L55
- Omukai & Palla (2003) Omukai, K., & Palla, F. 2003, ApJ, 589, 677
- Paczýnski (1991) Paczýnski, B. 1991, ApJ, 370, 597
- Palla & Stahler (1992) Palla, F., & Stahler, S. W. 1992, ApJ, 392, 667
- Paxton et al. (2010) Paxton, B., Bildsten, L., Dotter, A., et al. 2010, Astrophysics Source Code Library, ascl:1010.083
- Paxton et al. (2011) Paxton, B., Bildsten, L., Dotter, A., et al. 2011, ApJS, 192, 3
- Paxton et al. (2013) Paxton, B., Cantiello, M., Arras, P., et al. 2013, ApJS, 208, 4
- Popham & Narayan (1991) Popham, R., & Narayan, R. 1991, ApJ, 370, 604
- Popham et al. (1993) Popham, R., Narayan, R., Hartmann, L., & Kenyon, S. 1993, ApJ, 415, L127
- Rosen et al. (2012) Rosen, A. L., Krumholz, M. R., & Ramirez-Ruiz, E. 2012, ApJ, 748, 97
- Schleicher et al. (2013) Schleicher, D.R.G., Palla, F., Ferrara, A., Galli, D., & Latif, M. 2013, A&A, 558, 59
- Shu et al. (1988) Shu, F. H., Lizano, S., Ruden, S. P., & Najita, J. 1988, ApJ, 328, L19
- Shu et al. (1994) Shu, F., Najita, J., Ostriker, E., et al. 1994, ApJ, 429, 781
- Smith et al. (2012) Smith, R. J., Hosokawa, T., Omukai, K., Glover, S. C. O., & Klessen, R. S. 2012, MNRAS, 424, 457
- Spruit (2002) Spruit, H. C. 2002, A&A, 381, 923
- Stacy et al. (2010) Stacy, A., Greif, T. H., & Bromm, V. 2010, MNRAS, 403, 45
- Stacy et al. (2011) Stacy, A., Bromm, V., & Loeb, A. 2011, MNRAS, 413, 543
- Stacy et al. (2012) Stacy, A., Greif, T. H., & Bromm, V. 2012, MNRAS, 422, 290
- Stacy et al. (2013) Stacy, A., Greif, T. H., Klessen, R. S., Bromm, V., & Loeb, A. 2013, MNRAS, 431, 1470
- Suijs et al. (2008) Suijs, M.P.L., Langer, N., Poelarends, A.-J., Yoon, S-C., Heger, A., & Herwig, F. 2008, A&A, 481, 87
- Susa et al. (2014) Susa, H., Hasegawa, K., & Tominaga, N. 2014, ApJ, 792, 32
- Tan & McKee (2004) Tan, J. C., & McKee, C. F. 2004, ApJ, 603, 383
- Tassoul (2000) Tassoul, J. 2000, Stellar Rotation, Cambridge Univ. Press
- Tumlinson & Shull (2000) Tumlinson, J., & Shull, J. M. 2000, ApJ, 528, L65
- von Zeipel (1924) von Zeipel, H. 1924, MNRAS, 84, 665
- Yoon et al. (2012) Yoon, S.-C., Dierks, A., & Langer, N. 2012, A&A, 542, A113