Molecular-scale Description of SPAN80 Desorption from the Squalane-Water Interface
Abstract
Extensive all-atom molecular dynamics calculations on the water-squalane interface for nine different loadings with sorbitan monooleate (SPAN80), at K, are analyzed for the surface tension equation of state, desorption free energy profiles as they depend on loading, and to evaluate escape times for absorbed SPAN80 into the bulk phases. These results suggest that loading only weakly affects accommodation of a SPAN80 molecule by this squalane-water interface. Specifically, the surface tension equation of state is simple through the range of high tension to high loading studied, and the desorption free energy profiles are weakly dependent on loading here. The perpendicular motion of the centroid of the SPAN80 head-group ring is well-described by a diffusional model near the minimum of the desorption free energy profile. Lateral diffusional motion is weakly dependent on loading. Escape times evaluated on the basis of a diffusional model and the desorption free energies are s (into the squalane) and h (into the water). The latter value is consistent with irreversible absorption observed by related experimental work.
I Introduction
COREXIT 9500 is a standard dispersant used in response to oil spills dis (2005). Confronting molecular-scale theory, the formulation of COREXIT 9500 is non-trivial and has evolved to address issues identified by decades of experience Riehm and McCormick (2014). Therefore, this material provides context for development of theory, in addition to experiment and simulation, that might provide molecular insight into the structure and function of oil-water-surfactant systems.
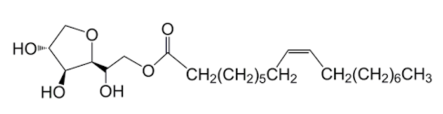
COREXIT 9500 includes sorbitan monooleate (SPAN80, FIG. 1), an ethoxylated sorbitan monooleate (TWEEN80), the anionic surfactant sodium dioctyl sulfosuccinate (NaDOS), and alkane solvent (NORPAR 13) dis (2005). Each of these components, and their proportions, have been chosen to achieve design characteristics Riehm and McCormick (2014). In each case, the statistical mechanical theory that would provide quantitative molecular-scale explanation is unavailable. NaDOS provides one example: the molecular theory of electrolyte effects on the thermodynamics, structure and dynamics of aqueous solution interfaces is a long-standing Nichols and Pratt (1982); Wilson et al. (1984); Nichols and Pratt (1984) and current research target Jungwirth and Cremer (2014). As another example, the specific structural and dynamical description of the ethoxylated chains attached to the TWEEN80 head-group, and the contrast to the SPAN80 case, is not available though this is an area of significant recent interest Alessi et al. (2005); Norman et al. (2007, 2007); Chaudhari et al. (2014, 2015).
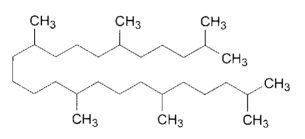
In building the basic molecular theory, it is natural to study the effects arising from the several components separately, and then to study their various interactions. Here we study the solution interface between water and a model oil phase, with SPAN80 at a wide range of loadings. We follow the experimental work of Reichert and Walker Reichert and Walker (2013) in adopting squalane as the model oil phase, though they treated TWEEN80 without SPAN80, and water with non-zero NaCl electrolyte concentration to correspond to seawater. We start with SPAN80 alone because that is simpler, but further complicating features might be added after this initial step Kirby et al. (2015).
An intriguing aspect of the experimental work Reichert and Walker (2013) was the demonstration of irreversible absorption behavior of TWEEN80 for surface tensions above a critical value near 32 mN/m, i.e., for low surface loadings. That behavior was observed to be independent of the ionic strength of the aqueous phase. Operational irreversibility might be traced to rates of desorption, and those rates might be influenced by entanglement of the ethoxylated head-group of the TWEEN80 surfactant. Evaluating desorption rates for SPAN80 at this interface provides a baseline result for considering the TWEEN80 case, and those baseline results are a target of the work which follows below.
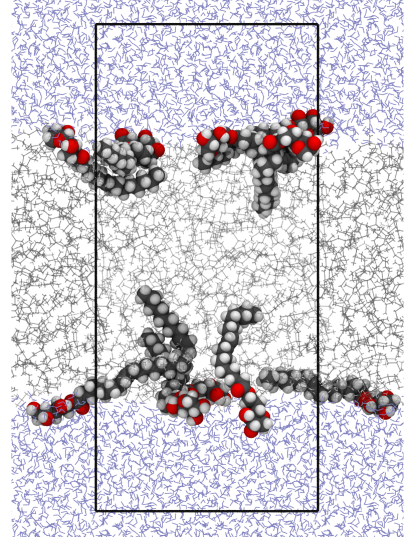
The most important step in determining desorption rates is to establish the free energy profile for the process. Here, we obtain free energies of desorption of SPAN80 from the water-squalane interface, stratifying the free energy changes with a standard windowing approach and exploiting parallel tempering Earl and Deem (2005) to investigate sampling sufficiency for the individual strata. FIG. 2 shows the case with 5 SPAN80 molecules absorbed at each interface. The windowing not only provides the free energy profile for the desorption but also the net free energy for the transfer of a SPAN80 molecule from water to squalane. Methodological specifics are collected in Sec. IV below, except where they are pertinent to an isolated facet of the results. Preceding simulations studied SPAN80 micelles in the context of drug delivery applications Han (2013).
A distinguishing aspect of our work is that it is that all-atom models are treated exclusively, in contrast to coarse-grained models implemented in CHARMM Bjelkmar et al. (2010), MARTINI Marrink et al. (2007) and SDK packages Shinoda et al. (2008). Important work on escape times of nonionic surfactants from micelles and hydrophobic surfaces has featured coarse-grained MD models Yuan et al. (2015). The present work is restricted to planar interfaces.
II Results and Discussion
Surface tensions were obtained standardly (Sec. IV) from molecular dynamics simulations for nine surface loadings (FIG. 3). When the absorption vanishes, the surface tension (FIG. 3) agrees well with experiment Reichert and Walker (2013), and the surface tensions decrease with increasing as expected. Comparing the standard MD results with parallel tempering values (FIG. 4) shows consistent behavior and remarkable simplicity over our whole range of loadings. A maximum loading for SPAN80 naturally should be higher than the maximum loading for TWEEN80, but for our strongly loaded case is about a factor of three (3) higher than the estimated maximum surface coverage for TWEEN80 Reichert and Walker (2013). A weakly loaded regime is identified for about 10% of our highest loading.

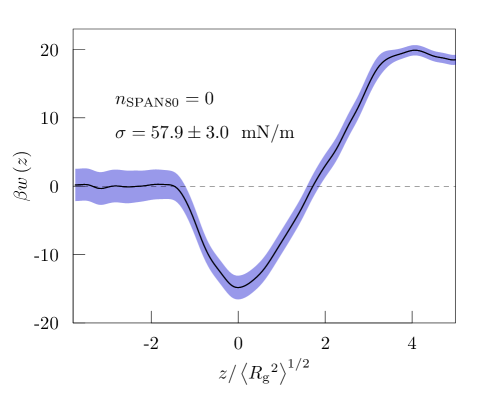
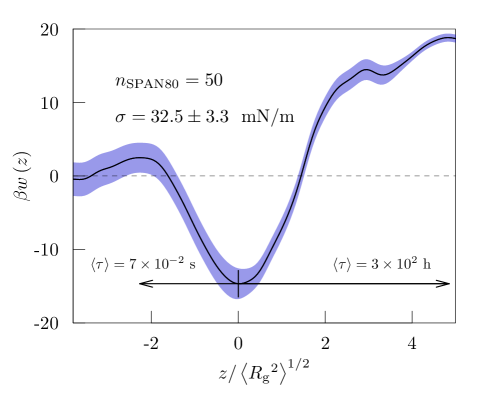
Desorption free energy profiles were obtained for the unloaded case ( = 0/interface) and our strongly loaded case ( = 50/interface). The free energy profiles (FIGs. 5 and 6) are remarkably similar for the two cases. The desorption free energy barrier from interface to squalane phase is around 8 kcal/mol and the free energy barrier is 19.6 kcal/mol from interface to bulk water.
To analyze the kinetics of the desorption process, we assume that the motion of the centroid of a SPAN80 molecule head-group ring may be described by the Smoluchowski equation
| (1) |
with the conditional probably density for a centroid of a SPAN80 molecule head-group ring to arrive at after a time from an initial location van Kampen (1992). Motions parallel to the interface, in the and directions, are separable in this description. We will use this basis to evaluate the mean first passage time for escape of a SPAN80 molecule from the interface. This description uses obtained above, but requires also the kinetic parameter , a self-diffusion coefficient.
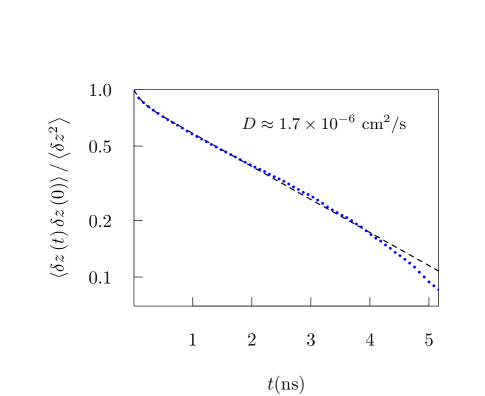
To evaluate , we ran another standard MD simulation preserving sufficient time resolution. Specifically, we extracted a windowed configuration from the strongly loaded interface simulation, then extended the MD simulation for 100 ns with configurations saved every 10 fs. The first 20 ns of this trajectory was discarded as further aging, and we naturally used results for all SPAN80 molecules present. The centroid of a SPAN80 head-group ring is followed with locating the minimum of (FIG. 6). The centroid of a SPAN80 molecule head-group ring wanders near the minimum of , and we linearize The Langevin equation
| (2) |
with the random-force exhaustively discussed elsewhere Zwanzig (2001), then corresponds to Eq. (1). Establishing the necessary force constant by gives
| (3) |
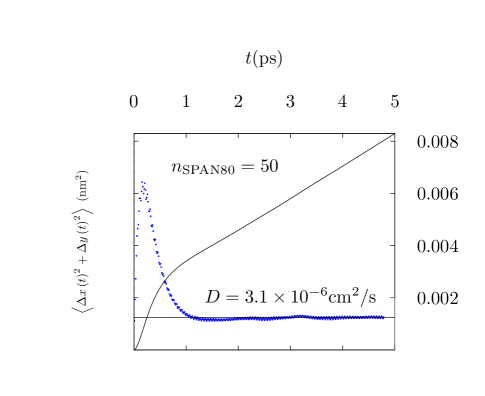
The observed displacement time-correlation-function (FIG. 7) relaxes exponentially, confirming the basic kinetic description. The slight deviation from exponential relaxation (FIG. 7) could be due to the linearization The self-diffusion coefficient is , about a factor of 10 less than a corresponding value for liquid water, and about half of the self-diffusion coefficient of propylene carbonate You et al. (2014). Experimental results for diffusion coefficients of nonionic surfactants range from to Luschtinetz and Dosche (2009); Miller and Lunkenheimer (1986); Paradies (1980); Moorkanikkara and Blankschtein (2009). The present value corresponds to relaxation times of about 2 ns (FIG. 7). Lateral diffusion is slightly faster here (FIG.8), but slows slightly with increasing interface loading.
With this value of , we adapt the theory of first passage times Zwanzig (2001) to
| (4) |
where , and is the displacement from the minimum at to the barrier configuration. We then find (FIG. 6) the mean first passage time of 0.07 s, from the interface to the squalane phase, while the mean first passage time from the interface to bulk water is about h. Differences in the barrier shapes in the two directions play a role in determining that value, since the ratio of these times is about a factor of four less than the naive ratio of
III Conclusions
These results suggest that loading only weakly affects accommodation of a SPAN80 molecule by this squalane-water interface. Specifically, the surface tension equation of state (FIG. 4) is simple through the range of high tension to high loading studied, and the desorption free energy profiles are weakly dependent on loading here (FIGs. 5 and 6). The free energy of transfer of a SPAN80 molecule from water to squalane is about -28 kcal/mol. The perpendicular motion of the centroid of the SPAN80 head-group ring is well-described by a diffusional model near the minimum of the desorption free energy profile (FIG. 7). Lateral diffusional motion is weakly dependent on loading (FIG. 8). Escape times approximated on the basis of a diffusional model and the desorption free energies are s (into the squalane) and h (into the water), the latter value consistent with irreversible absorption observed by recent experimental work Reichert and Walker (2013) on a related system.
IV Methodological Specifics
The GROMACS Van Der Spoel et al. (2005) 4.6.7 molecular dynamic simulation package was used for all calculations. The chain molecules were represented by OPLS-AA force field Jorgensen et al. (1996) and the SPC/E model Berendsen et al. (1987) was chosen for water. The Nose-Hoover thermostat Evans and Holian (1985) maintained the constant temperature and Parrinello-Rahman barostat Parrinello and Rahman (1981) kept pressure at 1.0 atm. Long-range electrostatic interactions were treated in standard periodic boundary conditions using the particle mesh Ewald method with a cutoff of 1.0 nm. The chemical bonds involving hydrogen atoms were constrained by the LINCS algorithm Hess et al. (1997).
In evaluating surface tensions, we applied standard MD simulation and checked the sampling sufficiency with parallel tempering calculations. Nine different surface loadings were investigated, with per interface. The squalane phase included 75 squalane molecules and was bounded by a water phase, bottom and top layers, of 1000 water molecules. For the highest loaded (/interface) and unloaded (/interface) cases, a larger system of 100 squalane molecules and 3000 water molecules was simulated. We expanded the system for those two cases to accommodate a consistent comparison for desorption free energy evaluations. Our standard procedure carried-out an energy minimization calculation and density equilibration followed by a 100 ns production run with constant particle number, pressure, and temperature (NPT) conditions. The parallel tempering calculations used 48 replicas spanning the 260-450K temperature range. Trajectories ran for 50 ns and the resulting exchange probability between neighboring temperatures was around 20%.
We utilized the windows sampling approach to evaluate the desorption free energy profile. To generate initial configurations for each window, we placed one more SPAN80 in the water phase at the position where nm. A pulling force was applied to the centroid of the SPAN80 head-group ring to pull it across the whole system. To achieve high resolution for , 150 windows were used to cover the whole range in unloaded system while 190 windows are utilized to cover the whole range in strongly loaded system. Due to the different complexity between two cases, the extent of the MD trajectory/window differs. Trajectories ran for 30 ns/window in unloaded case while the calculations extended to 60 ns/window in the strongly loaded case.
V Acknowledgement
Sandia is a multiprogram laboratory operated by Sandia Corporation, a Lockheed Martin Company, for the U.S. Department of Energy’s National Nuclear Security Administration under Contract No. DE-AC04-94AL8500. The financial support of Sandia’s LDRD program and the Gulf of Mexico Research Initiative (Consortium for Ocean Leadership Grant SA 12-05/GoMRI-002) is gratefully acknowledged.
References
- dis (2005) Understanding Oil Spill Dispersants: Efficacy and Effects; National Academies Press, Washington DC, 2005.
- Riehm and McCormick (2014) Riehm, D. A., and McCormick, A. V. (2014) The Role of Dispersants’ Dynamic Interfacial Tension in Effective Crude Oil Spill Dispersion. Marine pollution bulletin 84, 155–163.
- Nichols and Pratt (1982) Nichols, A. L., and Pratt, L. R. (1982) Disentanglement of Hydrophobic and Electrostatic Contributions to the Film Pressures of Ionic Surfactants. Faraday Symp. Chem. Soc. 17, 129–140.
- Wilson et al. (1984) Wilson, M. A., Nichols, A. L., and Pratt, L. R. (1984) Hydrophobic Interaction of Amphiphilic Ions with Water–Hydrocarbon Liquid Interfaces. J. Chem. Phys. 81, 579–580.
- Nichols and Pratt (1984) Nichols, A. L., and Pratt, L. R. (1984) Salt Effects on the Surface Tensions of Dilute Electrolyte Solutions: The Influence of Nonzero Relative Solubility of the Salt between the Coexisting Phases. J. Chem. Phys. 80, 6225–6233.
- Jungwirth and Cremer (2014) Jungwirth, P., and Cremer, P. S. (2014) Beyond Hofmeister. Nature Chem. 6, 261–263.
- Alessi et al. (2005) Alessi, M., Norman, A., Knowlton, S., Ho, D., and Greer, S. (2005) Helical and Coil Conformations of Poly(ethylene glycol) in Isobutyric Acid and Water. Macromol. 38, 9333–9340.
- Norman et al. (2007) Norman, A. I., Fei, Y., Ho, D. L., and Greer, S. C. (2007) Folding and Unfolding of Polymer Helices in Solution. Macromol. 40, 2559–2567.
- Norman et al. (2007) Norman, A. I., Ho, D. L., and Greer, S. C. (2007) Partitioning, Fractionation, and Conformations of Star Poly(ethylene glycol) in Isobutyric Acid and Water. Macromol. 40, 9628–9639.
- Chaudhari et al. (2014) Chaudhari, M. I., Pratt, L. R., and Paulaitis, M. E. (2014) Concentration Dependence of the Flory-Huggins Interaction Parameter in Aqueous Solutions of Capped PEO Chains. J. Chem. Phys. 141, 244908–5.
- Chaudhari et al. (2015) Chaudhari, M. I., Pratt, L. R., and Paulaitis, M. E. (2015) Loop-Closure and Gaussian Models of Collective Structural Characteristics of Capped PEO Oligomers in Water. J. Phys. Chem. B 119, 8863–8867.
- Reichert and Walker (2013) Reichert, M. D., and Walker, L. M. (2013) Interfacial Tension Dynamics, Interfacial Mechanics, and Response to Rapid Dilution of Bulk Surfactant of a Model Oil-Water-Dispersant System. Langmuir 29, 1857–1867.
- Kirby et al. (2015) Kirby, S. M., Anna, S. L., and Walker, L. M. (2015) Sequential Adsorption of an Irreversibly Adsorbed Nonionic Surfactant and an Anionic Surfactant at an Oil/Aqueous Interface. Langmuir 31, 4063–4071.
- Earl and Deem (2005) Earl, D. J., and Deem, M. W. (2005) Parallel Tempering: Theory, Applications, and New Perspectives. Phys. Chem. Chem. Phys. 7, 3910–3916.
- Han (2013) Han, S. (2013) Molecular Dynamics Simulation of Sorbitan Monooleate Bilayers. Bull. Kor. Chem. Soc. 34, 946–948.
- Bjelkmar et al. (2010) Bjelkmar, P., Larsson, P., Cuendet, M. A., Hess, B., and Lindahl, E. (2010) Implementation of the CHARMM Force Field in GROMACS: Analysis of Protein Stability Effects from Correction Maps, Virtual Interaction Sites, and Water Models. J. Chem. Theory Comp. 6, 459–466.
- Marrink et al. (2007) Marrink, S. J., Risselada, H. J., Yefimov, S., Tieleman, D. P., and Devries, A. H. (2007) The MARTINI Force Field: Coarse Grained Model for Biomolecular Simulations. J. Phys. Chem. B 111, 7812–7824.
- Shinoda et al. (2008) Shinoda, W., DeVane, R., and Klein, M. L. (2008) Coarse-grained Molecular Modeling of Non-ionic Surfactant Self-assembly. Soft Matter 4, 2454–2462.
- Yuan et al. (2015) Yuan, F., Wang, S., and Larson, R. G. (2015) Potentials of Mean Force and Escape Times of Surfactants from Micelles and Hydrophobic Surfaces Using Molecular Dynamics Simulations. Langmuir 31, 1336–1343.
- van Kampen (1992) van Kampen, N. G. STOCHASTIC PROCESSES IN PHYSICS AND CHEMISTRY; North Holland, 1992.
- Zwanzig (2001) Zwanzig, R. NONEQUILIBRIUM STATISTICAL MECHANICS; Oxford University Press, 2001.
- You et al. (2014) You, X., Pratt, L., and Rick, S. (2014) The Role of Attractive Interactions in the Dynamics of Molecules in Liquids. arXiv preprint arXiv:1411.1773
- Luschtinetz and Dosche (2009) Luschtinetz, F., and Dosche, C. (2009) Determination of Micelle Diffusion Coefficients with Fluorescence Correlation Spectroscopy (FCS). J. Coll. Interf. Sci. 338, 312–315.
- Miller and Lunkenheimer (1986) Miller, R., and Lunkenheimer, K. (1986) Adsorption Kinetics Measurements of Some Nonionic Surfactants. Coll. Poly. Sci. 264, 357–361.
- Paradies (1980) Paradies, H. H. (1980) Shape and Size of a Nonionic Surfactant Micelle. Triton X-100 in Aqueous Solution. J. Phys. Chem 84, 599–607.
- Moorkanikkara and Blankschtein (2009) Moorkanikkara, S. N., and Blankschtein, D. (2009) New Methodology to Determine Equilibrium Surfactant Adsorption Properties from Experimental Dynamic Surface Tension Data. Langmuir 25, 6191–6202.
- Van Der Spoel et al. (2005) Van Der Spoel, D., Lindahl, E., Hess, B., Groenhof, G., Mark, A. E., and Berendsen, H. J. (2005) GROMACS: fast, flexible, and free. J. Comp. Chem. 26, 1701–1718.
- Jorgensen et al. (1996) Jorgensen, W. L., Maxwell, D. S., and Tirado-Rives, J. (1996) Development and Testing of the OPLS All-Atom Force Field on Conformational Energetics and Properties of Organic Liquids. J. Am. Chem. Soc. 118, 11225–11236.
- Berendsen et al. (1987) Berendsen, H. J. C., Grigerat, J. R., and Straatsma, T. P. (1987) The Missing Term in Effective Pair Potentials. J. Phys. Chem 91, 6269–6271.
- Evans and Holian (1985) Evans, D. J., and Holian, B. L. (1985) The Nose-Hoover Thermostat. J. Chem. Phys. 83, 4069–4074.
- Parrinello and Rahman (1981) Parrinello, M., and Rahman, A. (1981) Polymorphic Transitions in Single Crystals: A New Molecular Dynamics Method. J. App. Phys. 52, 7182.
- Hess et al. (1997) Hess, B., Bekker, H., Berendsen, H. J. C., and Fraaije, J. G. E. M. (1997) LINCS: A Linear Constraint Solver for Molecular Simulations. J. Comp. Chem. 18, 1463–1472.