X-Ray Spectra of The High-Mass X-RAY Binary 4U 1700-37 using BeppoSAX, Suzaku and RXTE Observations
Abstract
We present an X-ray spectral analysis of the high-mass binary 4U 1700-37 during its hard-soft state evolution. We use the BeppoSAX, Suzaku and RXTE (Rossi X-ray Timing Explorer) observations for this investigation. We argue that the X-ray broad-band spectra during all spectral states can be adequately reproduced by a model, consisting of a low-temperature Blackbody component, two Comptonized components both due to the presence of a Compton cloud (CC) that up-scatters seed photons of 1.4 keV, and 1 keV, and an iron-line component. We find using this model that the photon power-law index is almost constant, for all spectral states. However, shows a behavior depending on the spectral state. Namely, is quasi-constant at the level of while the CC plasma temperature is less than 40 keV; on the other hand, is in the range of , when is greater than 40 keV. We explain this quasi-stability of during most of hard-soft transitions of 4U 1700-37 in a framework of the model in which the resulting spectrum is described by two Comptonized components. We find that these Comptonized spectral components of the HMXB 4U 1700-37 are similar to those previously found in NS sources. This index dependence versus both mass accretion rate and revealed in 4U 1700-37 is a universal observational evidence for the presence of a NS in 4U 1700-37.
1 Introduction
Our knowledge of diagnostics for a BH or a NS presence in X-ray binaries has been challenged in the last years by growing observational evidence that the spectral index is uniquely sensitive to the type of the compact object (NS or BH ) during burst events (Titarchuk & Shaposhnikov, 2005; Shaposhnikov & Titarchuk 2009; Shrader et al. 2010; Farinelli & Titarchuk, 2011; Titarchuk et al. 2014, hereafter TSS14). In other words, this observational signature can be used as a probe for the nature of a compact star. The photon index of the energy spectrum tends to be quasi-constant, around (or the spectral index ) for a neutron star. When monotonically increases with an outburst flux and then saturates at the burst peak, this compact object is identified as a black hole (BH). The observational behavior of the index in a NS is combined with the specific decrease of , from the level of to at the high plasma temperatures of the transition layer (TL) when keV [see SST14 and Seifina et al. (2015), hereafter STSS15]. This specific behavior of versus is never observed in BHs and thus can be considered as a spectral signature of a NS.
The index correlations for BHs were demonstrated by Shaposhnikov & Titarchuk (2009), hereafter ST09. Seifina & Titarchuk (2011), hereafter ST11, discovered the photon index behavior versus mass accretion rate in NSs, and then it was confirmed by TSS14. Because the above NS diagnostic was only tested for low mass X-ray binaries (LMXB), now we decided to check this index versus mass accretion rate correlation also for high mass X-ray binaries (HMXB). Therefore, it is important to test this method, using this index versus mass accretion correlation, in application to HMXBs which are relatively young sources consisted of a massive early-type stellar companion (OB/Be-type star) and a compact object (NS or BH). In some Be/X-ray binaries X-rays are produced when matter accretes to a compact object passing through the dense equatorial disk of Be-star. Other HMXBs contain a more massive OB supergiant, which is characterized by stellar winds with mass-loss rates of to M⊙ per year. A fraction of this outflow may be attracted by a compact object. Usually, HMXBs with O-B stars produce periodic X-ray outbursts in a case of high eccentric binary orbits during periastron passages. For the circular orbit cases, some of OB/X-ray binaries containing supergiants, demonstrate large sporadic X-ray flares. Roche lobe overflow usually leads to an accretion disk and a wind. Long-term observation revealed precession effects in V-optical light curve (see Khruzina & Cherepashchyk, 1983) which can be interpreted as an indication of a disk component in accretion flow.
These binaries usually host black holes [e.g., Cyg X-1 and a number of HMXBs in the Magellanic Clouds and the Milky Way, see a review by Lewin & van der Klis (2010)]. HMXB 4U 1700-37 is an interesting example of such OB/X-ray binary. However, the nature of the compact object in this system is still an open question (a NS or a BH?) in spite of the fact that observations of 4U 1700-37 have been obtained for more than 40 years.
4U 1700-37 is a well studied accreting supergiant X-ray binary (SgXB) first detected by the Uhuru satellite in 1970s (see Jones et al. 1973). A companion star is O6.5 Iaf supergiant with a fairly well measured mass and radius (Abubekerov 2004; Rubin et al. 1996; Heap & Corcoran 1992). 4U 1700-37 displays regular eclipses every 3.41 days, which are firmly associated with the orbital period (see Table 1 for other binary parameters). This eclipse covers about 14% of the orbit (i.e. 0.5 days), and residual emission is visible during this period probably because of scattering of X-rays in a wind from the supergiant star (Boroson et al. 2013). The compact object associated with this system does not exhibit any pulsation, while Boroson et al. (2003) reported an information on quasi-periodic oscillations (QPOs). Most of NSs in X-ray binaries demonstrate coherent pulsations [see e.g. Ford & van der Klis (1998) that in 4U 1728-34]. Thus, the origin of the compact object in 4U 1700-37 is not clear (see Gottwald et al. 1986; Clark et al. 2002). In comparisons with other SgXBs, the 4U 1700-37 source displays prominent X-ray long and short variabilities which are very similar to those seen, for example, in Vela X-1 [see Kreykenbolm et al. (2008)]. Prominent X-ray flares in 4U 1700-37 are observed by INTEGRAL for which flux increases up to two orders of magnitude (by a factor of 100), often reaching 1.5 Crab, or more (see Kuulkers et al. 2007). This can be due to an increase of the rate of wind-fed accretion or due to magnetospheric storms. That behavior of 4U 1700-37 is similar to that seen in previous observations by CGRO/BATSE, GRANAT/SIGMA (Markert et al. 1979; Pietsch et al. 1980; Laurent et al. 1992; Rubin et al. 1996; Kudryavtsev et al. 2001; Laycock et al. 2003; Orr et al. 2004).
Because of non-detection of pulsations and the observed X-ray hard tails, Brown et al. (1996) proposed that this source is a BH candidate. However, Reynolds et al. 1999 found that the 2 – 200 keV BeppoSAX spectrum of 4U 1700-37 was fitted by a high energy cutoff power-law model which is a typical spectrum of an accretion powered X-ray pulsars. Moreover, using the BeppoSAX spectrum, Reynolds et al. (1999) also declared a presence of cyclotron absorption feature at 37 keV.
Suzaku observations possibly revealed a pronounced cyclotron absorption feature at 39 keV and spectral variability on ks time scales, due to both variable absorption around the average value of cm-2 and changes in the spectral slope (Jaisawal & Naik, 2015). These results argue against a possibility of a black hole in the 4U 1700-37 source.
High resolution spectra of XMM-Newton and Chandra observations were well fitted by a two component absorption model which was previously utilized for interpretation of the 1991 April observations (see Boroson et al. 2003 and van der Meer et al. 2005). The Chandra observations during the intermittent flare state of 4U 1700-37 revealed fluorescence emission lines from neutral atoms and the recombination lines from H and He like species. The line strengths varied over the observations. Boroson et al. (2003) found that triplet structure in Mg and Si points to the non-equilibrium of photo-ionized plasma. During eclipse and low flux time intervals of the binary van der Meer et al. (2005) found many fluorescence emission lines as well as recombination lines in the XMM-Newton spectrum of 4U 1700-37. An extended ionization region around the source was suggested because of presence of these recombination lines. Using the Chandra observations Boroson et al. (2003) also revealed a few of mHz QPOs in the power density spectra of 4U 1700-37.
We found a large range in the mass evaluations of the compact object () and secondary star () in 4U 1700-37 (see Table 1). Recent mass estimates of (Clark et al. 2002; Rude et al. 2010) are significantly above the usually accepted mass limit for neutron stars. It is worth noting that Abubekerov (2004) analyzed radial-velocity curves of hydrogen Balmer absorption lines for the 4U 1700-37 source using the 1973 – 1976 IUE spectral data (see Hammerschlang-Hensberge et al. 1978). They estimated (i) using the current paradigm about the gravitational acceleration of the optical component ( M⊙), (ii) using a radius of the optical component ( M⊙) and (iii) based on the mass-luminosity relation ( M⊙). The upper limit of these estimates is in agreement with the results of Dolan (2011) in which M⊙ (see also similar estimates by Clark et al., 2002; Rude et al., 2010) and thus these estimates are significantly above the usually accepted mass limit for the neutron star. The dynamical measurement of this compact object mass can be taken as a demonstration that the object is a BH. However, such a mass estimate is not a conclusive argument for the compact object nature. A real proof should be followed from an observational corrobaration of the absence or presence of any solid surface for a particular object.
In this paper, we use an essentially new method for diagnostic of the compact object origin in 4U 1700-37 applying an analysis of available RXTE, BeppoSAX and Suzaku observations. The list of observations used for the data analysis is shown in §2, while in §3 we describe a reader details of our spectral analysis. We discuss how X-ray properties change during the lowhigh spectral state transition of 4U 1700-37 in §4. We make our final conclusions in §5.
2 Details of observations and reduction of the data
2.1 Data Selection
2.1.1 BeppoSAX
BeppoSAX in April of 1997 observed 4U 1700-37 during uneclipsed interval, (see Table 1). We obtained the broad-band energy spectrum of the source using the combined data from three BeppoSAX Narrow Field Instruments (NFIs): the Low Energy Concentrator Spectrometer [LECS; Parmar et al. (1997)], the Medium Energy Concentrator Spectrometer [MECS; Boella et al. (1997)] and the Phoswich Detection System [PDS; Frontera et al. (1997)] for the 0.3 4 keV, 1.8 10 keV and the 15150 keV ranges respectively. The source spectra were extracted from the event data using a circular region centered on the source of radius 30". While an annulus region within 30" and 180" radii was used to determine the background. We applied the SAXDAS data analysis package for data reprocessing. We carried out the spectral analysis in the energy band for which the response is well known. In a model fitting we treated a relative normalization of the NFIs as a free parameter while the MECS normalization was frozen at a value of 1. This method led to cross-normalization factors in the range, expected for each of these instruments 111http://heasarc.nasa.gov/docs/sax/abc/saxabc/saxabc.html.
The spectra were rebinned according to instrument energy resolution to have significant statistics in each bin. Thus, the LECS spectra were rebinned using an energy dependent binning factor (see §3.1.6 of Cookbook for the BeppoSAX NFI spectral analysis) and applying rebinning template files provided by GRPPHA of XSPEC222http://heasarc.gsfc.nasa.gov/FTP/sax/cal/responses/grouping. The PDS spectra were rebinned with a binning factor 2, grouping two bins together (resulting bin width is 1 keV). For the SAX analyzed spectra we applied a systematic error of 1%. The BeppoSAX observations taken for our analysis are listed in Table 2.
2.1.2 Suzaku
During the binary uneclipsed interval spanning 0.29 – 0.72 orbital phases Suzaku in 2006, September 1314 observed 4U 1700-37 (see details in Rubin et al. 1996). The observations were implemented in ”XIS nominal” position using an effective exposure of 82.1 ks and 81.5 ks for HXD and XIS, respectively. XIS detectors worked in the ”burst” clock mode with ”1/4 window” option providing time resolution of 1 s. For the Suzaku observations we utilized publicly available data (version 2.0.6.13). We used for our data analysis HEASOFT software package (version 6.13) and calibration database (CALDB) released on 2012 February 10 and 2011 September 13 for XIS and HXD, respectively. We applied the unfiltered event files for each of the operational XIS detectors (XIS0, 1 and 3) using the latest HEASOFT software package (version 6.13) and following the Suzaku Data Reduction Guide333http://heasarc.gsfc.nasa.gov/docs/suzaku/analysis/. We obtained cleaned event files by re-running the Suzaku pipeline implementing the latest calibration database (CALDB) available since 2013, January 20 and also applying the associated screening criteria files.
Thus, we got the 4U 1700-37 spectra from the filtered XIS event data taking a circular region, centered on the source, of radius 30", and the corresponding background spectra from an annulus region with 30" and 180" radii. Using the BeppoSAX sample we considered the background region to be in the vicinity of the source extraction region. We extracted spectra and lightcurves from the cleaned event files using XSELECT, and we generated responses for each detector utilizing the XISRESP script with a medium resolution.
Implementing reprocessed HXD/PIN event file and XSELECT package of FTOOLS we created HXD/PIN spectra and light curve of 4U 1700-37. Applying tuned non X-ray background (NXB444http://heasarc.nasa.gov/docs/suzaku/analysis/pinbgd.html) event file we accumulated the HXD/PIN background light curves and spectrum. We included a correction for cosmic X-ray background (CXB555http://heasarc.nasa.gov/docs/suzaku/analysis/pin cxb.html) in the PIN spectra as recommended by the instrument team.
In these Suzaku observations we have also found flare-type variability of a factor of 100 (XIS-0) on time scales from minute to hours. We assumed that the above X-ray variability versus orbital phase within these observations was caused by a clumping wind structure or local variations. Note, that this kind on inhomogeneity has already been observed in other SgXBs, like 4U 1538-52 and GX 301-2 [see Rodes-Roca et al. (2015) and Evangelista et al. (2010), respectively].
Thus, we did not relate these X-ray variations to mass accretion rate changes (). A time averaged spectral analysis was implemented using the HXD/PIN and XIS-0 spectra. We carried out spectral fitting applying XSPEC v12.7.1. The energy ranges around of 1.75 and 2.23 keV are not used for spectral fitting because of the known artificial structures in the XIS spectra around the Si and Au edges. Therefore, for spectral fits we have chosen the 0.3 – 10 keV range for the XISs (excluding 1.75 and 2.23 keV points) and the 15 – 70 keV range for the PIN spectrum.
2.1.3 RXTE
For our analysis, we have also applied publicly available data of the RXTE acquired from 1996 September to 2003 September. These data consist of 62 observations related to different spectral states of the source. For data processing we utilized standard tasks of the LHEASOFT/FTOOLS 5.3 software package. Spectral analysis was implemented using PCA Standard 2 mode data, collected in the 323 keV range and applying the most updated release of PCA response calibration (ftool pcarmf v11.7). We also used the standard dead time correction to the data and the data from HEXTE detectors to make broad-band spectra. A background collected during off-source observations was subtracted. For the spectral analysis we took only the HEXTE data in the 19200 keV range. The GSFC public archive (http://heasarc.gsfc.nasa.gov) can provide these data. In Table 3 we present a list of observations which covers the complete sample of the state evolution of the source.
One can assess the source intensity on month timescale using an example of the light curve (during 1996 September) of the All Sky Monitor (ASM, Levine et al. 1996) onboard of RXTE shown in Figure 1. As we have already mentioned above, 4U 1700-37 displays a prominent variability in the soft band which can be associated with long-term variation (of order of ten days) and short-term variability on a daily (hourly) timescale (see e.g. see Kuulkers et al. 2007). Extremely large sporadic outbursts indicate that this system can be also affected by short periods of disk-accretion, especially when soft X-ray luminosity (proportional to ) increases significantly (Fryxell & Taam, 1988; Romano et al. 2015). This type of variability of 4U 1700-37 is the main focus of the present investigation. In order to do this, we have made an analysis of RXTE observations of this source spanning seven years and divided them to five intervals indicated in Table 3. We modeled the RXTE spectra using XSPEC fitting package and we applied a systematic uncertainty of 0.5% to all analyzed spectra.
3 Results
As we have already pointed out above, 4U 1700-37 shows a complex X-ray behavior on a time scale of day probably caused by orbital modulation (Rubin et al., 1998). The source soft photons are also subject to a variable inner absorption related to dipping into a stellar wind during of orbital motion (Buff & McCray, 1964; Haberl et al., 1989; Branduardi et al., 1978). Orbital variation of X-ray absorption can be additionally modified by gas stream (Haberl et al, 1989), wind interaction (Titarchuk et al., 2007; Bychkov & Seifina, 1996a,b) and bow shock trailing the compact object (Livio et al., 1979; Blondin et al., 1990; Saraswat et al., 1996). Stellar wind from supergiant stars are known to be inhomogeneous, because of clumping in the hot-star winds [see, for example, a model by Hamann et al. (2008)]. The presence of these dense clumps dramatically affects the mass loss regime and causes sporadic suborbital variability. Note, that aforementioned variabilities are not related to any global changes in . Indeed, X-ray emission of 4U 1700-37 is modified by transitions between the spectral states (the low/hard and high/soft ones), which are usually a result of significant changes of (see below).
Here, we focus on a type of variability and spectral properties of 4U 1700-37 related to the mass accretion rate changes. Thus, we have only selected observations during the binary uneclipsed intervals of orbital period. X-ray eclipse takes place around optical primary minima, in the phase interval (see van Paradijs, Hammmerschlag-Hensberge & Zuiderwijk 1978). To exclude the eclipse orbital modulation we have only utilized observations occurred in interval . This resulted in 90 out-of-eclipse intervals. It is worth noting that 27 observations occurred during eclipses. We applied the ephemeris of Rubin et al. (1996): orbital period d and mid-eclipse T0 = JD 2 448 900.873(2) to calculate the orbital phase
3.1 Hardness-intensity and Color-color diagrams of 4U 1700-37
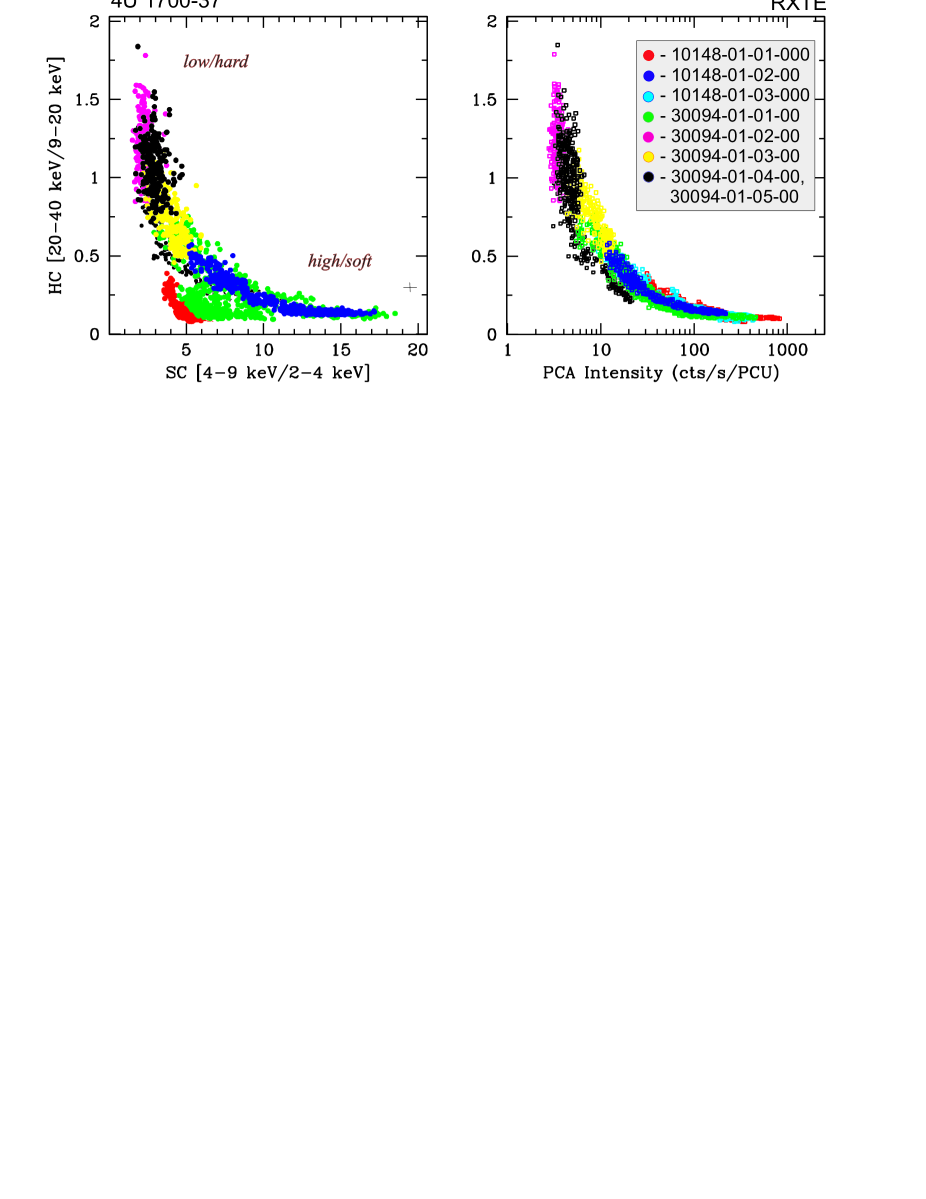
To evaluate the source spectral evolution in time we build hard (HC) and soft colors (SC) making color-color diagrams (CCDs). Figure 2 shows CCDs and hardness-intensity diagrams (HIDs) (see left panel and right panel, respectively). CCD presents the count ratios: hard color (20-40 keV/9-20 keV) versus soft color (4-9 keV/2-4 keV), while HID demonstrates hard color (20-40 keV/9-20 keV) versus PCA count rate (2-40 keV). ObsIds of the observational sets are indicated on the top of the right panel of Figure 2. As we show our data sets related the low/hard to the high/soft states cover different parts of the CCD and HID. We also mark the data of the different sets as red for ObsId 10148-01-01-000, blue for ObsId 10148-01-02-00, bright blue for ObsId 10148-01-03-000, green for ObsId 30094-01-01-00, crimson for ObsId 30094-01-02-00, yellow for ObsId 30094-01-03-00 and black for ObsIs 30094-01-04-00, 30094-01-05-00.
Data sets that we investigated are associated with different epoch. Clearly our data do not indicate a secular shift effect. The CCD and HID form plain and smooth tracks. Note, that the HMXB 4U 1700-37 is similar to LMXBs (Z-sources and atolls) in terms of their CCDs and HIDs [see, for example Seifina et al. (2015)].
As one can also see, 4U 1700-37 demonstrates a typical outburst behavior, marked by CCD/HID track evolution from the LHS to the HSS. The CCD and HID tracks are, however, an empirical description and thus one needs a physical interpretation of their behavior. Therefore, we intend to apply these data for a detailed X-ray analysis of the spectral evolution of the source.
3.2 Details of Spectral analysis
3.2.1 Selection of the Spectral Model
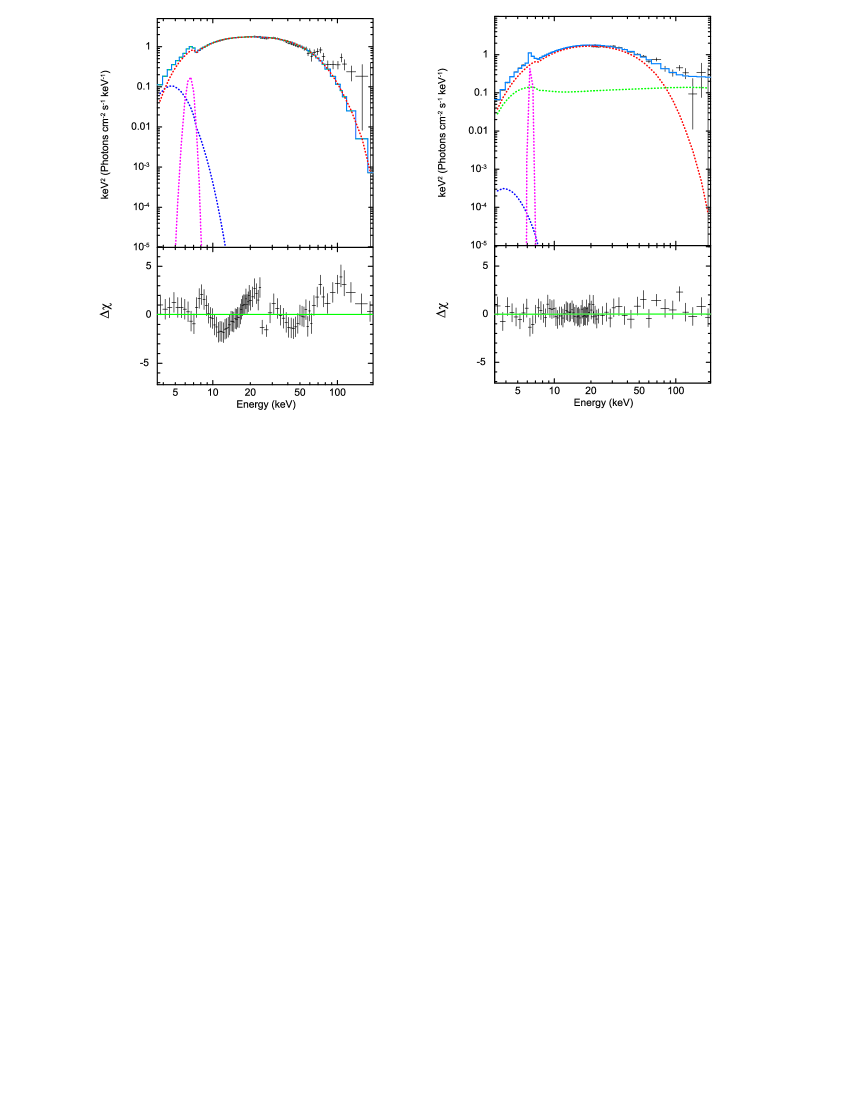
Because of the debated orgin of the compact object in 4U 1700-47 (a NS or a BH), we test the source spectrum using different models in application to , SAX and observations (see examples of the source spectra in Figs. 34). We should point out that different Comptonization models are usually used for a BH (e.g., Stiele et al. 2013) and for a NS (e.g., Farinelli et al. 2003; Paizis et al. 2006). Specifically, we started with a model of an absorbed bbody plus the Comptb. The line feature at 6 – 7 keV range is approximated using the Gaussian line profile. This model [phabs*(bbody+comptb+gaussian)] is successfully applied for BH spectral modelling (see also, STS14). In the case of 4U 1700-37, however this model poorly fits the data as it is clearly seen from Figure 4, where we demonstrate the 4U 1700-37 spectrum (ObsId=10148-01-02-00) observed by RXTE on 1996, September 13 along with the fit residuals . On the left panel the model, which includes a single Comptb component, i.e. the phabs*(bbody+comptb+gaussian) model, is applied. Clearly from this plot the model gives unacceptable fit ( for 86 dof). Significant positive residuals at high energies ( keV) indicate the existence of an additional emission component. As a result, we also add another Comptonized component (Comptb2) with a different seed photon temperature () which results in a significant improvement of the fit (see below).
In Figure 4 (right panel) we demonstrate the best-fit spectrum, and for this fit where the model is: phabs*(bbody+comptb1+comptb2+gauss). This model includes two Comptb components and = 1.12 for 81 dof. We show the data by crosses and the spectral model is presented by light-blue line. The components of the model are color-coded in red, green, dark-blue and crimson lines for Comptb1, Comptb2, Blackbody and Gaussian components, respectively.
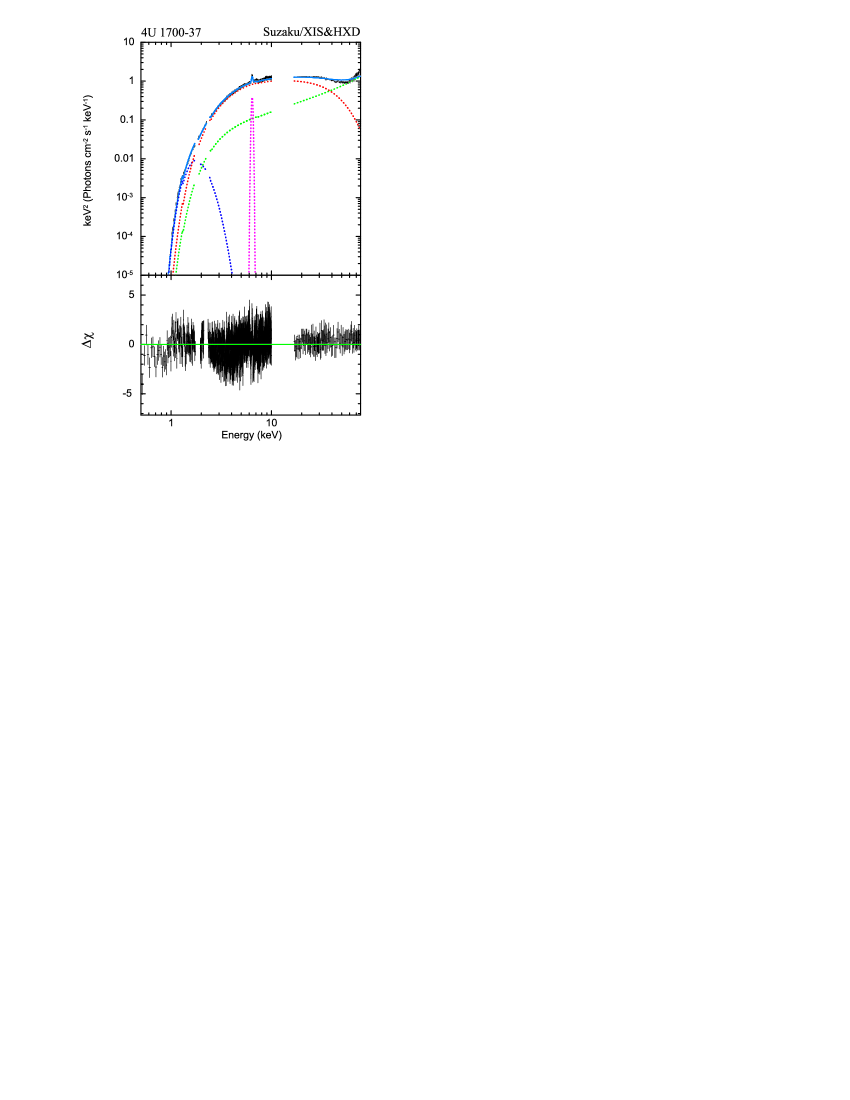
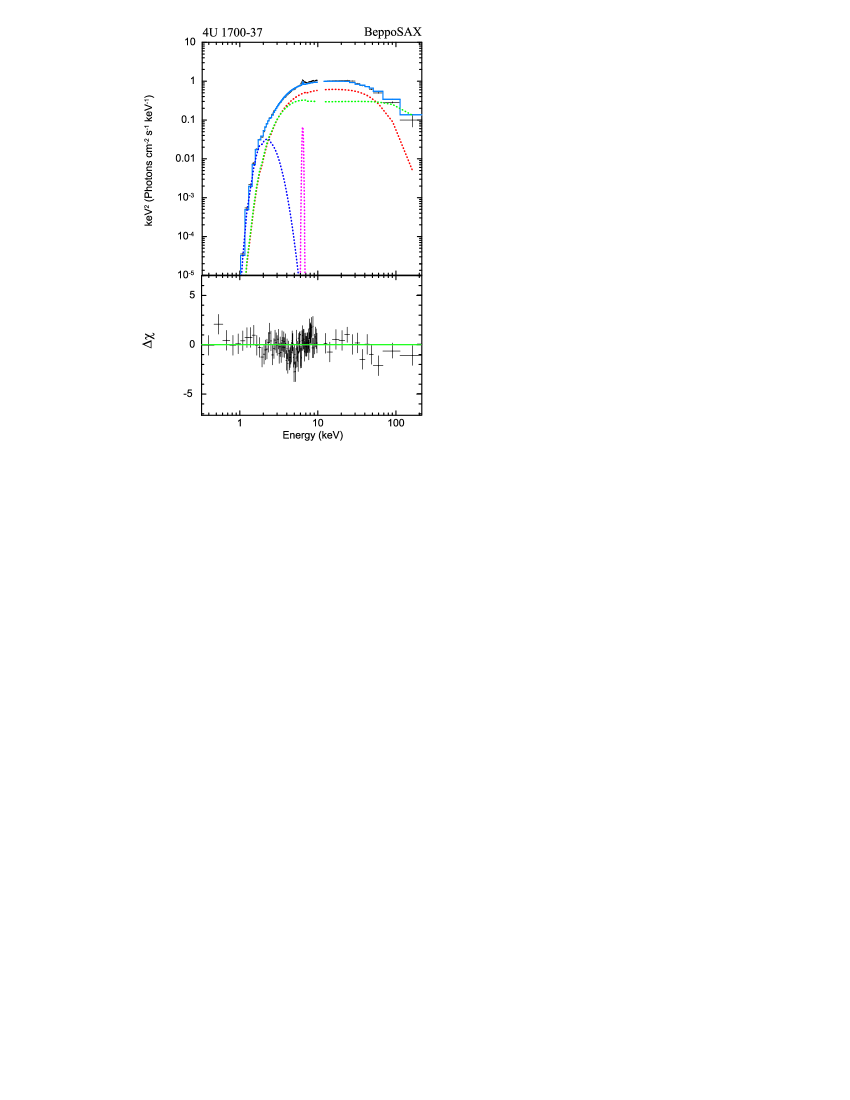
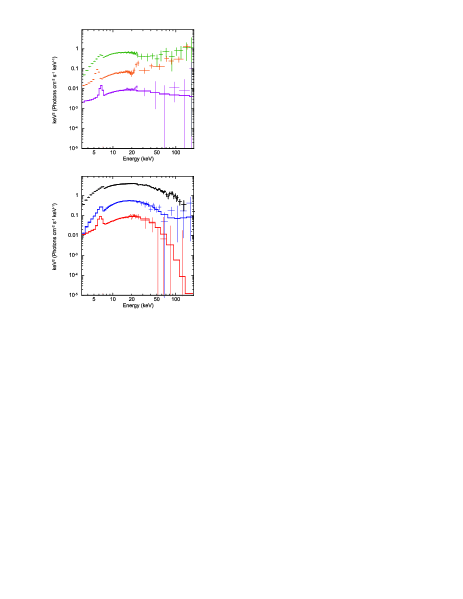
We have also applied various models to the available BeppoSAX and Suzaku data using a better spectral coverage and detector resolution for the 0.3200 keV range (see Table 4). In Figure 3 we show the BeppoSAX (left, ObsId=20339001) and Suzaku (right, ObsId=401058010) spectra of 4U 1700-37 fitted using the two-Comptb model. The data are shown by crosses and the best-fit spectral model, phabs*(bbody + comptb + comptb + gaussian) by light-blue line. The model components are also presented by red, green, dark-blue and crimson lines for Comptb1, Comptb2, Blackbody and Gaussian line, respectively. versus photon energy in keV is shown in the bottom panels. The best-fit parameters of the model for the BeppoSAX data (see left panel) are =2.000.03, =15.30.4 keV, =1.410.02, =968 keV, =0.56 keV and =6.480.07 keV (=0.96 for 335 dof). Notably, Reynolds et al. (1999) fitted the same data by an absorbed power-law model, combined with a high energy cutoff, low energy thermal bremsstrahlung components, an iron line and cyclotron absorption component. While this model is often used for accreting pulsar spectra fitting, it provides almost the same power-law index of 2.070.02 as that in our model for the fist Comptonized component, Comptb1. Using the second Comptonized component of our model, Comptb2, we found that the hard tail in 4U 1700-37 spectrum is similar to one observed in 4U 1705-44 (see STSS15).
As we have already mentioned, Jaisawal & Naik (2015) applied another model to fit the spectra. In particular, they used a combination of partial covering NPEX, a high energy cutoff power-law model, three Gaussian-line and cyclotron absorption components. As a result, they claimed a detection of a cyclotron line at keV. Using BeppoSAX data Reynolds et al. (1999) also suggested an existence of the cyclotron absorption feature at 37 keV in the spectrum. Keeping in mind these results, we have also tested the presence of this line centered at 36 – 39 keV using these available SAX and spectral data and our spectral model. While this model is statistically valid but its performace is worse than that using our model (see Table 4).
More specifically, we fitted these spectral data using model. For the BeppoSAX spectrum (ObsId=20339001) we found (335 dof), while for the one (ObsId=401058010) we obtained (416 dof).
In fact, one cannot see any structure near 40 keV in the residuals of our spectra (see Figure 3). Thus, we are not able to support the presence of this line in the SAX and Suzaku spectra using our spectral model.
3.2.2 Modelling of 4U 1700-37 spectra with two-Comptonization components
The best-fit models for RXTE, BeppoSAX and Suzaku spectra were obtained using the two-COMPTB model phabs*(Bbody+Comptb1+Comptb2+Gauss). In fact, this model provides a physical picture, in contrast to previously models applied to X-ray spectra of 4U 1700-37 (see e.g., Reynolds et al. 1999; van der Meer et al. 2005; Jaisawal & Naik, 2015). We want to emphasize that the two-COMPTB model is usually applied to NS spectra, because in NSs, the two Comptonized components are created in the CC for which the seed photons come from the NS surface and the accretion disk. On the other hand, in a BH the seed soft photons are only produced in the accretion disk which is located next to the relatively hot CC.
Our model for 4U 1700-37 describes a scenario in which an accretion disk is connected to the compact object (NS) through the Compton cloud (CC) (see a possible geometry figure in STSS15). Note, X-ray flux is highly variable (by factor 100), showing evidence for a clumpy stellar wind (Jaisawal & Naik 2015), which probably results in a varying accretion rate.
In our picture, the emergent thermal Comptonization spectrum is formed in the hot Compton cloud (CC), where soft photons of temperature from the neutron star and the accretion disk of temperature are up-scattered off the hot electrons giving rise to two components, Comptb1 and Comptb2, respectively. Some fraction of these seed soft photons can be also observed directly from by the Earth, that explains why we add a soft blackbody of the temperature with normalization . Note, the Comptb model describes the resulting spectrum as a convolution of a seed blackbody of normalization and temperature with the Comptonization Green function.
The spectral index of the emergent spectra of the Comptonization component is determined by the energy release in the CC. As TSS14 demonstrate that if the gravitational energy release occurs throughout the cloud around a NS then the spectral index should be around 1 (or the photon index is around 2). However, if the release of the energy takes place only in outer portion of the CC then the spectral index is less than 1 (or is less than 2). The latter case is realized in the sources for which the local emergent luminosity exceeds the Eddington limit and where the plasma temperature of the CC outer part is higher than 30 keV. Note, that in this particular case the critical luminosity can be a factor of 1.2-1.4 higher than the Eddington one depending on a value of (see TSS14 and Figure 10 there). This effect of the index decrease has been established in Sco X-1 and 4U 1705-44 (see TSS14 and STSS15, respectively), which are characterized by high luminosites. Our goal is to investigate this effect in 4U 1700-37.
For the XSPEC Bbody model, normalization is
| (1) |
where is source luminosity of a source and is distance to the source. The free parameters of the applied model, phabs*(Bbody+Comptb1+Comptb2+Gauss), are: the equivalent hydrogen absorption column density ; the spectral indices , ; the seed photon temperatures , ; and are linked to the Comptonized fractions , (); the plasma temperatures and ; normalizations of and of the Comptb1 and Comptb2, respectively. In the model we also include a XSPEC Gaussian, whose parameters are , the line width and line normalization , to fit the data in the 68 keV range.
Note, we fixed the following model parameters: and [see meaning of these parameters in Titarchuk et al. (2014)). The value of is frozen at 2 when because the model fit becomes insensitive to the parameter . We list all best-fit parameters in Table 4.
The most important issue is how the photon index behaves depending on the different model parameters. These dependences are crucial for understanding the compact object origin in 4U 1700-37. In this respect, for the and BeppoSAX data (see Table 4) we find that the spectral indices and are around 1.000.02 and 0.340.08, respectively (or and are 2.020.02 and 1.340.08, respectively). We also reveal that and change in the intervals of 1.31.4 keV and 0.80.84 keV, correspondingly, for all available data sets. Thus, using and SAX data we reveal two main blackbody sources: the first one is associated with the NS surface as the second one is presumably associated with the accretion disk region for which keV and keV, respectively (see Table 4).
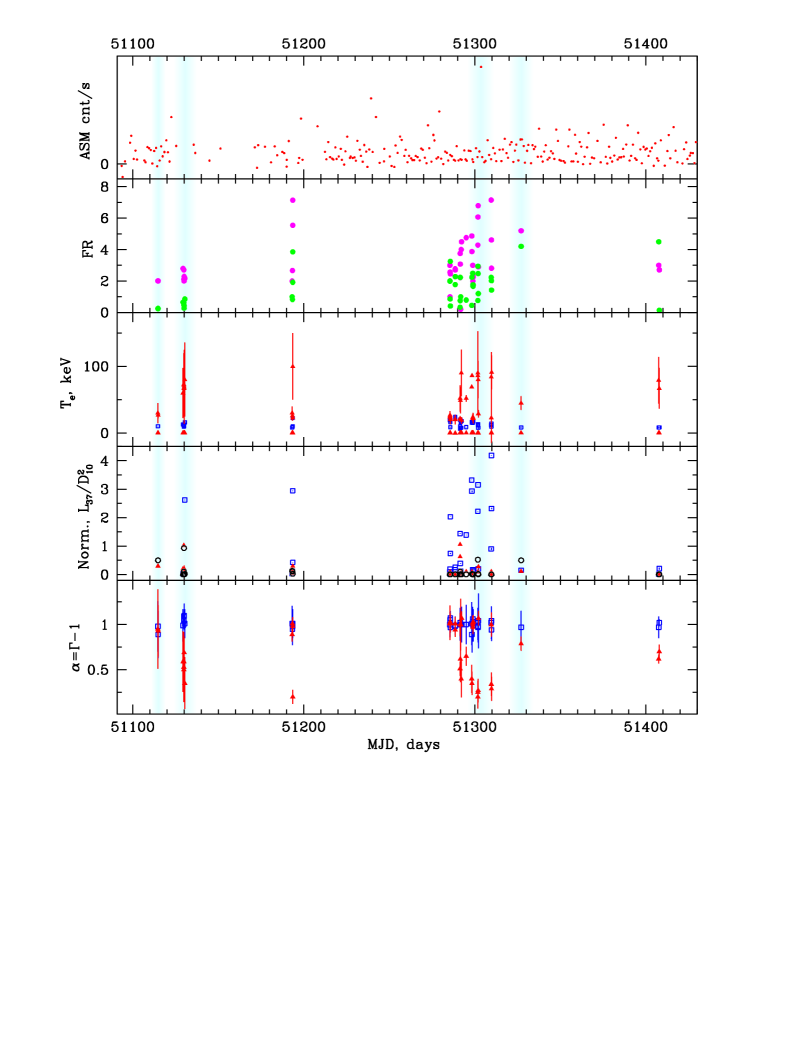
RXTE detectors can provide data only above 3 keV, while using the broad energy band of Suzaku and BeppoSAX we can find the low energy blackbody parameters. Thus, for the RXTE spectra we should fix the blackbody temperature at a value of 0.6 keV obtained using our analysis of the and SAX data. In Tables 5 and 6 we report the best-fit spectral parameters of the two-Comptb model as a result of analysis of the RXTE observations. . In Figure 5 we show six spectral evolution diagrams (see upper and lower panels). The RXTE data (denoted by crosses) correspond to observations, 30094-01-01-10 (green); 3009401-12-00 (orange); 30095-02-02-20 (violet); 30094-01-33-00 (red), 30094-01-31-00 (blue) and 30095-01-01-00 (black). Moreover, from Figure 5 we can establish how the spectral shape changes in the energies greater than 30 keV reflecting an effect of a sum of the two Comptonized components for different states. The hard tail at 50200 keV grows with X-ray luminosity, except for the intermediate soft state [see 30094-01-33-00 spectrum (red)]. In our data we have found many spectra with the strong high energy tail which extended to 200 keV (see Figure 5).
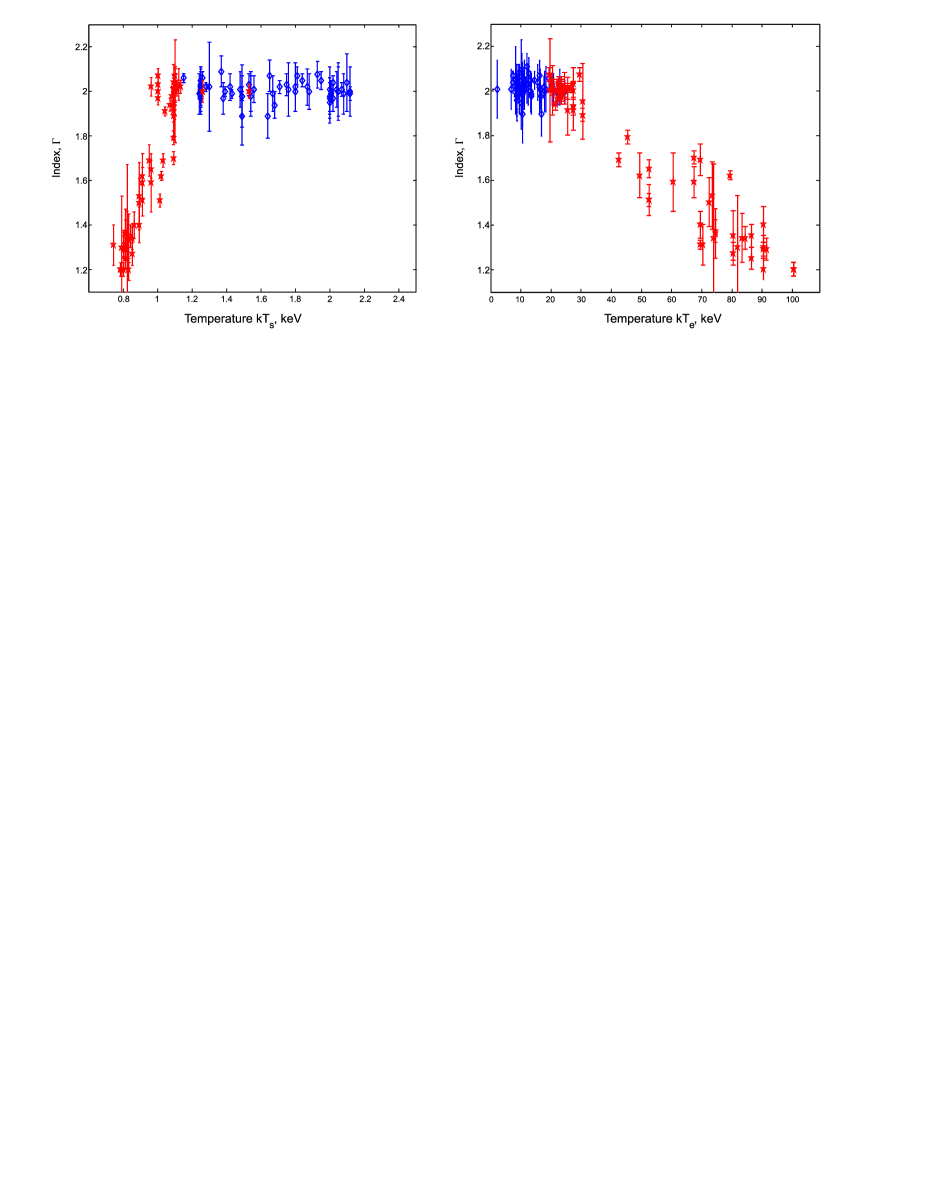
As one can see from Tables 4-6 normalization of the Comptb1 component changes in the range of 0.01 to 22.6 in units of (where is the seed blackbody luminosity in units erg sec-1 and is distance in units of 10 kpc), while the photon index is almost constant () for all set of observations (see Fig. 6, left diagram). However, we established a two-phase sample for : the phase of the quasi-constancy of when changes in the 340 keV interval; and the low photon index phase of for keV (see Figure 6, right panel). Note that the Gaussian line width does not change much and numerous fits indicate that varies in the 0.5 – 0.8 keV range. Thus, has been fixed at 0.7 keV for all spectral fits. The plasma temperatures and change in broad ranges of 222 keV and 19100 keV, respectively (see Tables 4-6 and Figure 6).
3.3 Overall picture of X-ray properties
In Figure 6 we also plot the photon indices (blue) and (red) versus the seed photon temperatures , which related to the up-scattering of the NS and accretion disk soft photons. As one can see from this Figure that when the decreases from 1.1 to 0.8 keV. This is the strong demonstration that drops when the Compton cloud area enlarges. As we have already pointed out the diminishing index phase corresponds to the high plasma temperature phase ( keV) while for in the 230 keV range the index remains constant.
This two component Comptonization model gives very good fits for all investigated data sets. From Figures 3 – 5 one can see that the source spectra are well fitted by our twoComptb model: for most of the cases. For 2% of the observations corresponding to higher S/N reaches 1.4.
From top to bottom in Figure 1 we show the RXTE/ASM count rate evolution during the R2 1999 observations, the (10-50 keV)/(3-10 keV) ratio () and the (50-200 keV)/(3-10 keV) ratio (), () and () in keV, normalizations of Comptb1, Comptb2 and Bbody components (red, blue and black, respectively), and the indices and (red and blue, correspondingly). Notably, the Bbody component is very weak, sometimes it is detected at the limit of “visibility”. However, for a number outburst states we detected the strengthening of this component. Blue vertical strips denote the light curve phases when the Bbody component increases. The photon index drops when increases (see bottom panel of Fig. 1). We should emphasize once again that the photon index, correlates with (see Fig. 6, left panel) which clearly indicates the CC expansion. The disk seed photons, in this case, come from the cooler outer regions [see Seifina et al. (2015) for a possible geometry of the source].
4 Discussion
4.1 Quasi-constancy of the index is a signature of a NS
Using our analysis of the index evolution in 4U 1700-37 we have firmly established the quasi-constancy versus Comptb normalization , (proportional to ) and also versus other parameters, and (see Fig. 6). FT10 and ST11 argue that this stability is a signature of solid surface of a compact object, pointing to a NS presence in the HMXB 4U 1700-37. On the other hand the photon index decrease is directly related to expansion of the transition layer (TL) due to high radiation pressure when the index drops and the plasma temperature increases (see Fig. 6). TSS14 explained this observational effect. At high luminosity the radiation pressure from the NS photons stops the falling plasma. As a consequence the gravitational energy deposition only takes place in an outer part of the transition layer where the plasma temperature is high (above 30 keV). At such temperatures the critical luminosity is not achieved. Observationally, the expansion of the TL is also confirmed by a decrease of the seed photon temperature . Thus, the photon index demonstrates the stability at the sub-Eddington luminosity and a decrease at the high plasma temperature state as was previously found in Sco X-1 (TSS14) and 4U1705-44 (STSS15).
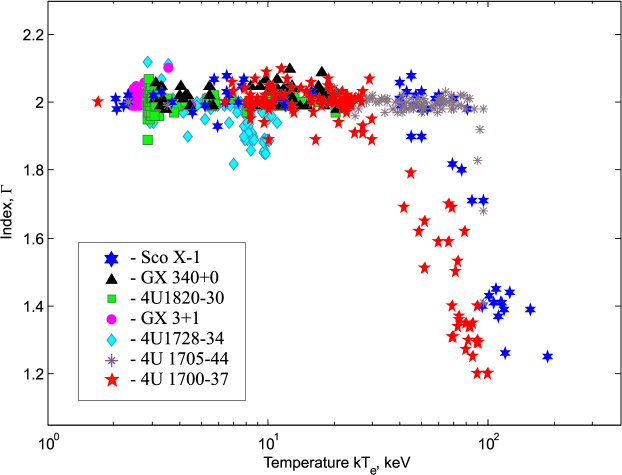
Note that only three sources, 4U 1705-44, 4U 1700-37 and Sco X-1 show a drop of the photon index (see Figure 7). However, this index effect in 4U 1700-37 begins at lower keV, than that in Sco X-1 ( keV) and 4U 1705-44 ( keV). We should point out that in Sco X-1 the maximum of the plasma temperature, exceeds 100 keV while that for 4U 1700-37 and 4U 1705-44 are in the range keV (see Figure 7).
4.2 Possible detection of the switches between the wind and disk accretion regimes
The optical component in 4U 1700-37 is characterized by a strong wind as it is usually observed in Osupergiants. The wind velocity near inner Lagrange point increases (Abubekerov, 2004). SgXB 4U 1700-37 have also been proposed to undergo episodes of disk accretion due to the formation of short lived accretion disks (see, e.g., Fryxell & Taam 1988). Generally, the angular momentum of the fast wind launched from a supergiant star is too low to form a disk (Ducci et al. 2009). However, this is not true if the velocity of the wind is strongly reduced by the effect of ionization of the X-rays emitted from the NS (in this case the line driven acceleration mechanism can be nearly turned off). As discussed recently by Romano et al. (2015), in systems with an orbital period of a few days (5 – 10 days) and a moderate eccentricity, a disk is likely to form when the velocity of the wind from the massive companion drops by a factor of 100 (i.e. from thousands to tens of km/s). Thus, when accretion switches from the wind to the disk mode, X-ray luminosity is expected to rise significantly ( erg/s), due to the enhanced disk mass accretion rate. A rapid spin up phase is also expected to take place due to the angular momentum of the disk material that acquired by the NS during the accretion process (Klochkov et al. 2011 and Jenke et al. 2012).
Variable inner absorption is an observational evidence in favor of accretion disk formation in 4U 1700-37. In fact, the absorption amount should rises as the compact object appears behind the wind dense parts, close to eclipse ingress and egress. However, this absorption is asymmetric about orbital phase in this system (Branduardi, Mason, & Sanford 1978). Mason et al. 1976 and Haberl et al. 1989 that a sharp increase in absorption at is related to a region of increased density. Boroson et al. (2003) detected a ”soft excess” in the flux at 0.7. Haberl, White, & Kallman (1989) pointed out that this absorption excess at could be due to an accretion taking 8% of the gas flow that accretes through the disk.
Using BeppoSAX, Suzaku and RXTE observations, we find two blackbody emission sources: the first one is probably associated with the disk and the second is presumably associated with the neutron star (NS), for which soft photon temperatures are about 1 keV or less and 1.4 keV, respectively. We also established that some spectra can be fitted with an additional Blackbody (with normalization and keV), while other spectra do not require this component. Note, the absense of the Bbody at 0.6 keV is generally related to the low/hard states of 4U 1700-37, while its detection is strictly accompanied by flaring events. These episodes are marked by vertical strips in Figure 1 to relate these episodes to transient accretion disk events. One can also see that these flaring events are associated with drops of the index and surges of () by factor 10. Therefore, we can relate these moments with transient accretion disk events. In fact, we have found six of these intervals, in which we suggest switches between the wind and disk accretion regimes.
In the case of very low at 0.6 keV we fix at 0.001, in order to model and compare our results for all spectral states and use the same model for all states. This procedure allows us to take into account a weak accretion disk.
In our case, the extended power-law is a tail of the Comptonization spectrum which is created in the outer hot part of the Compton cloud and we have already demonstrated and explained this PL phenomenon for a number of NS sources (see STSS15, TSS14 for details). Thus, our spectral model has a basic, physical meaning, because it relies on the Comptonization of two sources of soft photons, one coming from the NS and the other has the disk origin. As for the Bbody source, these soft photons come from outer part of the extended disk.
It is worth noting that we keep when because an illumination factor f=A/(1+A) is close to one in this case. We should also clarify a relation between the XSPEC COMPTT and COMPTB models because they are widely used for modeling X-ray data. The COMPTT model parameters are the optical depth, which value depends on an assumed geometry, and the plasma temperature . We prefer to be independ on any assumption of the plasma cloud (TL) geometry. Thus, we use the COMPTB model where the main parameters are the spectral index and the plasma temperature . Instead of using the optical depth and plasma temperature provided by the COMPTT one can simply apply the COMPTB model.
Our Figure 6 presents the main result of the paper where we show that the photon index (+1) is around 2 while the CC plasma temperature is less than 30 keV. Note, that the applied electron cross-section is Thomson in this case. However, when the CC plasma temperature increases above 30 keV the electron cross-section drops and thus, the critical luminosity increases. In this case, keV, the emergent luminosity is less than the critical and thus, the radiation pressure originated at the NS surface cannot stop the accretion flow.
Note, 4U 1700-37 HID is similar to those of LMXBs while the CCD is different. Thus, we can conclude that 4U 1700-37 behaves in the same way as a NS in LMXB in terms of physical quantities (the spectral index and the CC plasma temperature) keeping, however in mind that CCD is only a qualitative description of the data. Indeed, our Figure 2 presents clearly the spectral softening when the count rate increases.
One possible issue for the presented study is that the magnetic field which can be as high as normal X-ray pulsar, see aforementioned claims using the data analysis of the appropriate BeppoSAX observations [Reynolds et al. (1999) and Jaisawal & Naik, 2015]. The absence of pulsations from this source even leads to a suggestion that the source could be a BH source. In fact, we have found using our analysis that the illumination factor of the Compton cloud, is very close to 1 (or ) in most of the observations. This means that the NS is embedded in a thick Compton cloud that does not allow a direct view of the NS surface, making difficult to estimate the NS magnetic field.
5 Conclusions
Applying Suzaku, BeppoSAX, and RXTE observations we studied the correlations of spectral properties, with mass accretion rate, observed in the non-pulsating high mass binary, 4U 1700-37.
We find that all broad-band energy spectra of this source can be adequately presented as a sum of two Comptonization spectra associated with the seed photon temperatures, keV and keV. We also put an iron-line component to the model.
Our model of the 4U 1700-37 spectra allows us to separate the contributions of two specific spectra, related to the hard and soft X-ray components along the CCD and HID presumably dictated by . The observed luminosity determined by two normalizations and of the Comptonized components which are proportional to . We also found that the soft Comptonization component (associated with the NS seed photons) dominates over the hard Comptonization component (associated with the disk seed photons). This effect is clearly visible in the second panel from the bottom in Figure 1.
During X-ray flares, in a surge of , we observe an increase of correlated with a rise of the plasma temperature (see 2nd and 3rd panels from the bottom of Figure 1).
Our spectral analysis of 4U 1700-37 also discovers the stability of photon indices and around 2 during the states which relate to the CC plasma temperature range of from 2 keV to 30 keV, while a drop of is seen during a rise of 40 keV (see Figure 6). We interpret the quasi-stability of around 2 in the framework of a model in which the gravitational energy release occurs in the transition layer (TL) and this energy deposition in the TL greatly exceeds that in the disk. The similar effect was previously revealed in LMXBs: atolls, 4U 1705-44, 4U 1728-34, GX 3+1, 4U 1820-30 and Z-sources, Sco X-1, GX 340+0 (see Figure 7). In addition to the index plateau phase of we also reveal the index decrease for the hard Comptonization component detected over the flaring branch (FB), in addition to the index plateau stage of . Note, that a similar phase is observed in 4U 1705-44 over the upper banana branch and in Sco X-1 at the FB which is an additional argument for the NS presense in 4U 1700-37.
We can interpret this index decrease using the model in which the gravitational energy release occurs only in an outer part of the Compton cloud (CC) (see details in TSS14). The radiation force acting on the accretion flow stops it near the inner boundary of the CC where is actually dictated by the photon flux from the NS surface and as a result the Klien-Nishina cross-section rises with a plasma temperature decrease (see §4 of TSS14 for details).
Note, in BHs the photon index rises and then saturates when the luminosity increases (see e.g. ST09). This index behavior in a BH is in contrast to that seen in 4U 1700-37, 4U 1705 and Sco X-1.
In our analysis we establish the robust nature of the parameter correlations in 4U 1700-37 and we want to point out that this source is a neutron star one.
References
- Abubekerov (2004) Abubekerov, M.K. 2004, Astronomy Reports, 48, 649
- Ankay et al. (2001) Ankay A., Kaper L., de Bruijne J. H. J., et al. 2001, A&A, 370, 170
- Barret & Olive (2002) Barret, D., Olive, J.-F. 2002, ApJ, 578, 391 (BO02)
- Blondin et al. (1990) Blondin, J. M., Kallman, T. R., Fryxell, B. A., & Taam, R. E. 1990, ApJ, 356, 591
- Bradshaw et al. (1999) Bradshaw, C. F., Fomalont, E. B., & Geldzahler, B. J. 1999, ApJ, 512, L121
- Branduardi et al. (1978) Branduardi, G., Mason, K. O., & Sanford, P. W. 1978, MNRAS, 185, 137
- Boella et al. (1997) Boella, G. et al. 1997, A&AS, 122, 327
- Boroson et al. (2003) Boroson, B., Vrtilek, S. D., Kallman, T., & Corcoran, M. 2003, ApJ, 592, 516
- Brown et al. (1996) Brown G. E., Weingartner J. C. & Wijers R. A. M. J., 1996, ApJ, 463, 297
- Bychkov & Seifina (1996a) Bychkov & Seifina, 1996 Astronomy Reports, 40, 669
- Bychkov & Seifina (1996b) Bychkov, K. V. & Seifina, E. V., 1996, Astronomy Reports, 40, 179
- Buff & McCray (1974) Buff, J., & McCray, R. 1974, ApJ, 188, L3
- Cherepashchuk et al. (1996) Cherepashchuk, A.M., Bychkov, K.V. & Seifina, E.V., 1995, APSS, 229, 33
- Christian & Swank (1997) Christian, D. J., & Swank, J. H. 1997, ApJS, 109, 177
- Clark et al. (2002) Clark, J. S., Goodwin, S. P., Crowther, P. A., et al. 2002, A&A, 392, 909
- Dolan (2011) Dolan J. F., 2011, arXiv:1107.1537
- Evangelista et al. (2010) Evangelista, Y. et al. 2010, ApJ. 708, 1663
- Farinelli & Titarchuk (2011) Farinelli, R. & Titarchuk, L. 2011, A&A, 525, A102
- Farinelli et al. (2003) Farinelli, R. et al. 2003, A&A, 402, 1021
- Fender et al. (2000) Fender, R. P., & Hendry, M. A., 2000, MNRAS, 317, 1
- Ford & van der Klis (1998) Ford, E. C., van der Klis, M., & Kaaret, P. 1998, ApJ, 506, L39
- Ford et al. (1998) Ford, E. C., van der Klis, M., & Kaaret, P. 1998, ApJ, 498, L41
- Ford & van der Klis (2000) Ford, E. C., van der Klis, M., Mendez, M., et al. 2000, ApJ, 537, 368
- Friend & Castor. (1982) Friend, D. B., & Castor, J. I. 1982, ApJ, 261, 293
- Frontera et al. (1997) Frontera, F. et al. 1997, A&AS, 122, 357
- Fryxell & Taam (1988) Fryxell & Taam 1988, ApJ, 335, 86
- Gottwald et al. (1986) Gottwald, M., White, N. E., & Stella, L. 1986, MNRAS, 222, 21P
- Haberl & Titarchuk (1995) Haberl F. & Titarchuk L. 1995, A&A, 299, 414
- Haberl et al. (1989) Haberl, F., White, N. E., & Kallman, T. R. 1989, ApJ, 343, 409
- Hamann et al. (2008) Hamann, W.-R., Oskinova, L.M. & Feldmeier, A 2008, Clumping in Hot Star Winds, Eds. W.-R. Hamann, , A. Feldmeier, A & L.M. Oskinova, Potsdam: Univ.-Verlag
- Hammerschlang-Hensberge et al. (1978) Hammerschlang-Hensberge, C., De Loore & van Den Heuvel, A. 1978, Astron Astrophys. Suppl. Ser., 32, 375
- Heap & Corcoran (1992) Heap, S. R., & Corcoran, M. F. 1992, ApJ, 387, 340
- Jaisawal & Naik (2015) Jaisawal, G.K. & Naik, S. 2015, MNRAS, 448, 620
- Jenke et al. (2012) Jenke, P. A. et al. 2012, ApJ, 759, 124
- Jones et al. (1973) Jones, C., Forman, W., Tananbaum, H., Schreier, E., Gursky, H., Kellogg, E., & Giacconi, R. 1973, ApJ, 181, L43
- Jonker et al. (1998) Jonker, P. G., et al. 1998, ApJ, 499, L191
- Khruzina & Cherepashchuk (1983) Khruzina & Cherepashchuk, A.M. 1983, SvAL. Let, 9, 78
- Klochkov et al. (2011) Klochkov, D. et al. 2011, A&A, 536, 8
- Kreykenbolm et al. (2008) Kreykenbolm, I. et al. 2008, A&A, 492, 511
- Kudryavtsev et al. (2001) Kudryavtsev, M. I., Svertilov, S. I., & Bogomolov, V. V. 2001, AstL, 27, 648
- Kuulkers & van der Klis (2000) Kuulkers, E & van der Klis, M. 2000, A&A, 356, L45
- Laurent et al. (1992) Laurent, P., Goldwurm, A., Lebrun, F., et al. 1992, A&A, 260, 237
- Laycock et al. (2003) Laycock, S., Coe, M. J., Wilson, C. A., Harmon, B. A., & Finger, M. 2003, MNRAS, 338, 21
- Lewin & van der Klis (2010) Lewin, W. & van der Klis, M. 2010, Compact Stellar Sources, Eds. by W. Lewin & van der Klis, Cambridge University Press, pp. 709
- Lin et al. (2009) Lin, D., Remillard, R.A. & Homan, J. 2009, ApJ, 696, 1257 (LRH09)
- Lin et al. (2007) Lin, D., Homan, J., Remillard, R., & Wijnands, R. 2007, Astron. Tel., 1183
- Makishima et al. (1990) Makishima et al. 1990, PASJ, 42, L27
- Markert et al. (1979) Markert, T. H., Winkler, P. F., Laird, F. N., et al. 1979, ApJS, 39, 573
- Mason et al. (1976) Mason, K. O., Branduardi, G., & Sanford, P. 1976, ApJ, 203, L29
- Orr et al. (2004) Orr, A., Falanga, M., Cocchi, M., Laurent, P., & Goldwurm, A. 2004, in Proc. 5th INTEGRAL Science Workshop, The INTEGRAL Universe, ed. V. Schonfelder, G. Lichti, & C. Winkler, ESA SP-552, 357
- Paizis et al. (2006) Paizis, A. et al. 2006, A&A, 459, 187
- Parmar et al. (1997) Parmar, A. et al. 1997, A&AS, 122, 309
- Petterson (1978) Petterson, J. A. 1978, ApJ, 224, 625
- Pietsch et al. (1980) Pietsch, W., Voges, W., Reppin, C., et al. 1980, ApJ, 237, 964
- Reynolds et al. (1999) Reynolds, A.P., Owens, A., Kaper, L., Parmar, A.N. & Segreto, A. 1999, A&A, 349
- Rodes-Roca et al. (2015) Rodes-Roca, J .J. et al. 2015, A&A, 580, 140
- Romano et al. (2015) Romano, P. et al. 2015, A&A, 576, L4
- Rubin et al. (1996) Rubin, B. C., et al. 1996, ApJ, 459, 259
- Rude et al. (2010) Rude, G. Orosz, J. A., McClintock, J. E. et al. 2010, BAAS, 419.05 (abs)
- Sanna et al. (2010) Sanna, A., Mndez, M., Altamirano, D. et al. 2010, MNRAS, 408, 622
- Seifina et al. (2015) Seifina, E., Titarchuk, L., Shader, Ch. & Shaposhnikov, N. 2015, ApJ, 808, 142 (STSS15)
- Seifina et al. (2014) Seifina, E. & Titarchuk, L. & Shaposhnikov, N. 2014, ApJ, 789, 57 (STS14)
- Seifina et al. (2013) Seifina, E., Titarchuk, L., & Frontera, F. 2013, ApJ, 766, 63 (STF13)
- Seifina & Titarchuk (2012) Seifina, E. & Titarchuk, L. 2012, ApJ, 747, 99 (ST12)
- Seifina & Titarchuk (2011) Seifina, E. & Titarchuk, L. 2011, ApJ, 738, 128 (ST11)
- Seifina & Titarchuk (2010) Seifina, E. & Titarchuk, L. 2010, ApJ, 722, 586 (ST10)
- Shakura & Sunyaev (1973) Shakura, N. I., & Sunyaev, R. A. 1973, A&A, 24, 337
- Shaposhnikov & Titarchuk (2009) Shaposhnikov, N., & Titarchuk, L. 2009, ApJ, 699, 453 (ST09)
- Shaposhnikov & Titarchuk (2004) Shaposhnikov, N. & Titarchuk L. 2004, ApJ, 606, L57
- Shrader et al. (2010) Shrader, Ch., Tiatrchuk, L. & Shaposhnikov, N. 2010, ApJ, 718, 488
- Smale et al. (1997) Smale, A. P., Zhang, W., & White, N. E. 1997, ApJL, 483, L119
- Stiele et al. (2013) Stiele, H., Belloni, T. M., Kalemci, E., & Motta, S. 2013, MNRAS, 429, 2655
- Strohmayer (1998) Strohmayer, T. 1998, in American Institute of Physics Conference Series, 397 (astro-ph/9802022v1)
- Taam & Fryxell (1988) Taam, R. E. & Fryxell, B.A. 1988, ApJ, 327, L73
- Titarchuk (1994) Titarchuk, L. 1994, ApJ, 429, 340
- Titarchuk et al. (1998) Titarchuk, L., Lapidus, I.I. & Muslimov, A. 1998, ApJ, 499, 315 (TLM98)
- Titarchuk & Lyubarskij (1995) Titarchuk, L., & Lyubarskij, Y. 1995, ApJ, 450, 876
- Titarchuk et al. (2014) Titarchuk, L., Seifina, E. & Shrader, Ch. 2014, ApJ, 789, 98 (TSS14)
- Titarchuk et al. (2013) Titarchuk, L., Seifina, E., & Frontera, F. 2013, ApJ, 767, 160 (TSF13)
- Titarchuk & Osherovich (1999) Titarchuk, L.G. & Osherovich, V.A. 1999, ApJ, 518, L95
- Titarchuk & Osherovich (1999) Titarchuk, L.G., Shaposhnikov, N. & Arefiev, V. 2007, ApJ, 660, 556
- Titarchuk & Shaposhnikov (2005) Titarchuk, L. & Shaposhnikov, N. 2005, ApJ, 626, 298
- Titarchuk & Seifina (2009) Titarchuk, L. & Seifina, E. 2009, ApJ, 706, 1463
- van der Meer et al. (2005) van der Meer A., Kaper L., di Salvo T. et al. 2005, A&A, 432, 999
- van Paradijs (1978) van Paradijs, J. 1978, Nature, 274, 650
- Zhang et al. (2006) Zhang, C. M., Yin, H. X., Zhao, Y. H., Zhang, F., & Song, L. M. 2006, MNRAS, 366, 1373
| Parameters | Value | References |
|---|---|---|
| Orbital period, | 3.412 days | (1) |
| Orbital eccentricity, | 0.01 | (2) |
| Orbital inclination, | 66∘ | (2) |
| Mass of O6f star, | 27.4, | (2, 3) |
| Mass of compact object, | 2.1 - 2.3, | (2, 3) |
| Source distance, | 1.9 kpc | (4) |
References: (1) Boroson et al. 2003; Haberl, White & Kallman 1989; (2) Rubin et al. 1996; (3) Abubekerov 2004; (4) Ankay et al. 2001.
| Satellite | Obs. ID | Start time (UT) | End time (UT) | MJD interval | Exposure (ks) | |
|---|---|---|---|---|---|---|
| SAX | 203390011 | 1997 April 1 11:20:47 | 1997 April 1 21:51:19 | 50,539.4 – 50,539.9 | 23.7a | |
| 4010580102 | 2006 Sept. 13 10:44:38 | 2006 Sept. 14 22:03:14 | 53,991.4 – 53,993.1 | 82.1b |
| Number of set | Dates, MJD | Exposures, s | RXTE Proposal ID | Dates UT | |
|---|---|---|---|---|---|
| R1 | 50,334-50,339 | 29 685 | 101481 | Sept. 8 – 13, 1996 | |
| R2 | 51,285-51,408 | 2 687 688 | 300941 | April 17 – Aug. 17, 1999 | |
| R3 | 51,129-51,193 | 53 238 | 300951 | Nov. 12 1998 – Jan. 15, 1999 | |
| R4 | 51,776-51,779 | 1 945 005 | 400681 | Aug. 20 – 23, 2000 | |
| R5 | 52,890.09-52,890.2 | 9 535 | 801051 | Sept. 8, 02:19:28 – 03:51:56, 2003 |
Reference: (1) Dolan 2011
| Model | Parameter | 00-20339001 | 0-401058010 | 10148-01-02-00 |
|---|---|---|---|---|
| phabs | NH (cm-2) | 2.80.1 | 3.780.02 | 5.7frozen |
| bbody | kTBB (keV) | 0.990.02 | 0.980.03 | 0.480.06 |
| N | 0.070.01 | 0.0110.06 | 0.50.1 | |
| comptb | 1.020.01 | 1.000.05 | 0.820.07 | |
| kTs (keV) | 1.360.04 | 1.390.07 | 2.00.1 | |
| log A | 1.290.03 | 0.860.03 | 0.740.03 | |
| kTe (keV) | 13.980.08 | 9.620.06 | 10.30.2 | |
| N | 7.470.05 | 15.190.09 | 4.380.08 | |
| Gaussian | Eline (keV) | 6.700.08 | 6.790.09 | 6.560.04 |
| (keV) | 0.650.05 | 0.600.01 | 0.600.01 | |
| N | 0.430.06 | 0.260.07 | 0.030.01 | |
| (d.o.f.) | 3.2 (340) | 1.59 (421) | 12.3 (86) | |
| phabs | NH (cm-2) | 2.90.1 | 3.760.02 | 5.7frozen |
| bbody | kTBB (keV) | 0.560.07 | 0.530.02 | 0.600.07 |
| N | 0.0840.001 | 0.0120.004 | 0.0010.001 | |
| comptb1 | 1.000.03 | 1.010.07 | 0.970.02 | |
| kTs1 (keV) | 1.390.05 | 1.320.03 | 2.00.1 | |
| log A1 | 2.0††† | 2.0††† | 2.0††† | |
| kT (keV) | 15.30.4 | 8.470.08 | 9.70.1 | |
| N | 2.280.05 | 2.340.05 | 3.650.09 | |
| comptb2 | 0.410.02 | 0.340.06 | 0.690.03 | |
| kTs2 (keV) | 0.830.06 | 0.800.09 | 1.050.08 | |
| kT (keV) | 968 | 1009 | 432 | |
| log A2 | 2.0††† | 2.0††† | 0.390.04 | |
| N | 0.140.07 | 0.50.1 | 0.80.1 | |
| Gaussian | Eline (keV) | 6.480.07 | 6.420.04 | 6.510.03 |
| N | 0.160.8 | 0.250.09 | 0.050.02 | |
| (d.o.f.) | 0.96 (338) | 1.09 (419) | 1.12 (83) |
† Parameter errors are given at the 90% confidence level. †† The normalization parameters of Blackbody and Comptb components are in units of , where is the soft photon luminosity in units of 1037 erg/s, is the distance to the source in units of 10 kpc and Gaussian component is in units of in line; ††† parameter is fixed at 2.0 for the two-Comptb models; of Gaussian component is fixed to a value 0.6 keV for the model phabs*(Blackbody+Comptb1+Comptb2+Gaussian) (see comments in the text); is units of cm-2.
| Observational | MJD, | Exp | , | , | N | E, | |||||||||
|---|---|---|---|---|---|---|---|---|---|---|---|---|---|---|---|
| ObsId | day | ks | keV | keV | keV | keV | (d.o.f.) | ||||||||
| 10148-01-01-000 | 50334.29 | 11.759 | 0.99(2) | 10.28(7) | 5.73(2) | 1.42(3) | 0.53(4) | 0.73(6) | 0.34(9) | 70(5) | 0.36(4) | 0.8(2) | 6.50(1) | 0.06(2) | 1.17(81) |
| 10148-01-02-00 | 50339.01 | 7.567 | 0.97(2) | 9.6(1) | 3.62(9) | 2.0(1) | 0.001(1) | 1.04(7) | 0.68(3) | 42(2) | 0.39(5) | 0.9(1) | 6.51(3) | 0.05(2) | 1.12(81) |
| 10148-01-03-000 | 50335.41 | 10.847 | 1.00(1) | 10.5(1) | 4.40(3) | 1.80(2) | 0.001(1) | 0.81(1) | 0.37(5) | 74(8) | 0.37(2) | 0.9(2) | 6.54(5) | 0.06(2) | 1.24(81) |
| 30094-01-01-00 | 51285.53 | 11.359 | 1.07(4) | 8.8(1) | 2.03(3) | 1.8(1) | 0.002(1) | 0.96(2) | 1.02(4) | 23(2) | 0.32(4) | 0.7(1) | 6.53(2) | 0.04(2) | 0.91(81) |
| 30094-01-02-00 | 51285.26 | 3.599 | 1.00(2) | 20.01(2) | 0.09(3) | 1.25(2) | 0.003(1) | 1.10(3) | 1.01(7) | 24(3) | 0.34(3) | 0.6(1) | 6.50(1) | 0.06(2) | 0.85(81) |
| 30094-01-03-00 | 51285.33 | 3.583 | 0.99(7) | 20.45(3) | 0.01(3) | 1.23(1) | 0.002(1) | 1.09(2) | 1.01(5) | 25(2) | 0.36(4) | 0.03(1) | 6.41(1) | 0.05(2) | 0.87(81) |
| 30094-01-04-00 | 51285.39 | 3.567 | 1.05(4) | 19.01(2) | 0.19(3) | 1.24(3) | 0.003(2) | 1.12(3) | 1.03(7) | 27(4) | 2.00†† | 0.03(2) | 6.42(2) | 0.05(1) | 0.85(80) |
| 30094-01-05-00 | 51285.51 | 3.615 | 0.97(2) | 16.3(1) | 0.74(5) | 1.25(2) | 0.003(1) | 1.13(4) | 1.02(3) | 20(7) | 0.37(2) | 0.01(1) | 6.41(1) | 0.05(2) | 1.05(81) |
| 30094-01-06-00 | 51288.33 | 3.711 | 0.98(3) | 21.9(2) | 0.25(3) | 1.23(4) | 0.004(3) | 1.11(3) | 1.01(3) | 20(9) | 0.36(4) | 0.01(1) | 6.46(2) | 0.05(1) | 1.07(81) |
| 30094-01-07-00 | 51288.39 | 3.599 | 0.99(5) | 24.2(1) | 0.17(3) | 1.25(3) | 0.004(2) | 1.07(5) | 0.94(1) | 21(6) | 0.09(2) | 0.01(1) | 6.46(2) | 0.26(1) | 1.22(81) |
| 30094-01-08-00 | 51291.21 | 3.088 | 1.00(9) | 6.48(9) | 1.46(2) | 1.54(2) | 0.001(1) | 1.10(2) | 1.00(5) | 22(1) | -0.15(1) | 0.63(4) | 6.41(3) | 0.23(4) | 1.02(81) |
| 30094-01-09-00 | 51291.26 | 3.775 | 1.01(8) | 9.8(1) | 11.67(9) | 1.88(9) | 0.10(2) | 1.01(1) | 0.51(3) | 52(8) | -0.32(4) | 1.06(9) | 6.52(8) | 0.74(9) | 1.14(81) |
| 30094-01-10-00 | 51291.33 | 3.152 | 1.02(3) | 20.0(8) | 0.39(2) | 1.25(7) | 0.004(1) | 0.9(1) | 0.6(2) | 49(7) | 2.00†† | 0.02(1) | 6.46(2) | 0.26(1) | 1.04(80) |
| 30094-01-11-00 | 51291.59 | 6.815 | 0.99(5) | 16.1(1) | 0.12(5) | 1.25(2) | 0.001(1) | 1.10(1) | 1.0(10) | 20(1) | 0.35(6) | 0.03(1) | 6.39(7) | 0.03(1) | 0.90(81) |
| 30094-01-12-00 | 51291.87 | 9.215 | 1.00(2) | 8.00(1) | 0.09(3) | 2.01(4) | 0.001(1) | 0.89(4) | 0.40(8) | 90(10) | 2.00†† | 0.08(8) | 6.47(2) | 0.10(1) | 1.10(80) |
| 30094-01-13-00 | 51292.07 | 1.152 | 1.01(4) | 18.0(3) | 0.05(3) | 1.26(3) | 0.002(1) | 1.10(1) | 1.07(3) | 19(2) | 2.00†† | 0.07(1) | 6.46(3) | 0.09(2) | 1.11(80) |
| 30094-01-14-00 | 51294.79 | 10.623 | 1.00(8) | 9.05(2) | 1.39(3) | 2.05(1) | 0.010(1) | 0.96(3) | 0.65(4) | 52(3) | -0.15(4) | 0.10(6) | 6.39(2) | 0.27(2) | 0.95(81) |
| 30094-01-15-00 | 51298.06 | 1.360 | 1.01(7) | 15.87(6) | 3.32(3) | 1.76(4) | 0.020(3) | 0.86(3) | 0.40(6) | 69(5) | 2.00†† | 0.09(3) | 6.38(4) | 0.24(3) | 1.06(80) |
| 30094-01-16-00 | 51298.13 | 1.599 | 0.89(5) | 16.5(2) | 2.93(5) | 1.64(2) | 0.003(2) | 0.84(2) | 0.35(3) | 86(12) | 2.00†† | 0.09(5) | 6.39(3) | 0.25(3) | 0.89(80) |
| 30094-01-17-00 | 51298.61 | 1.712 | 1.03(7) | 15.17(6) | 0.17(4) | 1.24(6) | 0.002(4) | 1.11(3) | 1.02(3) | 23(2) | 0.37(8) | 0.03(2) | 6.42(2) | 0.032(4) | 1.18(81) |
| 30094-01-18-00 | 51298.67 | 1.536 | 1.06(3) | 15.78(5) | 0.12(3) | 1.26(3) | 0.003(1) | 1.00(5) | 1.00(4) | 24(2) | 0.52(6) | 0.02(1) | 6.42(3) | 0.013(3) | 0.76(81) |
| 30094-01-20-00 | 51298.79 | 2.496 | 1.01(5) | 17.32(7) | 0.19(7) | 1.25(2) | 0.003(1) | 1.01(2) | 0.97(3) | 23(2) | 0.71(4) | 0.03(2) | 6.45(8) | 0.014(3) | 0.83(81) |
| 30094-01-21-00 | 51298.86 | 2.432 | 0.99(6) | 17.54(6) | 0.13(3) | 1.24(4) | 0.004(1) | 1.00(3) | 1.03(3) | 22(3) | 0.46(3) | 0.02(1) | 6.50(7) | 0.015(3) | 1.35(81) |
| 30094-01-22-00 | 51301.60 | 1.599 | 1.02(8) | 11.58(2) | 2.22(1) | 1.87(3) | 0.52(1) | 0.83(2) | 0.20(3) | 90(15) | 2.00†† | 0.08(3) | 6.42(3) | 0.25(2) | 1.36(80) |
| 30094-01-23-00 | 51301.65 | 1.999 | 0.97(7) | 13.18(1) | 3.15(2) | 1.38(6) | 0.02(1) | 0.81(6) | 0.25(3) | 86(11) | 2.00†† | 0.09(4) | 6.45(2) | 0.24(3) | 0.74(80) |
| 30094-01-24-00 | 51301.76 | 2.016 | 0.98(8) | 13.04(2) | 5.87(1) | 1.49(5) | 0.023(2) | 0.85(2) | 0.27(3) | 80(11) | 2.00†† | 0.07(3) | 6.52(3) | 0.10(3) | 0.85(80) |
| 30094-01-26-00 | 51301.87 | 2.304 | 1.04(7) | 7.89(8) | 0.20(6) | 2.1(2) | 0.004(1) | 1.00(3) | 1.07(3) | 29(2) | -0.22(4) | 0.27(2) | 6.46(2) | 0.39(4) | 1.33(81) |
| 30094-01-27-00 | 51309.39 | 1.728 | 1.02(9) | 12.05(2) | 0.90(5) | 1.23(4) | 0.002(1) | 1.10(5) | 1.00(3) | 23(14) | 0.35(2) | 0.10(3) | 6.52(3) | 0.05(2) | 0.99(81) |
| 30094-01-28-00 | 51309.52 | 2.479 | 1.04(4) | 14.19(3) | 4.18(2) | 1.10(1) | 0.002(1) | 0.85(2) | 0.34(3) | 84(15) | 2.00†† | 0.009(1) | 6.40(4) | 0.25(6) | 1.12(80) |
| 30094-01-29-00 | 51309.58 | 2.672 | 0.94(6) | 9.73(2) | 2.32(3) | 1.68(2) | 0.001(1) | 0.81(2) | 0.29(3) | 91(10) | 2.00†† | 0.30(8) | 6.39(2) | 0.24(4) | 0.94(80) |
| 30094-01-30-00 | 51326.9 | 1.792 | 0.97(9) | 8.37(2) | 0.15(7) | 2.0(2) | 0.50(1) | 1.09(3) | 0.79(3) | 45(4) | 0.7(1) | 0.11(7) | 6.43(3) | 0.38(9) | 1.08(81) |
| 30094-01-31-00 | 54124.9 | 1.792 | 0.99(3) | 8.50(4) | 1.41(9) | 2.12(6) | 0.020(3) | 0.79(5) | 0.20(3) | 100(20) | 2.00†† | 0.08(3) | 6.41(2) | 0.24(4) | 1.19(74) |
| 30094-01-32-00 | 54124.9 | 1.728 | 0.98(7) | 8.37(3) | 0.19(3) | 2.0(1) | 1.001(1) | 1.09(3) | 1.01(3) | 23(4) | 0.70(4) | 0.11(7) | 6.43(4) | 0.38(2) | 1.23(81) |
| 30094-01-33-00 | 51407.70 | 3.392 | 1.02(2) | 8.37(2) | 0.21(7) | 1.28(7) | 0.001(1) | 1.09(2) | 0.70(3) | 67(12) | -0.4(1) | 0.14(3) | 6.41(3) | 0.17(1) | 1.13(81) |
| 30094-01-34-00 | 51407.37 | 1.712 | 0.97(6) | 8.36(5) | 0.01(3) | 2.02(4) | 0.005(2) | 1.02(1) | 0.62(2) | 79(14) | 2.00†† | 0.03(3) | 6.42(5) | 0.04(1) | 0.89(80) |
† The spectral model is phabs*(blackbody + Comptb1 + Comptb2 + Gaussian); color temperature of Bbody component is fixed at 0.6 keV (see comments in the text); †† parameter is fixed at 2.0 and when parameter , this parameter is fixed at 2.0 (see comments in the text), ††† normalization parameters of and components are in units of , where is the source luminosity in units of 1037 erg/s, is the distance to the source in units of 10 kpc and Gaussian component is in units of in line; †††† of Gaussian component is fixed to a value 0.7 keV (see comments in the text), was free to vary within the range of (2 – 8) cm-2 (see comments in the text).
| Observational | MJD, | Exp | , | , | N | E, | |||||||||
|---|---|---|---|---|---|---|---|---|---|---|---|---|---|---|---|
| ObsId | day | ks | keV | keV | keV | keV | (d.o.f.) | ||||||||
| 30095-01-01-00 | 51129.66 | 3.647 | 1.04(3) | 12.89(2) | 21.7(1) | 2.03(1) | 0.11(8) | 0.89(5) | 0.5(1) | 72(19) | -0.39(5) | 1.03(6) | 6.48(2) | 2.0(2) | 1.19(81) |
| 30095-01-01-01 | 51130.27 | 3.023 | 1.01(8) | 15.81(8) | 2.62(2) | 1.48(2) | 0.020(3) | 0.82(2) | 0.35(9) | 80(20) | -0.07(3) | 0.10(3) | 6.42(1) | 0.24(5) | 1.19(81) |
| 30095-01-01-02 | 51129.23 | 3.455 | 0.99(9) | 12.87(1) | 0.02(4) | 2.08(1) | 0.002(3) | 0.96(4) | 0.59(8) | 60(15) | -0.15(2) | 0.20(4) | 6.46(2) | 0.85(4) | 1.18(81) |
| 30095-01-01-03 | 51129.73 | 3.695 | 1.05(4) | 10.12(9) | 7.20(5) | 1.95(4) | 0.12(1) | 0.89(3) | 0.5(2) | 73(18) | -0.48(7) | 1.02(8) | 6.40(3) | 0.81(7) | 0.82(81) |
| 30095-01-01-04 | 51129.80 | 3.695 | 1.09(7) | 9.94(3) | 6.63(8) | 1.37(2) | 0.93(4) | 0.91(2) | 0.59(7) | 67(21) | -0.11(8) | 0.20(9) | 6.41(5) | 0.80(9) | 0.89(81) |
| 30095-01-01-05 | 51129.86 | 5.120 | 1.10(6) | 11.58(2) | 6.63(7) | 1.93(5) | 0.002(6) | 0.95(5) | 0.69(8) | 69(20) | -0.12(7) | 0.21(7) | 6.41(3) | 0.96(7) | 0.96(81) |
| 30095-02-01-04 | 51114.63 | 1.135 | 0.89(4) | 10.11(9) | 6.54(3) | 1.49(4) | 0.51(3) | 1.09(2) | 0.93(8) | 27(3) | -0.15(3) | 0.32(4) | 6.42(2) | 0.73(8) | 1.19(81) |
| 30095-02-01-05 | 51114.56 | 3.455 | 0.98(7) | 10.16(8) | 6.56(3) | 1.47(3) | 0.50(2) | 1.06(2) | 0.95(7) | 30(6) | -0.14(3) | 0.30(2) | 6.42(5) | 0.72(9) | 1.18(81) |
| 30095-02-02-00 | 51193.01 | 12.671 | 1.01(8) | 8.37(2) | 1.03(3) | 2.0(1) | 0.13(1) | 1.09(3) | 0.89(3) | 30(4) | 2.00†† | 0.05(7) | 6.49(2) | 0.09(1) | 1.17(80) |
| 30095-02-02-01 | 51193.21 | 3.503 | 0.95(6) | 8.35(6) | 0.11(4) | 2.0(2) | 0.11(6) | 1.08(2) | 1.01(2) | 26(3) | 2.00†† | 0.06(8) | 6.50(3) | 0.02(1) | 1.14(80) |
| 30095-02-02-02 | 51193.39 | 3.312 | 0.98(2) | 10.22(3) | 2.94(2) | 1.49(2) | 0.028(1) | 0.78(8) | 0.20(3) | 100(20) | -0.56(9) | 0.30(4) | 6.42(2) | 0.41(5) | 1.12(81) |
| 30095-02-02-03 | 51193.39 | 6.527 | 1.01(8) | 22.59(2) | 0.43(3) | 2.04(3) | 0.027(1) | 1.08(3) | 0.98(4) | 23(3) | 0.35(4) | 0.14(5) | 6.42(8) | 0.10(3) | 1.11(81) |
| 40068-01-01-01 | 51777.13 | 1.888 | 1.03(5) | 10.84(9) | 5.60(2) | 1.53(6) | 0.92(3) | 1.53(6) | 1.00(3) | 26(9) | 2.00†† | 0.70(4) | 6.97(3) | 0.24(1) | 0.83(80) |
| 40068-01-01-02 | 51778.19 | 13.871 | 1.02(7) | 9.84(7) | 6.75(6) | 1.30(2) | 0.01(1) | 0.81(3) | 0.31(2) | 69(12) | 2.00†† | 0.10(3) | 6.51(7) | 0.54(9) | 1.15(80) |
| 40068-01-01-03 | 51777.20 | 1.648 | 1.06(2) | 6.93(1) | 1.9(1) | 1.15(9) | 0.001(3) | 1.26(4) | 1.00(3) | 21(6) | 2.00†† | 0.70(4) | 6.40(3) | 0.21(6) | 1.14(80) |
| 40068-01-01-04 | 51779.05 | 1.456 | 1.02(8) | 10.72(3) | 4.62(4) | 1.8(1) | 0.05(1) | 0.8(1) | 0.30(3) | 90(25) | -0.54(7) | 0.40(1) | 6.47(8) | 0.53(7) | 1.16(81) |
| 40068-01-01-05 | 51778.12 | 1.856 | 0.99(7) | 10.53(1) | 6.92(2) | 1.67(3) | 0.02(3) | 0.83(2) | 0.34(7) | 83(20) | -0.40(3) | 0.10(3) | 6.39(3) | 0.10(2) | 1.19(81) |
| 40068-01-01-06 | 51779.12 | 1.888 | 1.01(2) | 9.05(2) | 3.69(4) | 2.07(5) | 0.03(1) | 1.09(7) | 0.9(1) | 25(4) | -0.15(3) | 2.07(3) | 6.38(2) | 0.15(8) | 1.17(81) |
| 40068-01-01-07 | 51779.18 | 2.272 | 1.07(7) | 12.30(6) | 1.28(3) | 1.65(4) | 0.02(2) | 0.81(2) | 0.36(9) | 74(23) | -0.40(3) | 0.10(4) | 6.37(8) | 0.10(2) | 1.19(81) |
| 40068-01-01-08 | 51778.05 | 1.440 | 1.02(3) | 10.74(4) | 2.20(9) | 1.71(5) | 0.001(3) | 0.79(3) | 0.3(2) | 81(20) | 2.00†† | 0.70(6) | 6.40(7) | 0.33(5) | 1.13(80) |
| 40068-01-01-09 | 51777.85 | 1.616 | 1.01(6) | 8.53(7) | 4.12(8) | 1.56(4) | 0.001(3) | 0.82(4) | 0.34(5) | 73(20) | 0.46(5) | 0.63(3) | 6.41(6) | 0.27(8) | 1.12(81) |
| 40068-01-01-10 | 51777.79 | 2.896 | 1.00(7) | 1.71(3) | 22.68(3) | 2.05(7) | 0.002(3) | 1.09(2) | 1.01(3) | 23(2) | 0.35(4) | 2.0(1) | 6.40(8) | 0.05(2) | 0.84(81) |
| 40068-01-01-011G | 51777.26 | 11.615 | 1.02(8) | 9.94(7) | 9.94(2) | 2.12(6) | 0.002(3) | 1.08(3) | 1.04(3) | 19(1) | 0.31(7) | 3.0(2) | 6.43(2) | 0.10(8) | 1.13(81) |
| 40068-01-01-14 | 51778.98 | 1.008 | 1.03(5) | 7.02(3) | 1.2(1) | 1.75(7) | 0.001(3) | 1.10(2) | 1.0(2) | 19(3) | 2.00†† | 0.55(6) | 6.45(9) | 0.18(5) | 1.11(80) |
| 40068-01-01-15 | 51779.25 | 2.672 | 1.05(3) | 10.55(9) | 3.23(4) | 1.84(3) | 0.001(3) | 0.80(3) | 0.20(3) | 100(20) | -0.14(3) | 0.12(3) | 6.41(8) | 0.31(4) | 1.16(81) |
| 40068-01-01-16 | 51777.52 | 2.768 | 1.02(5) | 10.83(1) | 6.88(3) | 1.42(6) | 0.51(1) | 0.80(4) | 0.29(3) | 90(9) | -0.35(4) | 0.09(4) | 6.40(3) | 0.69(8) | 0.93(81) |
| 40068-01-01-17 | 51777.59 | 9.999 | 0.98(8) | 10.12(3) | 3.85(2) | 1.54(2) | 0.52(2) | 0.91(2) | 0.51(7) | 52(4) | 2.00†† | 0.08(2) | 6.42(7) | 0.38(6) | 1.08(80) |
| 80105-14-01-00 | 52890.09 | 9.535 | 1.00(2) | 9.47(5) | 2.35(4) | 1.39(3) | 0.50(1) | 1.04(3) | 0.91(2) | 27(2) | 2.00†† | 0.3(1) | 6.49(2) | 0.33(5) | 1.15(80) |
† The spectral model is phabs*(blackbody + Comptb1 + Comptb2 + Gaussian); color temperature of Bbody component is fixed at 0.6 keV (see comments in the text); †† parameter is fixed at 2.0 and when parameter , this parameter is fixed at 2.0 (see comments in the text), ††† normalization parameters of and components are in units of , where is the source luminosity in units of 1037 erg/s, is the distance to the source in units of 10 kpc and Gaussian component is in units of in line; †††† of Gaussian component is fixed to a value of 0.7 keV (see comments in the text), was free to vary within the range of (2 – 8) cm-2 (see comments in the text).
| Source | Alternative | Class(8) | Distance, | Presence of | , | |||
|---|---|---|---|---|---|---|---|---|
| name | name | kpc | kHz QPO | keV | keV | |||
| Sco X-1 | V818 Sco | Z, Sp, B | 2.8(9) | +(10) | 3-180 | 0.3-3.4 | 0.4-1.8 | 0.08-1 |
| 4U 1642-45 | GX 340+0 | Z, Sp, B | 10.5(11) | +(14) | 3-21 | 0.08-0.2 | 1.1-1.5 | 0.01-0.5 |
| 4U 1744-26 | GX 3+1 | Atoll, Sp, B | 4.5(12) | none(15) | 2.3-4.5 | 0.04-0.15 | 1.16-1.7 | 0.2-0.9 |
| 4U 1728-34 | GX 354-0 | Atoll, Su, D | 4.2-6.4(13) | +(16) | 2.5-15 | 0.02-0.09 | 1.3 | 0.5-1 |
| 4U 1820-30 | … | Atoll, Su, B | 5.8-8(17) | +(18) | 2.9-21 | 0.02-0.14 | 1.1-1.7 | 0.2-1 |
| XTE J1701-462 | … | Atoll+Z, Su, D | 8.8(19) | +(20) | … | … | 1-2.7 | … |
| 4U 1705-44 | … | Atoll, Sp, B | 7.4(21) | +(22) | 2.7-100 | 0.01-0.08 | 1.1-1.5 | 0.2-1 |
| 4U 1700-37 | HD153919 | HMXB, Sp, B | 1.9(23) | none(24) | 2-100 | 0.001-0.22 | 1.3-2.1 | 0.1-1 |
References: (1) TSS14; (2) STF13; (3) ST12; (4) ST11; (5) TSF13; (6) STSS15; (7) LRH09; (8) Classification of the system in the various schemes (see text): Sp = supercritical, Su = subcritical, B = bulge, D = disk; (9) Bradshaw et al. (1999); (10) Zhang et al. (2006); (11) Fender & Henry (2000), Ford et al. (1998), Christian & Swank (1997); (12) Kuulkers & van der Klis (2000), Ford et al. (2000); (13) van Paradijs (1978); (14) Jonker et al. (1998); (15) Strohmayer (1998); (16) Titarchuk & Osherovich (1999); (17) Shaposhnikov & Titarchuk (2004); (18) Smale et al. (1997); (19) Lin et al. (2007), Lin et al. (2009); (20) Sanna et al. (2010); (21) Haberl & Titarchuk (1995); (22) BO02; (23) Ankay et al. (2001); (24) Borozon et al. (2003)