Terahertz properties of Dirac fermions in HgTe films with optical doping.
Abstract
Terahertz properties of mercury telluride (HgTe) films with critical thickness are presented and discussed. The density of the charge carriers is controlled using contact-free optical doping by visible light. In the magneto-optical response of HgTe the contribution of two types of carriers (electrons and holes) can be identified. The density of the electrons can be modified by light illumination by more than one order of magnitude. As the hole density is roughly illumination-independent, the terahertz response of the illuminated samples becomes purely electronic. In some cases, light illumination may switch the qualitative electrodynamic response from hole-like to the electron-like. The cyclotron mass of the electrons could be extracted from the data and shows a square root dependence upon the charge concentration in the broad range of parameters. This can be interpreted as a clear proof of a linear dispersion relations, i.e. Dirac-type charge carriers.
I Introduction
Physical properties of relativistic Dirac states Hasan and Kane (2010); Qi et al. (2008) have attracted much interest recently, as they exhibit a number of unusual and nontrivial electrodynamic properties. These effects arise from linear dispersion of the charge carries known as Dirac cone. Within a Dirac cone the cyclotron effective mass of the charge carriers strongly depends upon the position of the Fermi level (as controlled by the charge density) and vanishes at the center of the cone. Unusual electrodynamics at the interface between classical and quantum physics is expected as, e.g., a universal Faraday effect or an anomalous Kerr rotation Tse and MacDonald (2010, 2011); Maciejko et al. (2010); Tkachov and Hankiewicz (2011).
Among various materials the system HgTe is outstanding as it provides a universal tool to investigate several complementary effects within the same composition. Bulk HgTe is a zero-gap semiconductor due to the degeneracy of the two hole bands at the gamma point. The energy gap is finite for thin strained films, which leads to a freezing out of the bulk carriers at low temperatures. Therefore, for strained bulk samples the pure two-dimensional (2D) character of electrons can be expected, which allows to search for unusual electrodynamics as predicted by theory of topological insulators. In static transport experiments, a strained HgTe layer exhibits a quantum Hall effect (QHE) Brüne et al. (2011), yielding direct evidence that the charge carriers in these layers are confined to the topological two-dimensional (2D) surface states of the material.
The bulk HgTe is characterised by an inverted band structure. This means that the band (which in conventional semiconductors is a conduction band) lays below the bands (which are normally the light- and heavy-holes bands). In such a case the band is a completely filled valence band, the heavy-holes subband of is a valence band and the light-holes subband of is the conduction band. As the light- and heavy-holes bands are degenerate at the center of the Brillouin zone, HgTe is a zero-gap semiconductor. As the sample thickness is decreased, the band rises in the energy and at the critical thickness of 6.3 nm passes over the bands. At smaller thicknesses, band is located above the bands and HgTe becomes a ”conventional” semiconductor with the non-zero gap. Exactly at the critical thickness of 6.3 nm, when the and the light holes from the bands are touching each other, they form a Dirac cone. Therefore, the Dirac-like dispersion is a bulk band-structure effect in HgTe films with critical thickness Büttner et al. (2011).
Magneto-optical experiments in semiconductor films provide a well-established tool to investigate the charge dynamics in external magnetic fields Palik and Furdyna (1970). Earlier this technique was successfully applied to investigate the complicated band structure in HgTe single crystals. More recently, the magneto-optics especially in the terahertz range have been utilized to study the two- and three-dimensional conducting states in graphene, Bi2Se3 and HgTe Shuvaev et al. (2011); Hancock et al. (2011); Shuvaev et al. (2013a). Compared to transport methods, optical measurements have the advantages of being contact-free and of directly accessing the effective mass via the cyclotron resonance. Both the presence of contacts and the patterning could lead to substantial changes of carrier concentration and of the position of the Fermi level. In the case of topological insulators these are very crucial parameters as the most interesting phenomena are expected in the vicinity of the Dirac point. The ability to observe the cyclotron resonance is another advantage of the magneto-optical technique. The cyclotron mass of the charge carriers can be determined from the resonance frequency via and it is directly connected to the band structure near the Fermi level. Here is the electron charge and is the external magnetic field.
In experiments on the electrodynamics of topological insulators, the control of the charge density is very important. Such parameter is necessary to shift the Fermi level between electron- and hole-conduction within the Dirac cone. A classical tool to achieve this goal to use a transparent gate electrode to change the charge concentration. Recently, it has been demonstrated that a gated topological insulator may effectively be used to control the intensity and polarization of the terahertz radiation at room temperature Shuvaev et al. (2013b).
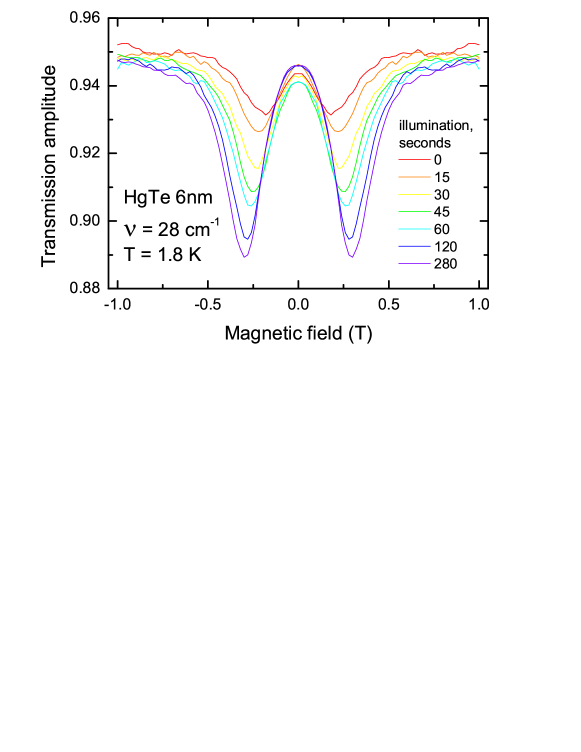
Here we concentrate on an alternative route to modify the charge density in topological insulators: light illumination (Figure 1). This method is well established in HgTe semiconductors with both parabolic and linear dispersions Kvon et al. (2012); Ikonnikov et al. (2011); Olbrich et al. (2013); Zoth et al. (2014) and is based on specific properties of the dispersion relations in this material. At low temperatures the channel of recombination of the photoinduced electrons is forbidden by the momentum conservation. The light illumination has several advantages compared to the gate method: the surface of the sample remains clear and the charges are distributed more homogeneously along the surface and in the bulk.
HgTe films
The samples presented in this paper are epitaxial mercury telluride films with the thickness of 6.3 nm grown on the [013] GaAs substrate. This thickness has been demonstrated to reveal a critical value for which the dispersion relations of electrons form a Dirac cone Bernevig et al. (2006); König et al. (2007).
An important feature of the HgTe samples is the ability to tune the charge carriers density via induced photoconductivity. The visible light illumination causes the electron density to increase. At low temperatures such additional charge carriers are sustained for the long time period (of the orders of weeks) and the temperature cycling up to room temperatures is needed in order to relax these carriers back to their impurities centers. Experimentally, the dark cooled sample has the one-way possibility to increase the charge concentration via illumination. In our setup this was achieved by means of green light LED mounted behind the nontransparent windows made of black paper (which is transparent for the terahertz radiation and opaque for infrared and visible light). The amount of additional charge carriers brought into the conduction band is controlled by the illumination time.
II Terahertz spectroscopy of cyclotron resonance
Spectroscopic experiments in the terahertz frequency range (3 cm-1 30 cm-1) have been carried out in a Mach-Zehnder interferometer arrangement Volkov et al. (1985) which allows measurements of the amplitude and the phase shift in a geometry with controlled polarization of radiation. Theoretical transmittance curves Shuvaev et al. (2012) for various geometries were calculated from the susceptibilities using Fresnel optical equations for the complex transmission coefficient and within the Berreman formalism Berreman (1972).
The main results shown in this paper were obtained in the constant-frequency measurement mode. In such case the frequency of the terahertz radiation is fixed and both the transmission amplitude and the phase shift of the radiation passing through the sample is measured as a function of the magnetic field. With respect to the polarization of the radiation there are two main geometries which were used in our work. (In both cases a wire-grid polarizer was placed in front of the sample producing linearly polarized incidence wave.) In one case another wire-grid polarizer placed behind the sample was oriented parallel to the incident polarization. We denote this arrangement as parallel polarizers geometry. In the other case the second polarizer was oriented at with respect to the first one. This layout is called crossed polarizers geometry. Measuring the amplitude and the phase shift of the transmitted radiation in two geometries corresponds to full determination of the transmission matrix of the sample Shuvaev et al. (2012). It should be noted that for the case of trivial sample like isotropic dielectric only signal in the parallel geometry is expected. Nonzero signal in the crossed geometry is indicative of some sort of polarization rotation or appearance of nonzero ellipticity after passing through the sample.
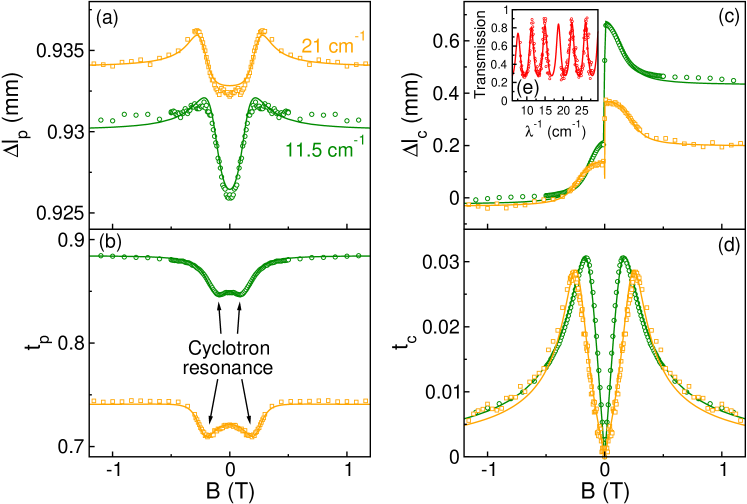
Typical measured data of HgTe films in parallel and crossed geometries are shown in Fig. 2. The transmission amplitude in the parallel geometry is shown in the lower left panel (b). Two distinct symmetrical minima are clearly seen at low fields. They correspond to the cyclotron resonance on free charge carriers in HgTe film. The minima at 21 cm-1 are located at higher fields than the minima at 11.5 cm-1, which is in accordance with the linear dependence of cyclotron resonance upon magnetic field: . For the case of charge carriers with Dirac-like dispersion a nontrivial dependence of cyclotron resonance could be expected: . However this case is realized only at high magnetic fields, when only few Landau levels are filled and the transitions between the Landau levels are observed separately. In the present case several transitions between the Landau levels are overlapping, which leads to a recovery of the classical behaviour with .
The lower right panel of Fig. 2 demonstrates the transmission amplitude in the crossed polarizers geometry. The signal is zero without magnetic field, rises rapidly in low fields reaching a maximum value and decreases upon further increase of magnetic field. The emergence of the nonzero crossed signal is the manifestation of the ac-Hall effect. Detailed analysis of the data including the phase shift shows that both the rotation of the polarization and the nonzero ellipticity of the radiation after passing through the sample are present in HgTe. For a rather clean sample where the relaxation rate of charge carriers is lower than the cyclotron frequency, , the maximum in the crossed transmission signal also correspond to the position of the cyclotron resonance.
Upper panels of Fig. 2 show magnetic field dependence of the phase shift of the radiation after passing though the sample. The upper left panel (a) corresponds to the parallel polarizers geometry and the upper right panel (c) to the crossed polarizers geometry. The phase shift is represented as a geometrical shift of the mirror of the spectrometer needed to compensate for the phase shift caused by the sample. This value corresponds to the change in the optical thickness of the sample. The phase shift in radians is then , where is the wavelength of the radiation. Whereas the experimental data in the parallel geometry in the panel (a) show only relatively small changes, the data in the panel (c) for the crossed geometry reveal an abrupt jump at zero magnetic field. This is due to the fact that the crossed signal is changing sign when the magnetic field sweeps from positive to negative values, which corresponds to the change in phase of exactly , or the half wavelength as in Fig. 2(c).
The inset (e) in Fig. 2 demonstrates typical spectra in the parallel polarizers geometry in zero magnetic field. The deep oscillations are caused by a Fabry-Pérot-like multiple reflections within the transparent substrate, which in the particular case was 0.387 mm thick undoped GaAs. The values of the maxima in transmission are close to unity demonstrating high transparency of the HgTe film. The decrease of their amplitude towards low frequencies is in accordance with the Drude-like behaviour of the charge carriers, when their relaxation rate is located in the experimental frequency range. In general, the measurements with varying frequency are less accurate. This is caused by numerous uncontrolled standing waves arising in the beam path due to reflections from the surfaces of optical components. Such standing waves give rise to non-reproducible changes in the amplitude of the signal upon the frequency sweep. However this problem is absent when performing magnetic field sweeps at a fixed frequency, which we have utilized in present experiments.
Drude model for magneto-optical transmission
In order to analyze the magneto-optical data, a simple Drude model has been proved to provide an adequate description Tse and MacDonald (2011); Tkachov and Hankiewicz (2011); Shuvaev et al. (2013a). Within this model a sample of mercury telluride is modelled by an infinitely thin film with a two-dimensional conductivity . Here, is three-dimensional conductivity and is the film thickness. In the case of nonzero magnetic field normal to the film (along the -axis) the conductivity is a tensor with all components different from zero:
| (1) | |||
Here, is the angular frequency of the terahertz radiation, is the relaxation time of the charge carriers, is the dc conductivity and is the cyclotron frequency.
A method to obtain the transmission spectra and the polarization state of the radiation in case of a thin conducting film on a substrate has been published previously Shuvaev et al. (2011, 2012). In case of transmission data only approximate final equations have been given and the matrix equations have been inverted numerically. However, for a two dimensional conducting film on an isotropic dielectric substrate the complex transmission can be obtained analytically. For a substrate with permittivity , the final equations for the spectra in parallel () and crossed () polarizers are given by:
| (2) | |||||
where
Here is the conducting film thickness, is the thickness of the substrate, Ohm is the impedance of free space, is the relative impedance of the substrate and is the wavevector of the radiation in the substrate. As can be clearly seen, Eqs. (2) can be inverted analytically to get the solution for the complex conductivity. The final expressiond are a bit lengthy and they will not be presented here.
III Results and Discussion
In the spectra shown in Figs. 1,2 only a single cyclotron resonance is observed. It is therefore reasonable to use only one type of charge carriers in the description. Besides, from the sign of the phase shifts it may be derived directly that the dominating carriers are negatively charged, i.e. they are electrons. The solid lines in Fig. 2 are model calculations according to Eqs. (1,2) superimposed with the data for 45 seconds illumination time. Good quality of these simultaneous fits of four data sets supports the validity of the approximation. However, as will be seen below, in several cases the data suggests the presence of a second type of carriers which in few cases may even dominate the spectra.
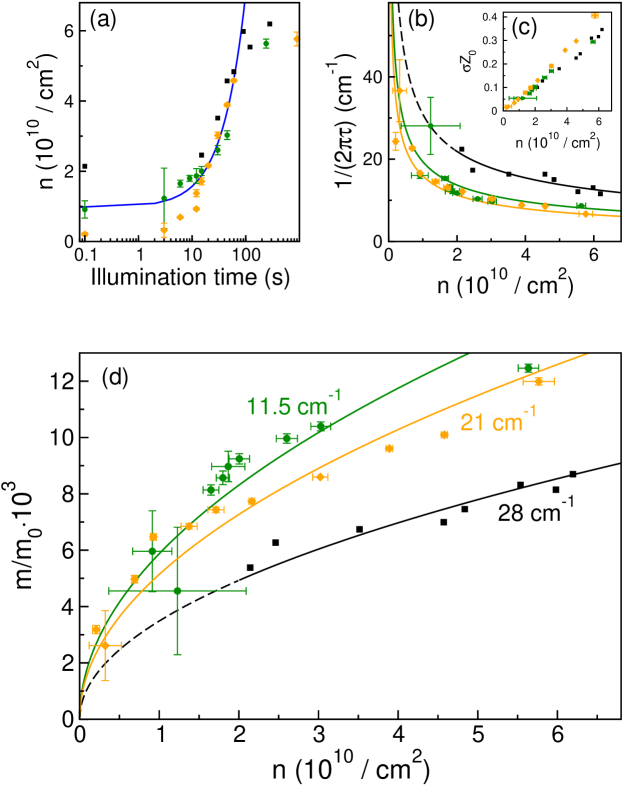
The parameters of the electrons in HgTe as obtained from the fits are shown in Fig. 3. The upper left panel (a) demonstrates the dependence of the charge carriers density against illumination time in the logarithmic scale. In order to accommodate the dark sample with the illumination time 0, it is formally denoted by the time of 0.1 seconds in the figure. The green circles are parameters for the sample #1 at 11.5 cm-1, the orange diamonds - for the same sample at 21 cm-1 and the black squares are parameters of sample #2 at 28 cm-1. The change of the concentration of at least one order of magnitude is clearly achievable in the present experiment. As the illumination time is a parameter which is very specific for the particular setup and generally has limited meaning, in the following the charge carriers density will be used in the plots as a tuning parameter.
The charge carrier relaxation rate is shown in the upper right panel (b) of Fig. 3 as a function of charge carrier density . The fit values for the same sample #1 at two different frequencies of 11.5 cm-1 (green circles) and 21 cm-1 (orange diamonds) coincide rather well within the experimental accuracy (shown by error bars). An increase of the relaxation rate toward low carrier densities is well known in semiconductor physics and is may be explained by the decreasing screening of the random potential by the charge carriers. At low carrier densities the effective cyclotron mass becomes very low and the cyclotron resonances are not resolved anymore. In this case the determination of the parameters of the carriers becomes unstable and results in large error bars. The black squares show the fit results for the sample #2 at 28 cm-1. Here a systematic shift of relaxation rate towards higher values compared to the sample #1 can be attributed to the uncontrolled changes during the sample preparation.
The inset (c) in the upper right panel of Fig. 3 demonstrates almost linear dependence of the static conductivity on charge carriers density . The linear character of the curves and the fact that they closely coincide for both samples indicate that the mobility of the charge carriers is constant across the samples and the density ranges. This is evident from the formula for the conductivity .
The concentration dependence of the effective electron mass in the HgTe films is shown in the panel (d) of Fig. 3. For both samples this dependence follow the square root law . Especially for sample #1 (green circles and orange diamonds) the square root behavior can be observed in extremely broad range of densities. The absolute values of the effective electron mass deviates only slightly for two frequencies, 11.5 cm-1 and 21 cm-1. This may be an indication that that the magnetic field dependence of the cyclotron frequency starts to deviate from the linear low-field regime and an influence of the high-field regime is visible.
The square root behaviour is characteristic for the carriers with the Dirac-like dispersion relations as observed in graphene Novoselov et al. (2005). Here is the Fermi velocity. From the expressions for the two-dimensional density and quantum mechanical and classical definitions of the the cyclotron frequency Ashcroft and Mermin (1976); Hancock et al. (2011); Ariel and Natan (2012) and , respectively, one get . These estimates clearly support the behaviour observed in Fig. 3(d) and they correlate well with the results at higher frequencies Kvon et al. (2008); Ikonnikov et al. (2010, 2011); Olbrich et al. (2013); Zoth et al. (2014).
Hole contribution
The results presented above were clearly dominated by a single electron contribution. Therefore, the description using only one type of carriers has led to reasonable interpretation of the data. As mentioned previously, in case where the electron contribution was small, additional details in the spectra could be detected. This can be interpreted as a contribution of a second type of carriers.
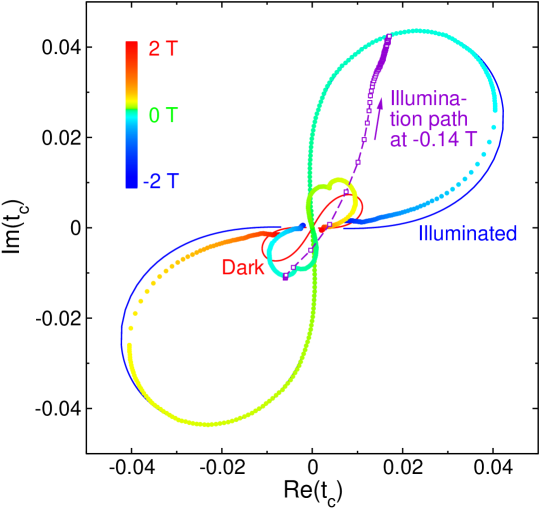
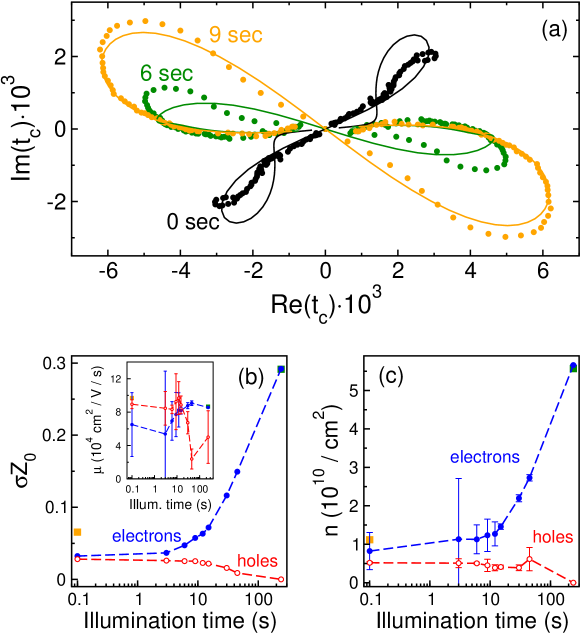
In few experiments with samples in the dark even the dominating character of the hole contribution could be observed. An example of such spectra is presented in Fig. 4. In this figure only the transmission in crossed polarizers is shown as it is mostly sensitive to fine details of the carrier contributions. The data are given in the complex plane plot such as is plotted as a function of including the phase information (which should be compared to conventional presentation in Fig. 2). In such a plot the magneto-optical response of the charge carriers demonstrates a characteristic figure-eight shaped curve. Importantly, the sign of the charge carriers is directly obtained as the orientation of the curve in the complex plane.
As a typical example, purple open circles in Fig. 4 mark the position of on the complex plane at T. It is clear, that the curve of the magneto-optical response in this case is inverted between the dark and the illuminated sample. Open squares in Fig. 4 show the path of , i.e. the point which is close to one maximum of the response curve. In the dark case the sample shows clear orientation of the hole contribution. After switching on the light illumination the shifts to the origin (0,0) and then increases again with the opposite sign. This behaviour demonstrates the inversion from the hole to the electron contribution.
Solid lines in Fig. 4 demonstrate the results of the fitting to the measured data at fixed illumination time. The response on the electron side is well fitted by the simple model. On the hole side, only a qualitative fit may be obtained (red line). In addition, the experimental curve shows some fine structure. This is an indication of the fact that further corrections to the hole response may be needed, e.g. inclusion of further charge carriers. However, possible additional contributions are weak and their parameters cannot be reliably extracted from the fits. Therefore, in the present discussion only two contributions to the magneto-optical response will be considered: electrons giving a main response and holes as a smaller correction.
The HgTe samples investigated in this work showed distinct memory effects. This resulted in the fact that the ”dark” state of the sample could not be exactly reproduced. Possible reason for these observation is the existence of charge traps with hysteresis effects. Normally, in the dark state as obtained after cooling from room temperature and without light illumination, the contributions of holes and electrons were comparable. In this sense, clear visual separation as exemplified in Fig. 4 could be obtained only in the begining of the experimental series. Other example of the spectra in the dark state is shown in Fig. 5(a) by black symbols. Here more complicates picture compared to Fig. 4 is seen. Fortunately, the overall behaviour of the experimental data could be reasonably described taking only two sorts of the charge carriers into account. The results of such fits are shown in Fig. 5(a) as solid lines demonstrating that even a complicated behaviour may be qualitatively understood as a mixture of hole and electron contributions. The attempts to include more charge carriers into consideration did not led to stable fits. As the response of the holes is weak, only few parameters like conductivity, density, and mobility could be determined unambiguously. The effective mass and the scattering rate of holes contribute to the mobility simultaneously as and they could not be separated by the fitting procedure.
The static conductivity and the density of electrons and holes in HgTe in the approximation of two types of charge carriers are shown in Fig. 5(b,c). As expected, the parameters of the electrons in the two-carriers fits remain basically the same as in Fig. 3 (electrons only). Within the experimental accuracy the density of the holes remains independent of illumination indicating that mobile hole states are not affected by light.
The Dirac cone is symmetrical with respect to positive and negative directions in energy. If the Fermi-level is above the Dirac point, the charge carriers are electron-like. If the Fermi-level in below the Dirac point, the charge carriers will have the holes-like character. Fermi level for the samples in the dark state is most probably determined by the preparation conditions and partly by the temperature/doping history of the sample. Electron and hole contributions in the present study are observed from the same cyclotron resonance mode. Therefore, we conclude that both types of carriers correspond to Dirac dispersion.
IV Conclusion
Terahertz properties of the mercury telluride thin films with critical thickness are investigated. Using optical doping by visible light illumination, the charge carrier concentration could be modified by more than one order of magnitude. In some cases, using light as a parameter may switch the qualitative electrodynamic response from hole-like to the electron-like. Especially towards low electron density the cyclotron mass shows a square root dependence upon the charge concentration. This can be interpreted as a clear proof of a linear dispersion relations, i.e. Dirac type carriers.
Acknowledgements
We acknowledge valuable discussion with G. Tkachov, E. Hankiewicz, and Z. D. Kvon. This work was supported by Austrian Science Funds (I815-N16, W-1243, P27098-N27).
References
- Hasan and Kane (2010) M. Z. Hasan and C. L. Kane, Rev. Mod. Phys. 82, 3045 (2010), URL http://link.aps.org/doi/10.1103/RevModPhys.82.3045.
- Qi et al. (2008) X.-L. Qi, T. L. Hughes, and S.-C. Zhang, Phys. Rev. B 78, 195424 (2008), URL http://link.aps.org/doi/10.1103/PhysRevB.78.195424.
- Tse and MacDonald (2010) W.-K. Tse and A. H. MacDonald, Phys. Rev. Lett. 105, 057401 (2010), URL http://link.aps.org/doi/10.1103/PhysRevLett.105.057401.
- Tse and MacDonald (2011) W.-K. Tse and A. H. MacDonald, Phys. Rev. B 84, 205327 (2011), URL http://link.aps.org/doi/10.1103/PhysRevB.84.205327.
- Maciejko et al. (2010) J. Maciejko, X.-L. Qi, H. D. Drew, and S.-C. Zhang, Phys. Rev. Lett. 105, 166803 (2010), URL http://link.aps.org/doi/10.1103/PhysRevLett.105.166803.
- Tkachov and Hankiewicz (2011) G. Tkachov and E. M. Hankiewicz, Phys. Rev. B 84, 035405 (2011), URL http://link.aps.org/doi/10.1103/PhysRevB.84.035405.
- Brüne et al. (2011) C. Brüne, C. X. Liu, E. G. Novik, E. M. Hankiewicz, H. Buhmann, Y. L. Chen, X. L. Qi, Z. X. Shen, S. C. Zhang, and L. W. Molenkamp, Phys. Rev. Lett. 106, 126803 (2011), URL http://link.aps.org/doi/10.1103/PhysRevLett.106.126803.
- Büttner et al. (2011) B. Büttner, C. X. Liu, G. Tkachov, E. G. Novik, C. Brüne, H. Buhmann, E. M. Hankiewicz, P. Recher, B. Trauzettel, S. C. Zhang, et al., Nat. Phys. 7, 418 (2011).
- Palik and Furdyna (1970) E. D. Palik and J. K. Furdyna, Rep. Prog. Phys. 33, 1193 (1970), URL http://stacks.iop.org/0034-4885/33/i=3/a=307.
- Shuvaev et al. (2011) A. M. Shuvaev, G. V. Astakhov, A. Pimenov, C. Brüne, H. Buhmann, and L. W. Molenkamp, Phys. Rev. Lett. 106, 107404 (2011), URL http://link.aps.org/doi/10.1103/PhysRevLett.106.107404.
- Hancock et al. (2011) J. N. Hancock, J. L. M. van Mechelen, A. B. Kuzmenko, D. van der Marel, C. Brüne, E. G. Novik, G. V. Astakhov, H. Buhmann, and L. W. Molenkamp, Phys. Rev. Lett. 107, 136803 (2011), URL http://link.aps.org/doi/10.1103/PhysRevLett.107.136803.
- Shuvaev et al. (2013a) A. M. Shuvaev, G. V. Astakhov, G. Tkachov, C. Brüne, H. Buhmann, L. W. Molenkamp, and A. Pimenov, Phys. Rev. B 87, 121104 (2013a), URL http://link.aps.org/doi/10.1103/PhysRevB.87.121104.
- Shuvaev et al. (2013b) A. Shuvaev, A. Pimenov, G. V. Astakhov, M. Muhlbauer, C. Brune, H. Buhmann, and L. W. Molenkamp, Appl. Phys. Lett. 102, 241902 (2013b), URL http://link.aip.org/link/?APL/102/241902/1.
- Kvon et al. (2012) Z. D. Kvon, S. N. Danilov, D. A. Kozlov, C. Zoth, N. N. Mikhailov, S. A. Dvoretskii, and S. D. Ganichev, JETP Lett. 94, 816 (2012), ISSN 0021-3640, URL http://dx.doi.org/10.1134/S002136401123007X.
- Ikonnikov et al. (2011) A. V. Ikonnikov, M. S. Zholudev, K. E. Spirin, A. A. Lastovkin, K. V. Maremyanin, V. Y. Aleshkin, V. I. Gavrilenko, O. Drachenko, M. Helm, J. Wosnitza, et al., Semicond. Sci. Technol. 26, 125011 (2011), URL http://stacks.iop.org/0268-1242/26/i=12/a=125011.
- Olbrich et al. (2013) P. Olbrich, C. Zoth, P. Vierling, K.-M. Dantscher, G. V. Budkin, S. A. Tarasenko, V. V. Bel’kov, D. A. Kozlov, Z. D. Kvon, N. N. Mikhailov, et al., Phys. Rev. B 87, 235439 (2013), URL http://link.aps.org/doi/10.1103/PhysRevB.87.235439.
- Zoth et al. (2014) C. Zoth, P. Olbrich, P. Vierling, K.-M. Dantscher, V. V. Bel’kov, M. A. Semina, M. M. Glazov, L. E. Golub, D. A. Kozlov, Z. D. Kvon, et al., Phys. Rev. B 90, 205415 (2014), URL http://link.aps.org/doi/10.1103/PhysRevB.90.205415.
- Bernevig et al. (2006) B. A. Bernevig, T. L. Hughes, and S.-C. Zhang, Science 314, 1757 (2006), eprint http://www.sciencemag.org/content/314/5806/1757.full.pdf, URL http://www.sciencemag.org/content/314/5806/1757.abstract.
- König et al. (2007) M. König, S. Wiedmann, C. Brüne, A. Roth, H. Buhmann, L. W. Molenkamp, X.-L. Qi, and S.-C. Zhang, Science 318, 766 (2007), eprint http://www.sciencemag.org/content/318/5851/766.full.pdf, URL http://www.sciencemag.org/content/318/5851/766.abstract.
- Volkov et al. (1985) A. A. Volkov, Y. G. Goncharov, G. V. Kozlov, S. P. Lebedev, and A. M. Prokhorov, Infrared Phys. 25, 369 (1985), URL http://www.sciencedirect.com/science/article/B6X3W-46K4CH2-29/2/43ef2c1b497859011f2f67a144d4bb72.
- Shuvaev et al. (2012) A. M. Shuvaev, G. V. Astakhov, C. Brüne, H. Buhmann, L. W. Molenkamp, and A. Pimenov, Semicond. Sci. Technol. 27, 124004 (2012), URL http://stacks.iop.org/0268-1242/27/i=12/a=124004.
- Berreman (1972) D. W. Berreman, J. Opt. Soc. Am. 62, 502 (1972).
- Novoselov et al. (2005) K. S. Novoselov, A. K. Geim, S. V. Morozov, D. Jiang, M. I. Katsnelson, I. V. Grigorieva, S. V. Dubonos, and A. A. Firsov, Nature (London) 438, 197 (2005).
- Ashcroft and Mermin (1976) N. Ashcroft and N. Mermin, Solid State Physics, HRW international editions (Holt, Rinehart and Winston, 1976).
- Ariel and Natan (2012) V. Ariel and A. Natan, ArXiv 1206.6100 (2012), URL http://arxiv.org/abs/1206.6100.
- Kvon et al. (2008) Z.-D. Kvon, S. N. Danilov, N. N. Mikhailov, S. A. Dvoretsky, W. Prettl, and S. D. Ganichev, Physica E 40, 1885 (2008), URL http://www.sciencedirect.com/science/article/pii/S1386947707003645.
- Ikonnikov et al. (2010) A. Ikonnikov, A. Lastovkin, K. Spirin, M. Zholudev, V. Rumyantsev, K. Maremyanin, A. Antonov, V. Aleshkin, V. Gavrilenko, S. Dvoretskii, et al., JETP Lett. 92, 756 (2010), ISSN 0021-3640, URL http://dx.doi.org/10.1134/S0021364010230086.