Contact statistics highlight distinct organizing principles of proteins and RNA
Abstract
Although both RNA and proteins have densely packed native structures, chain organizations of these two biopolymers are fundamentally different. Motivated by the recent discoveries in chromatin folding that interphase chromosomes have territorial organization with signatures pointing to metastability, we analyzed the biomolecular structures deposited in the Protein Data Bank and found that the intrachain contact probabilities, as a function of the arc length , decay in power-law over the intermediate range of , . We found that the contact probability scaling exponent is for large RNA (), for small sized RNA (), and for proteins. Given that Gaussian statistics is expected for a fully equilibrated chain in polymer melts, the deviation of value from for the subchains of large RNA in the native state suggests that the chain configuration of RNA is not fully equilibrated. It is visually clear that folded structures of large sized RNA () adopt crumpled structures, partitioned into modular multi-domains assembled by proximal sequences along the chain, whereas the polypeptide chain of folded proteins looks better mixed with the rest of the structure. Our finding of for large RNA might be an ineluctable consequence of the hierarchical ordering of the secondary to tertiary elements in the folding process.
RNA and proteins, under an appropriate environmental conditions, adopt three-dimensionally compact native folds that are essential for a variety of biological functions. Despite general similarities of the folding principles that both biopolymers are made of sequences foldable to a functionally competent structure as an outcome of evolutionary selection Schuster et al. (1994); Tinoco Jr. and Bustamante (1999); Thirumalai and Hyeon (2005); Chen and Dill (2000); Morcos et al. (2014), the overall shape of the native RNA differs from that of proteins in several aspects. Proteins are in general more compact, globular, and flexible than RNA Hyeon et al. (2006). Such differences may be originated from distinct nature of building block. The energy scale of binary interaction that pairs nucleotides is typically greater than that of amino acids. Furthermore, the requirement of charge neutralization (or screening) along the backbone differentiates the foci of RNA dynamics, especially at the early stage of folding Thirumalai et al. (2001), from those of proteins.
Spotlighted in the recent studies of chromatin folding exploiting fluorescence in-situ hybridization (FISH) Langer-Safer et al. (1982); Cremer and Cremer (2001) and chromosome conformation capture techniques Dekker et al. (2002); Lieberman-Aiden et al. (2009); Dekker et al. (2013), human chromosomes in the interphase have a territorial organization Cremer and Cremer (2001) and the individual chromosome is also partitioned into a number of topologically associated domains (TADs), possibly mediated by proteins such as CTCF and cohesin Zuin et al. (2014). The contact probability of two loci separated by the genomic distance can provide glimpses into the arrangement of chromatin chain. From the polymer perspective, a test chain in a “fully” equilibrated homogeneous polymer melt is expected to obey the Gaussian statistics because of the screening of excluded volume interaction Grosberg and Khokhlov (1994), thus satisfying . It was, however, shown that of human chromatin in cell nucleus displays at the genomic scales of Mb Lieberman-Aiden et al. (2009). To account for the origins of the human genome organization and its characteristic scaling exponent and patterns of contact map demonstrating TADs, several different models have been put forward, which include the crumpled (fractal) globule Lieberman-Aiden et al. (2009); Grosberg et al. (1988); Mirny (2011), random loop Bohn et al. (2007), strings and binders switch model Barbieri et al. (2012), and confinement-induced glassy dynamics Kang et al. (2015).
Besides the overall shape, chain organizations of the native folds of RNA and proteins are in general visually different from each other.
Compared with proteins in which -helices, -strands, and loops thread through one another to form a native structure, a folded RNA with large looks more crumpled; a number of secondary structure elements (helices, bulges, loops) forming independently stable modular contact domains are further assembled into a compact three dimensional structure.
Here, borrowing the several statistical measures that have been used to study the genome/chromosome organization inside cell nucleus, we substantiate the fundamental differences between the chain organizations of RNA and proteins in native states and discuss its significance in connection to their folding mechanisms.
METHODS
Calculation of contact probability and extraction of scaling exponent. Using atomic coordinates of RNA and protein from Protein Data Bank (PDB), we consider that two residues and are in contact if the minimum distance between any two heavy atoms of these residues, located at and , is smaller than a cut-off distance (= 4 Å). The contact probability for a biomolecule with chain length (the number of residues) is thus determined by calculating
| (1) |
where for ; otherwise .
Two examples of are given in Figs.1B and 1C.
The power law relation of is observed over the intermediate scale.
We determined the value of by fitting over the range of .
The details of fitting procedure are discussed in the Supporting Material.
Mean contact probability. Each structure in the PDB has different chain size (). Thus, to consider the non-uniform distribution of chain size in computing the mean contact probability, we calculated the following -dependent probability averaged over the total number of distinct chain sizes:
| (2) |
where is the mean contact probability for the structures with chain size , and we used the value of only for the range of . for RNA and proteins are shown in Fig. 1D. , , , , and were calculated using similar definitions as Eq. 2. A cautionary note is in place. Unlike the contact probability exponent calculated for each macromolecular structure, these mean properties obtained by averaging over each ensemble of proteins and RNA are meant for understanding the general difference between RNA and proteins as two distinct classes of macromolecules.
RESULTS
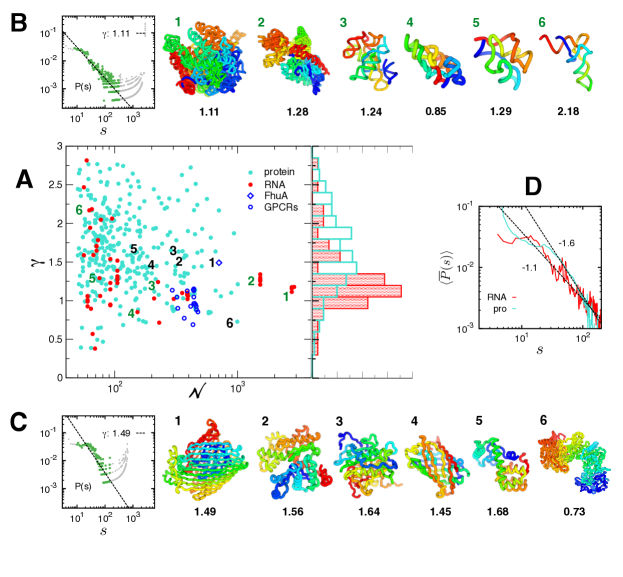
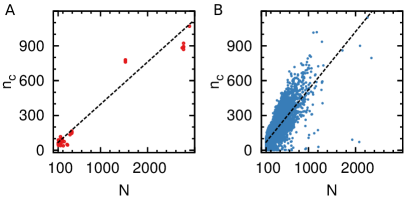
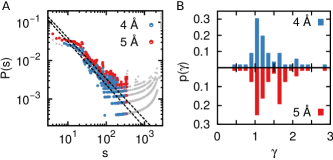
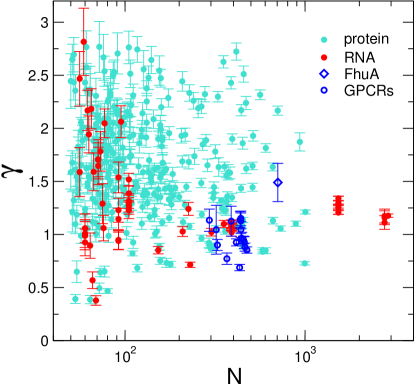
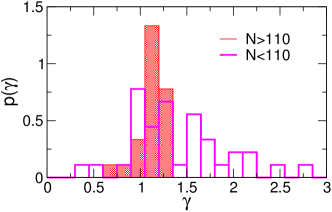
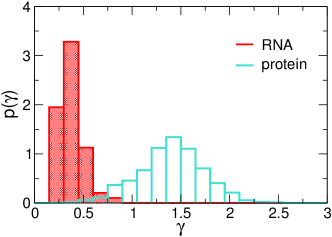
Power-law exponent of contact probability. The contact probability calculated for individual biopolymers (Eq.1) exhibit power-law decay over the intermediate range of , (the left panel of Figs.1B and 1C). The scaling exponent from the fit using was obtained for each biopolymer (see text and Figs. S1–S4 in the Supporting Material for details, where we discussed the accuracy of obtaining and showed the error bar of for each macromolecule), and its distributions, s, for RNA and proteins are contrasted in Fig. 1A. Proteins have broadly distributed from 0.5 to 2.5 centered around , whereas for RNA is sharply peaked at . No clear correlation is found between and the chain length () in proteins; however, in RNA while values are broadly distributed at small , they are sharply centered around when (see also Fig. S6).
The distinct scaling exponents, for the of 23S rRNA ( at the left corner of Fig. 1B) and for FhuA ( at the left corner of Fig. 1C), elicit special attention. The value of , especially for large sized RNA arises from their characteristic chain organization: Similar to TADs in chromosomes, proximal sequences along the chain are stabilized by base pairing to form independently stable modular “contact domains”, consisting of hairpin, bulges, and loops. Further assemblies among these contact domains are achieved by a number of tertiary interactions (base triples, kissing loops, coaxial stackings through ribose zipper, A-minor motif, and metal-ion interactions) Batey et al. (1999); Nissen et al. (2001). The abundance of distal contacts resulting from the hierarchical chain assembly likely contributes to the greater frequency of the long-range contacts, giving rise to for 23S rRNA on the scale of (see the next section). The distinct chain organizations of RNA and proteins become more evident when molecules are visualized using rainbow coloring scheme spanning the chain (Figs.1B and 1C). The overall chain topology of 23S rRNA resembles a crumpled globule Lua and Grosberg (2006); Halverson et al. (2014) that retains clearly demarcated contact domains held by distal inter-domain contacts. The territorial organization of contact domains made of proximal sequences is highlighted in large sized RNA structures (see the large and small subunit of rRNA in Fig. 1B).
In stark contrast to rRNA, typical proteins with (indexed with black labels from 1 to 5 in Figs.1A and 1C) retain chain conformations whose subchains look topologically more intermingled with the rest of the structure, lacking visually distinct domains of a similar color. The intermingled chain configurations of native proteins as well as the contact probability scaling exponent points to a configuration of equilibrium globule, which is also supported by the same conclusion reached by investigating the loop size distribution of native protein structures Berezovsky et al. (2000). Of particular note are the proteins with , which are found at the outliers of . For example, is for chrondroitin sulfate ABC lyase I (the protein indexed with 6) Huang et al. (2003), the chain configuration of which has clearly demarcated contact domains.
Instead of calculating the -dependent contact probability for individual molecules (, ), one can also consider ensemble averaged characteristics of native RNA and protein organizations, (Eq.2, Fig.1 D). The mean contact probability calculated for each ensemble of RNA and proteins exhibits power-law decay with for RNA and for proteins on the scale of , which helps us understanding the general difference of structural ensemble between RNA and proteins as two distinct classes of macromolecules.
Cautionary remarks are in place in regard to the power-law scaling of .
The characteristic power-law decay behavior of 23S rRNA with is only valid for intermediate range of .
For small , decays with a different power-law exponent (see the two panels of in Figs. 1B and 1C).
As reported by Lua and Grosberg Lua and Grosberg (2006), on local scales both RNA and proteins have a chain organization different from the one on larger scale, which is also confirmed in our study by the distinct scaling exponent for RNA and for proteins with (Fig. S7).
Hence, in the strict sense the chain organizations of both RNA and proteins are not scale-invariant, which is not the case for any real polymer, either.
Depending on the length scale of interest, different picture is revealed from real polymer chains.
Of note, the new scaling exponent recently discovered for chromatin organization at resolution ( Mb) Sanborn et al. (2015) higher than the previous study ( kb) Lieberman-Aiden
et al. (2009) implies that the self-similarity found at the intermediate resolution () cannot be extended to the internal structure of contact domain with .
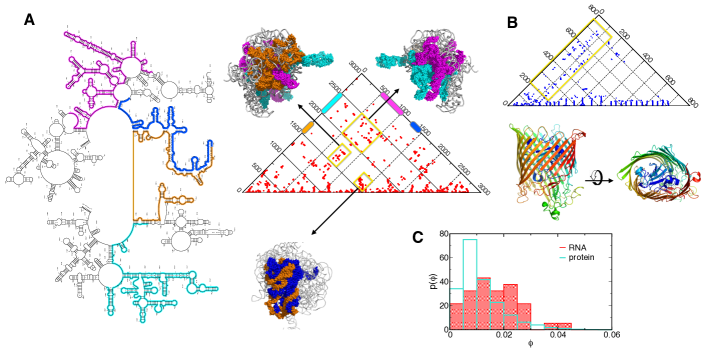
Long range contacts from contact map. Contact maps along with the three dimensional structure offer a more concrete insight into the distinct chain organization of biopolymers with different . For instance, the contact maps of 23S-rRNA () (Fig. 2A) and FhuA () (Fig. 2B) reveal that 23S rRNA has a greater density of long-range contacts than FhuA. Interestingly, in 23S rRNA the modular contact domains made of sequences, spanning (magenta) and (orange) or between (magenta) and (cyan), form extensive interfaces (Fig. 2A). In comparison, FhuA has -barrel structure with the long-range tertiary contacts formed between the subdomain (blue) made of N-terminal sequences () and -strands () surrounding it (Fig. 2B).
To generalize this finding for RNA and proteins,
for each structure we calculated the proportion of long-range contacts (), between any sites and , satisfying , as the ratio between the observed number of long-range contacts and the maximum possible number of long-range contacts, i.e., , where is the Heaviside step function and the normalization constant .
The corresponding histograms for RNA and proteins are shown in Fig. 2C with .
The finding that RNA has distributed to larger values than proteins indicates that a significant number of tertiary contacts are used for assembling the secondary structure elements abundant in RNA.
This result is robust to the variation of value.
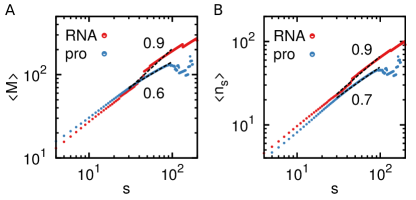
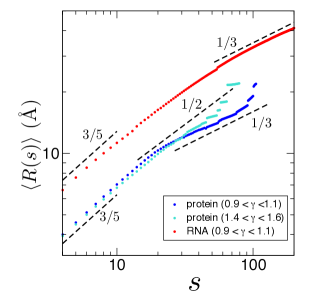
Inter-subchain interactions and surface roughness. In order to quantify further the distinct chain organization of RNA and proteins, we borrow analytic tools developed in the studies of chromosome organization Lua and Grosberg (2006); Halverson et al. (2014). The number of contacts, , that a subchain has with the rest of the structure (see Fig. 3A) Mirny (2011), scales as for both RNA and proteins, where denotes an average over the chain size frequency (see Materials and Methods). The exponent is different for RNA () and protein (), and is greater for RNA when , indicating that RNA has more number of inter-subchain contacts for . The same conclusion was drawn by computing the “roughness” of the subchain surface Halverson et al. (2014), which is quantified using , the number of monomers in a subchain that are in contact with at least one monomer belonging to other subchains (see Fig. 3B). with , suggesting that RNA have rougher subchain surfaces. The scaling relationships of the inter-subchain interactions () and the surface monomers () for RNA compare well with those of crumpled globules (, ) Mirny (2011); Halverson et al. (2014).
and are related to each other with where is the proportionality constant, the total number of possible monomers () that can fill the volume defined by a blob consisting of monomers, thus giving a scaling relation
Halverson et al. (2014).
From this relation and , we obtain the Flory exponent for native RNA and
for proteins, which is in perfect agreement with the values of obtained from an independent analysis of macromolecular structures in the PDB, for RNA and for proteins in Hyeon et al. (2006).
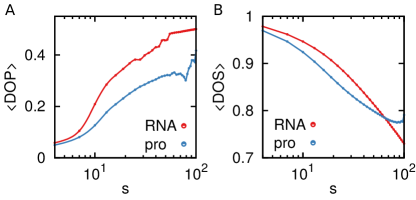
Degree of interpenetration and segregation.
Next, we calculate the fraction of residues from other subchains found in the ellipsoidal volume enclosing a subchain averaged over all subchains of length , which corresponds to the degree of interpenetration (DOP) Lua and Grosberg (2006).
The degree of segregation (DOS), is defined by the ratio between and ,
where is the distance between the center positions of two non-overlapping subchains and ,
and is the gyration radius of the union of these two subchains.
DOS is defined by the ratio of these two values ( and ) averaged over all the pairs of subchains and with the same length .
DOP and DOS as a function of for both RNA and proteins (Fig. 4) indicate that while subchains separated by a large arc length are well separated from each other in RNA
the subchains in RNA penetrate into other subchain’s volume deeper than in proteins.
This explains why the decline of for RNA is slower than for proteins (Fig. 2), which leads to a smaller exponent, .
The number of long-range contacts. The total number of contacts over a given range of , is considered with : , and hence
| (3) |
Notably, (i) scales linearly with for both RNA and proteins, regardless of value. (ii) The prefactor of depends only on . For and , Eq.3 leads to , and .
Meanwhile, from the plots of using structures in PDB (see Fig. 5), we obtain
| (4) |
where the prefactors and from the fits to in Fig. 1 are used. Note that for a given , and . Together with other quantities, , , and , the number of contacts, , calculated here persistently assert that RNA have greater number of long-range contacts than proteins of the same size.
It is of note that the analyses presented in Figs. 3, 4, 5 are different from investigating each macromolecule one by one (Fig. 1) and finding the structure-function relationship. Given that the ensemble in question is the product of evolution, clarifying the difference between two classes of macromolecules (RNA and proteins) is promising as soon as the evolutionary questions are concerned.
DISCUSSION
Due to intramolecular forces stabilizing chain molecule, both native RNA and protein molecules retain compact and space-filling structures, satisfying Flory (1969); Hyeon et al. (2006), which from the polymer physics perspective is regarded as the property of polymers in poor solvent conditions. It is, however, critical to note that the size of a subchain surrounded by other subchains should scale as , which is indeed confirmed for the proteins with (Fig.S5). According to the “Flory theorem” Flory (1949); Grosberg and Khokhlov (1994), a test chain in a fully equilibrated homogeneous semi-dilute or concentrated polymer melt de Gennes (1979), in spherical confinement Cacciuto and Luijten (2006), or even in globule is expected to obey the Gaussian statistics because of the screening of excluded volume interaction or counterbalance between attraction and repulsion Grosberg and Khokhlov (1994), thus satisfying or (see Supporting Material). The distinct contact probability exponent is highlighted by our analysis that for large RNA and for small RNA or globular proteins over the intermediate range of . Evident from rRNA structure (Fig. 1), subchains of RNA at scales are assembled into modular contact domains, which are better demarcated in the form of stem-loop helices than proteins, and stitched together through long-range tertiary contacts (Fig. 2A). The evidence of this characteristic architecture of RNA with multi-modular domains is visualized vividly in the form of multiple rupture events in single molecule pulling experiments of T. ribozymes Onoa et al. (2003), while many proteins display a cooperative and effectively all-or-none unfolding under force Shank et al. (2010); Mickler et al. (2007).
What causes the crumpled structures of large RNA at the scale of ? Here, the statistical rarity of knots in native RNA Micheletti et al. (2015); Burton et al. (2015), which is unparalleled by proteins or DNA Lua and Grosberg (2006); Noel et al. (2010), is worth noting. In general, knots are unavoidable when a long polymer chain ( where is the entanglement length de Gennes (1979)) is folded to an equilibrium globule Grosberg (2000); Mirny (2011). Topological knot-free constraints inherent to the ring polymers, however, have been shown to organize melts of unconcatenated polymer rings or a single long polymer ring into crumpled globules, preventing entanglements Imakaev et al. (2015); Halverson et al. (2014). Since large RNA molecules, assembled by a number of secondary structural elements (hairpin loops, stems), resemble a collection of small and large rings, it can be surmised during the folding process, the knot-free constraints are effectively imposed. The knot-free constraints are more likely applied for RNA because the energy scale associated with secondary structure elements (), is in general well separated from that of tertiary interactions (), such that Thirumalai and Hyeon (2008), which makes secondary structure elements independently stable. By contrast, in order to fold, proteins undergo reptation-like process, after the initial collapse Thirumalai (1995), which may take place with ease because secondary structure elements of proteins (-helix, -sheet) are only marginally stable relative to the thermal energy. If necessary, these motifs can be reassembled into thermodynamically more stable structures.
While local and remote contacts are mixed in the folding nuclei of proteins, the formation of secondary structures in RNA folding usually precedes the formation of tertiary contacts, so that the folding of RNA is hierarchical Tinoco Jr. and Bustamante (1999); Greenleaf et al. (2008). Folding under kinetic control produces thermodynamically metastable and kinetically trapped intermediates, which occurs ubiquitously in RNA folding Treiber and Williamson (2001), especially in cotranscriptional folding of RNA Repsilber et al. (1999); Lutz et al. (2013). A decision, made at an early stage of folding, involved with the formation of independently stable secondary structure elements is difficult to revert although in a worst case scenario, cofactors such as metal-ions Wu and Tinoco, Jr (1998); Koculi et al. (2012), metabolites Montange and Batey (2008), and RNA chaperones Russell et al. (2013) still can induce a secondary structure rearrangement. Hence, a more proper way to understand conformational dynamics of a large RNA molecule with is to consider an ensemble of multiple functional states Al-Hashimi and Walter (2008); Solomatin et al. (2010); Hyeon et al. (2012, 2014) instead of a thermodynamically driven, unique native state. It is noteworthy that RNA secondary structure prediction algorithms which use the strategy of searching the minimum free energy structure Rivas and Eddy (1999); Hofacker (2003); Zuker (2003) fail to predict the correct secondary structure when , and require the comparative sequence analysis or experimental constraints Gutell et al. (2002); Mathews et al. (1999). This could be ascribed to the consequence of error accumulated in predicting RNA structures with large , but it is also suspected that the (free) energy minimization principle cannot be extended to account for the folding process of large RNA. The contact statistics of large RNA, , can be used as an additional constraint or guideline for structure prediction.
A situation analogous to the hierarchical folding of large RNA is prevalent in the two-stage membrane protein folding where the insertion of transmembrane (TM) -helices, guided by translocons, is followed by the post-insertion folding Popot et al. (1987); Bowie (2005). We indeed find that the contact probabilities of class A G-protein coupled receptors (GPCRs) give (blue circles in the middle panel of Fig. 1). Since means the chain organization of native GPCRs is not in entropy-maximum state, a thermodynamically guided, spontaneous in vitro refolding of GPCRs into the native form is expected to be non-permissible. An AFM experiment on an -helical membrane protein, antiporter (), whose value we find is , could not be refolded to the original form after mechanically unfolded Kedrov et al. (2004). However, a recent remarkable single molecule force experiment Min et al. (2015) has shown that GlpG, an -membrane proteins with , can reversibly fold in bicelles even after the entire structure including TM helices is disrupted by mechanical forces. Remarkably, we find for GlpG. For membrane proteins of known native structures, their values can be used to judge whether or not spontaneous in vitro refolding is possible.
Since the time required for equilibrium sampling of conformations () increases exponentially with the system size () as Palmer (1982), signatures of metastability or non-equilibration in chain conformation could be ubiquitous in a macromolecular structure with large . Through the statistical analysis of structures in PDB, our study puts forward that the present forms of crumpled chain organization with of large native RNA and some classes of proteins are an ineluctable outcome of the folding mechanism under kinetic control.
Our results, based on the structures available in PDB, might be fraught with a possible sample bias since the current structural information available in PDB is limited underrepresenting intrinsically disordered proteins or membrane proteins for proteins, and long non-coding intron RNA (lncRNA) abundant in the cell for RNA Rinn and Chang (2012); Carninci et al. (2005). Nevertheless, our general conclusions on the difference in the organization principle between proteins and RNA will still hold even when the database of PDB is further expanded.
Especially, we expect that an inclusion of long non-coding RNA structures (), which should be possible in the near future, will make our conclusions more robust since the hierarchical nature of RNA folding process would become more evident for RNA with larger and reinforce the territorial (crumpled-like) organization in RNA.
ACKNOWLEDGMENTS
We thank the Korea Institute for Advanced Study for providing computing resources (KIAS Center for Advanced Computation, Linux Cluster System) for this work.
References
- Schuster et al. (1994) P. Schuster, W. Fontana, P. F. Stadler, and I. L. Hofacker, Proc.R. Soc. London B: Biological Sci. 255, 279 (1994).
- Tinoco Jr. and Bustamante (1999) I. Tinoco Jr. and C. Bustamante, J. Mol. Biol. 293, 271 (1999).
- Thirumalai and Hyeon (2005) D. Thirumalai and C. Hyeon, Biochemistry 44, 4957 (2005).
- Chen and Dill (2000) S. J. Chen and K. A. Dill, Proc. Natl. Acad. Sci. U. S. A. 97, 646 (2000).
- Morcos et al. (2014) F. Morcos, N. P. Schafer, R. R. Cheng, J. N. Onuchic, and P. G. Wolynes, Proc. Natl. Acad. Sci. U. S. A. 111, 12408 (2014).
- Hyeon et al. (2006) C. Hyeon, R. I. Dima, and D. Thirumalai, J. Chem. Phys. 125, 194905 (2006).
- Thirumalai et al. (2001) D. Thirumalai, N. Lee, S. A. Woodson, and D. K. Klimov, Annu. Rev. Phys. Chem. 52, 751 (2001).
- Langer-Safer et al. (1982) P. R. Langer-Safer, M. Levine, and D. C. Ward, Proc. Natl. Acad. Sci. U. S. A. 79, 4381 (1982).
- Cremer and Cremer (2001) T. Cremer and C. Cremer, Nature Rev. Genet. 2, 292 (2001).
- Dekker et al. (2002) J. Dekker, K. Rippe, M. Dekker, and N. Kleckner, Science 295, 1306 (2002).
- Lieberman-Aiden et al. (2009) E. Lieberman-Aiden, N. van Berkum, L. Williams, M. Imakaev, T. Ragoczy, A. Telling, I. Amit, B. Lajoie, P. Sabo, M. Dorschner, et al., Science 326, 289 (2009).
- Dekker et al. (2013) J. Dekker, M. A. Marti-Renom, and L. A. Mirny, Nat. Rev. Genetics 14, 390 (2013).
- Zuin et al. (2014) J. Zuin, J. R. Dixon, M. I. van der Reijden, Z. Ye, P. Kolovos, R. W. Brouwer, M. P. van de Corput, H. J. van de Werken, T. A. Knoch, W. F. van IJcken, et al., Proc. Natl. Acad. Sci. U. S. A. 111, 996 (2014).
- Grosberg and Khokhlov (1994) A. Y. Grosberg and A. R. Khokhlov, Statistical Physics of Macromolecules (AIP Press, New York, 1994).
- Grosberg et al. (1988) A. Grosberg, S. Nechaev, and E. Shakhnovich, J. Phys. 49, 2095 (1988).
- Mirny (2011) L. A. Mirny, Chromosome Res. 19, 37 (2011).
- Bohn et al. (2007) M. Bohn, D. W. Heermann, and R. van Driel, Phys. Rev. E 76, 051805 (2007).
- Barbieri et al. (2012) M. Barbieri, M. Chotalia, J. Fraser, L.-M. Lavitas, J. Dostie, A. Pombo, and M. Nicodemi, Proc. Natl. Acad. Sci. U. S. A. 109, 16173 (2012).
- Kang et al. (2015) H. Kang, Y.-G. Yoon, D. Thirumalai, and C. Hyeon, Phys. Rev. Lett. 115, 198102 (2015).
- Pyetan et al. (2007) E. Pyetan, D. Baram, T. Auerbach-Nevo, and A. Yonath, Pure Appl. Chem. 79, 955 (2007).
- Guo et al. (2011) Q. Guo, Y. Yuan, Y. Xu, B. Feng, L. Liu, K. Chen, M. Sun, Z. Yang, J. Lei, and N. Gao, Proc. Natl. Acad. Sci. U. S. A. 108, 13100 (2011).
- Golden et al. (2005) B. L. Golden, H. Kim, and E. Chase, Nature. Struct. Mol. Biol. 12, 82 (2005).
- Krasilnikov et al. (2004) A. S. Krasilnikov, Y. Xiao, T. Pan, and A. Mondragón, Science 306, 104 (2004).
- Thore et al. (2008) S. Thore, C. Frick, and N. Ban, J. Am. Chem. Soc. 130, 8116 (2008).
- Ferguson et al. (2000) A. D. Ferguson, V. Braun, H.-P. Fiedler, J. W. Coulton, K. Diederichs, and W. Welte, Protein Science 9, 956 (2000).
- Otterbein et al. (2001) L. R. Otterbein, P. Graceffa, and R. Dominguez, Science 293, 708 (2001).
- McLuskey et al. (2012) K. McLuskey, J. Rudolf, W. R. Proto, N. W. Isaacs, G. H. Coombs, C. X. Moss, and J. C. Mottram, Proc. Natl. Acad. Sci. U. S. A. 109, 7469 (2012).
- Ormö et al. (1996) M. Ormö, A. B. Cubitt, K. Kallio, L. A. Gross, R. Y. Tsien, and S. J. Remington, Science 273, 1392 (1996).
- Weaver and Matthews (1987) L. Weaver and B. Matthews, J. Mol. Biol. 193, 189 (1987).
- Shank et al. (2010) E. A. Shank, C. Cecconi, J. W. Dill, S. Marqusee, and C. Bustamante, Nature 465, 637 (2010).
- Huang et al. (2003) W. Huang, V. Lunin, Y. Li, S. Suzuki, N. Sugiura, H. Miyazono, and M. Cygler, J. Mol. Biol. 328, 623 (2003).
- Batey et al. (1999) R. T. Batey, R. P. Rambo, J. A. Doudna, et al., Angew. Chem. Int. Ed. 38, 2326 (1999).
- Nissen et al. (2001) P. Nissen, J. A. Ippolito, N. Ban, P. B. Moore, and T. A. Steitz, Proc. Natl. Acad. Sci. U. S. A. 98, 4899 (2001).
- Lua and Grosberg (2006) R. C. Lua and A. Y. Grosberg, PLoS Comput Biol 2, e45 (2006).
- Halverson et al. (2014) J. D. Halverson, J. Smrek, K. Kremer, and A. Y. Grosberg, Rep. Prog. Phys. 77, 022601 (2014).
- Berezovsky et al. (2000) I. N. Berezovsky, A. Y. Grosberg, and E. N. Trifonov, FEBS Lett 466, 283 (2000).
- Sanborn et al. (2015) A. L. Sanborn, S. S. Rao, S.-C. Huang, N. C. Durand, M. H. Huntley, A. I. Jewett, I. D. Bochkov, D. Chinnappan, A. Cutkosky, J. Li, et al., Proc. Natl. Acad. Sci. U. S. A. 112, E6456 (2015).
- Flory (1969) P. J. Flory, Statistical Mechanics of Chain Molecules, New York (Interscience Publishers, 1969).
- Flory (1949) P. J. Flory, J. Chem. Phys. 17, 303 (1949).
- de Gennes (1979) P. G. de Gennes, Scaling Concepts in Polymer Physics (Cornell University Press, Ithaca and London, 1979).
- Cacciuto and Luijten (2006) A. Cacciuto and E. Luijten, Nano Lett. 6, 901 (2006).
- Onoa et al. (2003) B. Onoa, S. Dumont, J. Liphardt, S. B. Smith, I. Tinoco, and C. Bustamante, Science 299, 1892 (2003).
- Mickler et al. (2007) M. Mickler, R. I. Dima, H. Dietz, C. Hyeon, D. Thirumalai, and M. Rief, Proc. Natl. Acad. Sci. U. S. A. 104, 20268 (2007).
- Micheletti et al. (2015) C. Micheletti, M. Di Stefano, and H. Orland, Proc. Natl. Acad. Sci. U. S. A. 112, 2052 (2015).
- Burton et al. (2015) A. S. Burton, M. Di Stefano, N. Lehman, H. Orland, and C. Micheletti, RNA Biology 13, 134 (2015).
- Noel et al. (2010) J. K. Noel, J. I. Sułkowska, and J. N. Onuchic, Proc. Natl. Acad. Sci. U. S. A. 107, 15403 (2010).
- Grosberg (2000) A. Y. Grosberg, Phys. Rev. Lett. 85, 3858 (2000).
- Imakaev et al. (2015) M. V. Imakaev, K. M. Tchourine, S. K. Nechaev, and L. A. Mirny, Soft matter 11, 665 (2015).
- Thirumalai and Hyeon (2008) D. Thirumalai and C. Hyeon, Non-Protein Coding RNAs (Springer, 2008), chap. Theory of RNA Folding: From Hairpins to Ribozymes.
- Thirumalai (1995) D. Thirumalai, J. Phys. I (Fr.) 5, 1457 (1995).
- Greenleaf et al. (2008) W. J. Greenleaf, K. L. Frieda, D. A. N. Foster, M. T. Woodside, and S. M. Block, Science 319, 630 (2008).
- Treiber and Williamson (2001) D. K. Treiber and J. R. Williamson, Curr. Opin. Struct. Biol. 11, 309 (2001).
- Repsilber et al. (1999) D. Repsilber, S. Wiese, M. Rachen, A. W. Schroeder, D. Riesner, and G. Steger, RNA 5, 574 (1999).
- Lutz et al. (2013) B. Lutz, M. Faber, A. Verma, S. Klumpp, and A. Schug, Nucleic Acids Res. 42, 2687 (2013).
- Wu and Tinoco, Jr (1998) M. Wu and I. Tinoco, Jr, Proc. Natl. Acad. Sci. U. S. A. 95, 11555 (1998).
- Koculi et al. (2012) E. Koculi, S. S. Cho, R. Desai, D. Thirumalai, and S. A. Woodson, Nucleic Acids Res. 40, 8011 (2012).
- Montange and Batey (2008) R. K. Montange and R. Batey, Annu. Rev Biophys. 37, 117 (2008).
- Russell et al. (2013) R. Russell, I. Jarmoskaite, and A. M. Lambowitz, RNA Biology 10, 44 (2013).
- Al-Hashimi and Walter (2008) H. Al-Hashimi and N. Walter, Curr. Opin. Struct. Biol. 18, 321 (2008).
- Solomatin et al. (2010) S. V. Solomatin, M. Greenfeld, S. Chu, and D. Herschlag, Nature 463, 681 (2010).
- Hyeon et al. (2012) C. Hyeon, J. Lee, J. Yoon, S. Hohng, and D. Thirumalai, Nat. Chem. 4, 907 (2012).
- Hyeon et al. (2014) C. Hyeon, M. Hinczewski, and D. Thirumalai, Phys. Rev. Lett. 112, 138101 (2014).
- Rivas and Eddy (1999) E. Rivas and S. Eddy, J. Mol. Biol. 285, 2053 (1999), ISSN 0022-2836.
- Hofacker (2003) I. Hofacker, Nucleic Acids Res. 31, 3429 (2003), ISSN 0305-1048.
- Zuker (2003) M. Zuker, Nucleic Acids Res. 31, 3406 (2003).
- Gutell et al. (2002) R. R. Gutell, J. C. Lee, and J. J. Cannone, Curr. Opin. Struct. Biol. 12, 301 (2002).
- Mathews et al. (1999) D. Mathews, J. Sabina, M. Zuker, and D. Turner, J. Mol. Biol. 288, 911 (1999).
- Popot et al. (1987) J.-L. Popot, S.-E. Gerchman, and D. M. Engelman, J. Mol. Biol. 198, 655 (1987).
- Bowie (2005) J. U. Bowie, Nature 438, 581 (2005).
- Kedrov et al. (2004) A. Kedrov, C. Ziegler, H. Janovjak, W. Kühlbrandt, and D. J. Müller, J. Mol. Biol. 340, 1143 (2004).
- Min et al. (2015) D. Min, R. Jefferson, J. Bowie, and T.-Y. Yoon, Nat. Chem. Biol. 11, 981 (2015).
- Palmer (1982) R. Palmer, Adv. Phys. 31, 669 (1982).
- Rinn and Chang (2012) J. L. Rinn and H. Y. Chang, Annu. Rev. Biochem. 81 (2012).
- Carninci et al. (2005) P. Carninci, T. Kasukawa, S. Katayama, J. Gough, M. Frith, N. Maeda, R. Oyama, T. Ravasi, B. Lenhard, C. Wells, et al., Science 309, 1559 (2005).
- Friedman and O’Shaughnessy (1991) B. Friedman and B. O’Shaughnessy, J. Phys. II 1, 471 (1991).
I Supporting Material
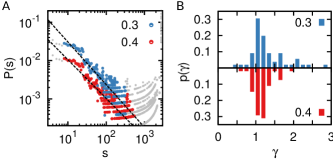
Extraction of Scaling Exponent We obtained the contact probability exponent by conducting linear regression on a part of data that behave as in log-log scale. There are two factors that may affect in determination of : (i) , the cut-off distance to define a contact between two residues, affects the overall shape of ; (ii) The range of , , to be fitted. Instead of manually tuning the fitting range (), we defined a parameter (), such that the proportion of fitting range, where is the chain length, is at least greater than an allocated threshold value, . For instance, if is set to 0.3 then the fit is made on more than 30 % of the entire data points. Thus, by fitting data over all possible pairs of and values which define the range of satisfying , we determine the value of from the best fit which gives the smallest standard error relative to the data points.
Fig. S1A shows that the shape of for 23S-rRNA calculated with different remains effectively identical, giving rise to a similar value of : ( Å), 1.06 ( Å). s for RNA molecules obtained from different are also similar as shown in Fig. S1B.
Next, to study the effect of on , we set Å and change the value of in the fit. We obtain for , and with (see Fig. S2A). Fig. S2B also shows that with different are comparable. Analysis applied to protein shows similar results. A series of comparisons in Figs.S1 and S2 indicate that the average value of is insensitive to the parameters around the value we have chosen.
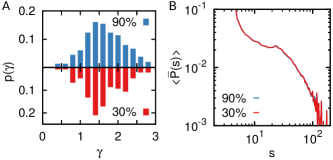
In addition, the overall shapes of and are insensitive to the two threshold values of sequence similarity (90 and 30 %), which we imposed to select a set of non-homologous proteins (Fig. S3).
We analyzed 186 RNA and 16633 individual proteins whose size satisfies ,
available in PDB as of September 2015.
Distributions of obtained from the optimal linear fittings on versus with a correlation coefficient greater than 0.9 are presented in Fig.1A with , Å for both RNAs and proteins.
To highlight the robustness of our result presented in Fig.1A ( vs. plot), we specified the 95 % confidence interval of values using error-bar to each data point in Fig. S4.
Contact probability between two sites of a polymer In general, the contact probability of two sites in polymer chain is determined by the volume available for the subchain ending with the two sites, , with normalization condition Grosberg and Khokhlov (1994); de Gennes (1979):
| (S1) |
where is the contact distance, is the size of polymer made of monomers, is the dimensionality, and is the correlation hole exponent. With (see Fig. S5), we obtain the scaling relationship of contact probability, .
(i) When the excluded volume interaction is fully screened, a test chain (or subchain over a certain length) is ideal. In this case, . Thus, the correlation hole exponent Friedman and O’Shaughnessy (1991) and with , which leads to .
(ii) If the chain adopts an effectively homogeneous space-filling configuration, but the interaction between monomers is weak and the excluded volume interaction is still fully screened as in a concentrated melt, then , , and , which leads to .
(iii) If the chain organization is inhomogeneous leading to an anisotropic arrangement because of strong monomer-monomer interactions Sanborn et al. (2015), which for the case of RNA leads to formation of independently stable helices, then still satisfies but the effective dimensionality of the sampling space () would be less than . Thus, , and , which accounts for the contact probability exponent smaller than 1.
(iv) Note that when the subchain interactions (repulsion and attraction) are screened (), and are related as . This relationship particularly holds good for intermediate range of : (ideal chain) and (crumpled chain) (see Fig. S5). The scaling exponent of at in Fig. S5 is due to the volume exclusion interaction at short range .
| 2M58 | 2MIY | 1FIR | 6TNA | 1EHZ | 1TRA | 4TRA | 1TN1 |
| 1TN2 | 3TRA | 2TRA | 3BBV | 1VTQ | 4PQV | 3A3A | 3CW6 |
| 2HOP | 1I9V | 3L0U | 2K4C | 3D2G | 4NYD | 2HOM | 3GX6 |
| 2GIS | 3GX2 | 3IQN | 4B5R | 2YDH | 4RZD | 3F2Q | 3F2W |
| 3F30 | 3F2X | 3F2T | 3F2Y | 1U9S | 3DHS | 1Y0Q | 4C4Q |
| 2A2E | 3BWP | 4FAX | 4E8P | 4E8R | 4E8Q | 4E8N | 4DS6 |
| 4E8M | 4FAQ | 3J2B | 3J2H | 3J2D | 2YKR | 3J28 | 3J2A |
| 2O45 | 2O43 | 2O44 | 1C2W |
| 2MGW | 2JY5 | 2CR8 | 2RRU | 2KAK | 2DAH | 2EPS | 1JJR |
| 1KMX | 2KQB | 1YSM | 2ECM | 2KMU | 1KFT | 2KPI | 2M8E |
| 2K2T | 2REL | 2YSD | 2L4E | 2MWR | 2YRG | 3GOH | 1Z60 |
| 2KKJ | 1A7I | 1VYX | 2M2F | 2JXD | 2DAL | 3WIT | 2M9W |
| 2YSJ | 1UEO | 1AA3 | 4A3N | 1WG2 | 2D8U | 1WFH | 1HYI |
| 1BW5 | 2DZL | 1X4P | 1VFY | 1X4W | 1HTA | 1SF0 | 1H0Z |
| 2EA6 | 2MFK | 2DI0 | 2EWT | 2RMR | 3H33 | 1RIY | 4TXA |
| 2DA7 | 2LGW | 2JVG | 1X61 | 1WEE | 1X4K | 2DJB | 4P3V |
| 2CT5 | 2LEK | 2HI3 | 1G33 | 2EP4 | 1NEQ | 1APJ | 1WFP |
| 2JXW | 2KW9 | 1SIG | 2M4G | 2LT1 | 1WYS | 1X68 | 2ENN |
| 2E6S | 2D9H | 2ECT | 1E4U | 1JQ0 | 1J3C | 1MJ4 | 4U12 |
| 2MLB | 1UHC | 2CR7 | 1KDU | 1QRY | 1X3H | 2CSY | 2ECL |
| 1RWJ | 2LDR | 4CIK | 3J0R | 1UHA | 4EIF | 1X63 | 2DOE |
| 2LQL | 1CC5 | 1XFE | 2L0S | 3CP1 | 3ZJ1 | 3BT4 | 2LRQ |
| 1IPG | 2Q18 | 4IYL | 2ECW | 2LV2 | 1LMJ | 1ABA | 1C9F |
| 1F1F | 2CT2 | 1C6R | 1FP0 | 2KW1 | 4GPS | 1CTJ | 2M5W |
| 1Y02 | 2D8Y | 2E6R | 1WEO | 2CS3 | 1FBR | 2LGX | 2LGP |
| 2MIQ | 1SJ6 | 1WIA | 2JSN | 2DMD | 2VTK | 3PO8 | 1OPC |
| 2YRE | 2LGV | 1T1D | 3H6N | 1JHG | 4BGC | 2OA4 | 2CQK |
| 2CTK | 3GCE | 2K4J | 3DQY | 1X0T | 2JVL | 1HKF | 2CS8 |
| 3O8V | 3DVI | 2CTW | 4EEU | 2MLK | 1ZOX | 2XXC | 2EO3 |
| 4TVM | 2IVW | 2LW4 | 4HWM | 2KQR | 2JXN | 2HC5 | 1T6A |
| 4ZBH | 1UJX | 2MMZ | 2LHT | 1JUG | 2RA9 | 2XWS | 1G3P |
| 2QYZ | 2FYG | 3O5E | 2ES0 | 4NAZ | 3E2I | 1DQG | 1VSR |
| 1KQW | 1E29 | 2FVV | 3W9K | 1NL1 | 1WK0 | 1XN5 | 2IN0 |
| 2NWF | 2L5Q | 2P0B | 2MO5 | 3ZUI | 2HNA | 2JY9 | 4MYM |
| 3N9D | 2N48 | 4M4Z | 3FME | 1ENV | 2D37 | 2XB3 | 1ZND |
| 4GNY | 4LD1 | 3UF4 | 1D7P | 1EW3 | 3OUQ | 1E88 | 2LFU |
| 2KIG | 2KFU | 1KLO | 3NZM | 2M47 | 4JHG | 1RL6 | 3TXO |
| 2LZM | 2NN5 | 3W9R | 2CP6 | 4F47 | 1EH6 | 1CDY | 2R6V |
| 3K21 | 3WJT | 1WV3 | 4M6T | 2D5M | 3KBG | 1J3G | 1EJE |
| 1JM1 | 3TFM | 4QA8 | 1HXN | 4E1B | 4IT3 | 4JZC | 1EMA |
| 2K18 | 3HBK | 3NO3 | 4PQ0 | 2PNN | 1LVA | 3LTI | 4JS8 |
| 4DWO | 2A1L | 4NW4 | 3V75 | 5BN7 | 1DUW | 3JRP | 2QLU |
| 2LQW | 4X36 | 2HES | 4GGC | 4GGA | 4V16 | 4AA8 | 2FGQ |
| 4AF8 | 1VPR | 2PMN | 2XE1 | 2ASI | 2ZYL | 1T6E | 3BA0 |
| 1J6Z | 4QDC | 4GQ1 | 1FEP | 3GRE | 4UQE | 4MSX | 3R1K |
| 3ACP | 2DH2 | 4COT | 3DWO | 1QCF | 1FMK | 1W52 | 1DQ3 |
| 1G0D | 3K5W | 2OBD | 4NOX | 4FWW | 2E84 | 1Z1N | 4AW7 |
| 1XEZ | 4TLW | 1PI6 | 4UMW | 4BBJ | 3OKT | 1QFG | 4MHC |
| 2OAJ | 4UP5 | 1HN0 | 3KLK |
| 2JX9 | 1ISR | 2LNL | 2RH1 | 2YDV | 2ZIY | 3C9L | 3EHS |
| 3EML | 3N94 | 3OE6 | 3RZE | 3UON | 3V2Y | 3VW7 | 4DKL |
| 4EJ4 | 4F11 | 4IB4 | 1QJQ |