Structure Formation due to Antagonistic Salts
Abstract
Antagonistic salts are composed of hydrophilic and hydrophobic
ions. In a mixture solvent (water-oil)
such ion pairs are preferentially attracted to water or oil,
giving rise to a coupling between
the charge density and the composition.
First, they form a large electric double layer
at a water-oil interface,
reducing the surface tension and producing mesophases.
Here, the cations and anions are loosely bound
by the Coulomb attraction across the interface
on the scale of the Debye screening length.
Second, on solid surfaces,
hydrophilic (hydrophobic) ions
are trapped in a water-rich (oil-rich)
adsorption layer, while those of the other
species are expelled from the layer. This yields
a solvation mechanism of local charge separation near a solid.
In particular, near the solvent criticality,
disturbances around solid surfaces can
become oscillatory in space.
In mesophases, we calculate periodic structures,
which resemble those in experiments.
Keywords: antagonistic salt, selective solvation,
mesophases, ion adsorption, charge inversion
I Introduction
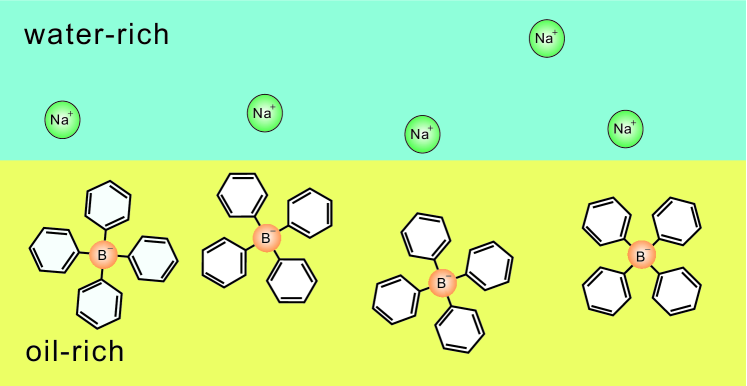
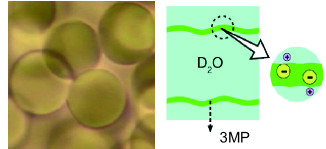
In soft materials, much attention has been paid to the Coulomb interaction among charged objects. However, not enough attention has yet been paid to the solvation (or hydration) interaction between ions and polar solvent molecules Is , particularly when ions induce some phase ordering Bu . In liquid water, small metallic ions are surrounded by several water molecules to form a hydration shell due to the ion-dipole interaction. As a result, such ions are strongly hydrophilic. On the other hand, hydrophobic ions have been used in electrochemistry Bu . An example is tetraphenylborate BPh with a diameter about 0.9 nm consisting of four phenyl rings bonded to a negatively ionized boron (see Fig.1). Because of its large size, it largely deforms the surrounding hydrogen bonding acquiring strong hydrophobicity Chandler .
In this review, we explain some unique effects emerging when both hydrophilic and hydrophobic ions are present in a mixture solvent composed of water and a less polar component (called oil). In this situation, such cations and anions behave antagonistically in the presence of composition heterogeneity and even induce mesophases with charge density waves. As in Fig.1, they tend to segregate around a water-oil interface due to the selective solvation, but they can only undergo microphase separation on the scale of the Debye screening length due to the Coulomb attraction OnukiPRE . Indeed, in a x-ray reflectivity experiment, Luo et al. Luo observed such ion distributions around a water-nitrobenzene interface. The resultant electric double layer reduces the surface tension OnukiJCP ; Araki ; Nara . Such a decrease in was recently observedBonn . Thus, with an antagonistic salt in the vicinity of the solvent criticality, we have to find mesophases.
Sadakae et al. Sadakane ; Sada1 detected a peak in the small-angle neutron scattering amplitude at an intermediate wave number adding a small amount of NaBPh4 in a near-critical D2O and 3-methylpyridine (3MP) mixture. Such a peak indicates mesophase formation. In the phase diagram of D2O-3MP, the closed-loop two-phase region shrinks with NaBPh4, while it expands with a hydrophilic salt such NaClSada1 . Moreover, they observed multi-lamellar (onion) structures at small volume fractions of 3MP far from the criticality SadakanePRL ; Sada2 . Afterwards, Leys et al. Leys examined the dynamics in D2O-3MP with NaBPh4 using dynamic light scattering and small-angle neutron scattering.
We also point out that hydrophilic (hydrophobic) ions can be selectively adsorbed into a water-rich (oil-rich) adsorption layer on a solid wall. This effect is intensified for antagonistic salts, since the disfavored ions are expelled from the layer due to the solvation interaction. Its thickness is microscopic far from the criticality but is widened in its vicinity. The adsorbed ion amount can exceed the bare surface charge of the wall in opposite sign. This is a chemical mechanism of charge inversion Lyk ; Faraudo1 ; Faraudo , originating from the selective solvation.
Another interesting effect with antagonistic salts is that the disturbances around solid surfaces become oscillatory in space near the transition to mesophases Oka ; Ciach . This gives rise to oscillatory dependence of the force between two colloidal particles or two parallel walls on their separation distance . Furthermore, dynamics such as phase ordering and rheology is of great interest. Thus, more experiments are very informative.
In Sec.2, we will present the background of physics and chemistry in aqueous mixtures with antagonistic ion pairs. In Sec.3, we will treat salt-induced mesophases.
II Theoretical background
2.1. Solvation chemical potential
For each solute particle, the solvation part of the
chemical potential is written as
.
In mixture solvents, it depends on the
water composition .
Let us suppose two species of monovalent ions (, ).
At sufficiently low ion densities,
the total ion chemical potential in a mixture solvent
is expressed as
| (1) |
where is the thermal de Broglie length and is the electric potential. In equilibrium is homogeneous. The dependence of has not been well investigated.
We consider a liquid-liquid interface between a water-rich phase and an oil-rich phase with bulk compositions and and with bulk ion densities and . For each ion species we introduce the difference,
| (2) |
which is the Gibbs energy of transfer in electrochemistry (usually measured in units of kJmol)Marcus ; Hung ; Koryta ; Osakai . It is negative (positive) for hydrophilic (hydrophobic) ions. The electric potential tends to constants in and in , yielding a Galvani potential difference,
| (3) |
From the charge neutrality in the bulk, we have
| (4) |
For water-nitrobenzene (NB) at K in strong segregation Bu ; Hung ; Koryta ; Osakai , was for Na+, for Ca2+, and for Br-, while it was for BPh. In the NB-rich phase in this case, the water content is and well-defined hydration shells are already formed around metallic ionsOsakai . For water-alcohol Marcus , was observed to be relatively small in weak segregation. For hydrophobic particles, depends on how they deform the surrounding hydrogen bonding, so it increases sharply with increasing their sizeChandler .
2.2.Ginzburg-Landau theory
In our previous papers OnukiPRE ; OnukiJCP ; Araki ; Nara ,
we used the Ginzburg-Landau theory Onukibook to examine
the interface profiles and the phase behavior,
where and are
coarse-grained variables. The free energy density is
the sum of the electrostatic energy
and
given by
| (5) | |||||
where is the molecular volume with , is the interaction parameter depending on , and we set . Though very crude, we use the linear form where is a constant. Then, . In our theory, represents the solvation strength. The electric field satisfies the Poisson equation , where the dielectric constant depends on as . In this work, we set and .
For large , the phase behavior from our model is complicated even for small . See the mean-field phase diagram in our previous paperNara . Let a homogeneous solution have mean water concentration and mean ion densities . A linear instability occurs for
| (6) |
Here, is the second derivative of the first term in Eq.(5) with respect to , is the Bjerrum length, and the parameter
| (7) |
represents the strength of antagonicity. The Debye wave number is . If Eq.(6) holds with , the fluctuations with wave number grow to form a periodic structure.
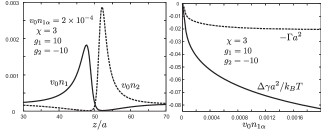
2.3.Interface profiles
In Fig.2, we display typical ion profiles
near an interface (left) along the axis, where hydrophilic cations
and hydrophobic anions are separated on
the scale of the Debye length . In the right panel,
we show the surface tension
deviation
and the ion adsorption vs the ion density
in phase . Here, is the surface tension without ions
and is the integral of
with . For small ion densities, is
given by OnukiJCP ; OnukiPRE
| (8) |
The third electrostatic term is of order in terms in Eq.(3), dominating over the second Gibbs term. We may realize with increasing the salt amount and/or approaching the solvent criticality.
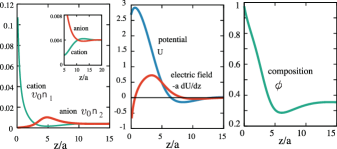
2.4. Selective ion adsorption on a wall
In Fig.3, we plot profiles near a hydrophilic wall,
where we impose the boundary condition
at . Here, the cations
are accumulated in the adsorption layer
(), while the anions are
expelled from it. For simplicity, we neglect the image interaction.
The electric field along the axis is given by
| (9) |
The surface charge density is . As a result, we find for and in an intermediate range . For larger , is very small and is oscillating.
Thus, both adsorption and desorption of ions take place simultaneously on solid surfaces with antagonistic salts in mixture solvents. However, highly hydrophobic ions such AsPh(tetraphenylarsenate) Faraudo and BPh Faraudo1 are absorbed on hydrophobic colloid surfaces in water (without oil) leading to charge inversion.
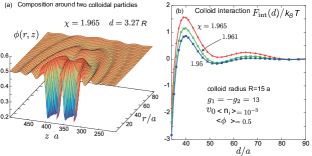
2.5.Spatially oscillating disturbances
Let us assume that is slightly larger than the right hand side
with in Eq.(6) Oka ; Ciach .
In this case, the deviations of the composition and
the electric potential are strongly coupled.
As a result, oscillatory disturbances
appear around colloidal particles
Oka or between parallel solid walls Ciach in equilibrium.
In Fig.4, we show a wavelike profile around two colloidal particles with radius at Oka , where . The center-to-center distance is . Their surfaces are surrounded by oil layers rich in hydrophobic anions without surface charges. They are effectively charged as in Fig.3. No van der Waals interaction is assumed. In the right panel, the interaction free energy of the two particles is plotted as a function of . Instability to a mesophase occurs for , so homogeneity is attained far from the particles. Here, exhibits a shallow minimum at and a maximum of order at . The maximum increases as with increasing the radius , so it can prevent contact of the particles for large .
III Mesophase formation
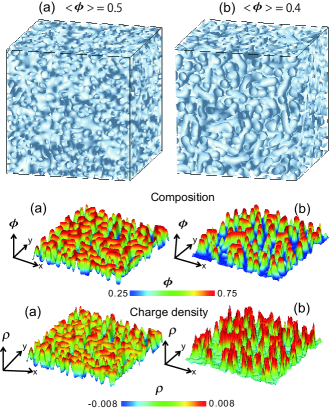
3.1. Mesophases near criticality
To calculate mesophase structures near the
criticalitySadakane ; Sada1 ,
we changed from a small value
to at
, where Eq.(6) is satisfied with .
We used model H equations with viscosity
Araki ; Nara ; Onukibook . The random
patterns in Fig.5 are those at
with , which
are nearly stationary without thermal noises
in the dynamic equations. The domain sizes are on the order of
the Debye length .
For (a) ,
we can see bicontinuous patterns, resembling those
in spinodal decomposition at a critical quench
Onukibook .
For (b) ,
tubelike domains appear, where
the droplet volume fraction (of the region
is 0.25. Remarkably,
the droplets are considerably elongated.
The degree of elongation
increases with increasing the salt amount
(not shown in this paper).
In the lower panels,
we give the cross-sectional profiles of and .
We can see that the domains with
()
are positively (negatively) charged.
With further increasing inside the two phase region, a changeover should occur from random mesophases into macroscopic two-phase states. In real near-critical systems, these mesophase fluctuations are thermally changing in time and their influence on the static and dynamic critical behaviors remains unclear Sada1 ; Leys .
3.2. Onions
Second, as illustrated in Fig.6,
Sadakane et al. Sada2 ; SadakanePRL
observed onions of many membranes (
composed of 3MP and BPh.
The lamellar spacing is nm
and the membrane thickness is nm.
These onions are due
to strong hydrophobicity of BPh
in a water-rich enviroment.
The membranes are analogous to those
of ionic surfactants
and the adsorbed BPh density
on them is of order .
.
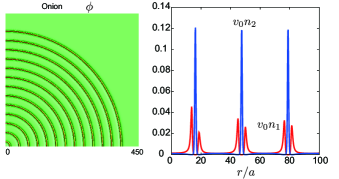
We have also performed simulation to find a similar onion in Fig.7, where , , and . We have minimized the free energy in the spherically symmetric geometry in the region , where is the distance from the center. The lamellar spacing and thickness are and , respectively. The adsorption of the anions within each membrane is per unit area. The composition is 0.827 outside the membranes (commonly within and outside the onion), while the average composition within the membranes becomes about 0.5.
.
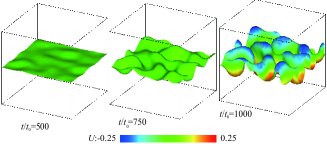
3.3. Interface instability
In Fig.8, we also numerically examine
the interface instability ArakiJ
with and
in a cubic cell with length .
At , an interface was at
and we added
antagonistic ion pairs
to the water side,
where for
and for .
We used the model H equations
and the ion diffusion equations. Here,
surface disturbances
grow after apperance of an
elecric double layer in Fig.2.
We also predict droplet instability induced by an antagonistic salt. It is of interest how planar or spherical interfaces are deformed and proliferated into lamellae in the late stage of the instability.
IV Summary and remarks
We have briefly reviewed the recent research on antagonistic salts in water-oil solvents. Note that the selective solvation has not been accounted for in the previous electrolyte theories, though it yields a variety of unexplored effects Bu . Antagonistic salts should be one of the most unique entities in these problems, though we have not yet well understood the puzzling observations by Sadakane et. al Sadakane ; Sada1 ; Sada2 ; SadakanePRL . In particular, it is of interest how addition of an antagonistic salt changes the nature of the solvent criticality Nara ; Leys ; Sada1 , where the periodic fluctuations appear for as in Fig.5. .
A new aspect highlighted in this work is that antagonistic salts undergo microphase separation near solid surfaces in mixture solvents, as well as across water-oil interfaces. Intriguing is then the behavior of antagonistic salts around proteins or Janus particles having hydrophilic and hydrophobic surface parts.
Acknowledgments
This work was supported by KAKENHI (No. 25610122) and
Grants-in-Aid for Japan Society for Promotion of Science (JSPS)
Fellows (Grants No. 241799 and 263111).
References
- (1) Israelachvili JN. Intermolecular and surface forces. 2nd ed. London: Academic Press; 1992.
- (2) Onuki A, Okamoto R, Araki T. Phase transitions in soft matter induced by selective solvation. Bull Chem Soc Jpn 2011; 84, 569-87.
- (3) Chandler D. Interfaces and the driving force of hydrophobic assembly, Nature 2005; 437: 640-7.
- (4) Onuki A. Ginzburg-Landau theory of solvation in polar fluids: Ion distribution around an interface. Phys Rev E 2006; 73: 021506 (16 pages).
- (5) Luo G, Malkova S, Yoon J, Schultz DG, Lin B, Meron M, Benjamin I, Vanysek P, Schlossman ML. Ion distributions near a liquid-liquid interface. Science 2006; 311: 216-8. .
- (6) Onuki A. Surface tension of electrolytes: Hydrophilic and hydrophobic ions near an interface. J Chem Phys 2008; 128 : 224704 (9 pages).
- (7) Araki T, Onuki A. Dynamics of binary mixtures with ions: dynamic structure factor and mesophase formation. J Phys: Condens Matter 2009; 21 : 424116-24.
- (8) Onuki A, Araki T, Okamoto R. Solvation effects in phase transitions in soft matter. J Phys: Condens Matter 2011; 23 : 284113-25.
- (9) Michler M, Shahidzadeh N, Westbroek M,van Roij R, Bonn D. Langmuir 2015;31:906-11.
- (10) Sadakane K, Seto H, Endo H, Shibayama M. A periodic structure in a mixture of D2O-3-methylpyridine/NaBPh4 induced by solvation effect. J Phys Soc Jpn 2007; 76 : 113602-4.
- (11) Sadakane K, Iguchi Nagao NM, Endo H, Melnichenko YB, Seto H. 2D-Ising-like critical behavior in mixtures of water and 3-methylpyridine including antagonistic salt or ionic surfactant. Soft Matter 2011; 7: 1334-40.
- (12) Sadakane K, Onuki A, Nishida K, Koizumi S, Seto H. Multilamellar structures induced by hydrophilic and hydrophobic ions added to a binary mixture of D2O and 3-methylpyridine. Phys Rev Lett 2009; 103: 167803 (4 pages).
- (13) K. Sadakane K, Nagao M, Endo H, Seto H. Membrane formation by preferential solvation of ions in mixture of water, 3-methylpyridine, and sodium tetraphenylborate. J Chem Phys 2013; 139: 234905-15.
- (14) Leys J, Subramanian D, Rodezno E, Hammouda B, Anisimov MA. Mesoscale phenomena in solutions of 3-methylpyridine, heavy water, and an antagonistic salt. Soft Matter 2013; 9; 9326-35.
- (15) Lyklema J. Overcharging, charge reversal: Chemistry or physics ?, Colloids Surf. A 2006; 291: 3-12.
- (16) Martin-Molina A, Calero C, Faraudo J, Quesada-Perez M, Travesset A, Hidalgo-lvarez R. The hydrophobic effect as a driving force for charge inversion in colloids. Soft Matter 2009; 5: 1350-3
- (17) Calero C, Faraudo J, Bastos-Gonzlez D. Interaction of Monovalent Ions with Hydrophobic and Hydrophilic Colloids: Charge Inversion and Ionic Specificity. J. Am. Chem. Soc. 2011; 133: 15025-35.
- (18) Okamoto R, Onuki A. Charged colloids in an aqueous mixture with a salt. Phys Rev E 2011; 84: 051401-19.
- (19) Pousaneh F, Ciach A. The effect of antagonistic salt on a confined near-critical mixture. Soft Matter 2014; 10: 8188-201.
- (20) Hung LQ. Electrochemical properties of the interface between two immiscible electrolyte solutions. J Electroanal Chem 1980; 115: 159-74.
- (21) Koryta J. Electrochemical polarization phenomena at the interface of two immiscible electrolyte solutions-II. Electrochim. Acta 1984; 29: 445-52.
- (22) Osakai T, Ebina K. Non-Bornian theory of the Gibbs energy of ion transfer between two immiscible liquids. J Phys Chem B 1988; 102: 5691-8.
- (23) Kalidas C, Hefter G, Marcus Y. Gibbs energies of transfer of cations from water to mixed aqueous organic solvent. Chemical Rev 2000; 100: 819-52.
- (24) Onuki A. Phase transition Ddynamics. Cambridge: Cambridge university press: 2002.
- (25) Onuki A, Araki T. Selective Solvation in aqueous mixtures: interface deformations and istability. J Phys Soc Jpn 2012; 81: SA004-12.