Two-dimensional Dirac fermions in YbMnBi2 antiferromagnet
Abstract
We report two-dimensional quantum transport and Dirac fermions in YbMnBi2 single crystals. YbMnBi2 is a layered material with anisotropic conductivity and magnetic order below 290 K. Magnetotransport properties, nonzero Berry phase and small cyclotron mass indicate the presence of quasi two dimensional Dirac fermions. Quantum oscillations in Hall resistivity suggest the presence of both electron and hole parts of the Fermi surface whereas the Berry phase suggests spin-orbit coupling.
pacs:
72.20.My, 72.80.Jc, 75.47.NpI INTRODUCTION
The energy disperson of carriers in Dirac materials can be approximated by the relativistic Dirac equation.Dirac By now it has been established that Dirac states can be found in wide range of materials such as iron-based or copper oxide superconductors, graphene, and topological insulators.Vafek ; PRL 104 137001 ; Science 288 468 ; NovoselovK ; NM 6 183 ; RMP 81 109 ; RMP 82 3045 ; RMP 83 1057 In the quantum limit all carriers are condensed to the lowest Landau level (LL).Fundamentals This is easily realized in laboratory magnetic fields for Dirac fermions since the distance between the lowest and first LL of Dirac fermions is large, in contrast to the conventional electron gas with parabolic energy dispersion. In such a case the components of the resistivity tensor and are linear in magnetic field,PRB 58 2788 quantum Hall effect, non-trivial Berry phase and large unsaturated linear magnetoresistance (MR) are observed.NovoselovK ; Nature 438 201 ; Science 324 924 ; PRL 106 217004
Alkaline earth ternary AMnBi2 crystals (A = alkaline earth such as Sr or Ca) have also been shown to host quasi-2D Dirac states similar to graphene and topological insulators.KefengSr ; KefengCa ; ParkSr ; JiaLL ; PRB 87 245104 ; sr 4 5385 The local arrangement of alkaline earth atoms and spin-orbit coupling are rather important for the characteristics of Dirac cone states. In SrMnBi2 the degeneracy along the band crossing line is lifted except at the place of anisotropic Dirac cone. In contrast, the energy eigenvalue difference due to perturbation potential created by staggered alkaline earth atoms results in a zero-energy line in momentum space in CaMnBi2.
Rare earth compounds RMnBi2 (R=Eu,Yb) are isostructural to SrMnBi2 and CaMnBi2, respectively.Sales ; CavaRJ Whereas antiferromagnetic order of Eu atoms in EuMnBi2 influences Dirac states below Neel temperature = 22 K and consenquently magnetotransport, Dirac semimetal YbMnBi2 features time-reversal symmetry breaking Weyl semimetallic state where the Dirac node separates into two Weyl nodes.Balents ; CavaRJ ; BurkovAA ; WanX Here we report the quasi-two-dimensional quantum transport in YbMnBi2. The nonzero Berry phase, small cyclotron mass and large mobility confirm the existence of Dirac fermions in Bi square nets. The quasi-2D in plane magnetoresistance (MR) shows a crossover from parabolic-in-field semiclassical MR to high-field linear-in-field dependence. The temperature dependence of crossover field is quadratic, as expected for Dirac fermions.
II EXPERIMENTAL DETAILS
YbMnBi2 single crystals were grown from excess Bi. Yb, Mn, and Bi were mixed together according to the ratio Yb: Mn: Bi = 1: 1: 10. Then, the mixture was placed into an alumina crucible, sealed in a quartz tube, heated slowly to 900 ∘C, kept at 900 ∘C for 2 h and cooled to 400 ∘C, where the excess Bi flux was decanted. Shiny single crystals with typical size 3 3 1 mm3 can be obtained. The single crystals free of residual flux droplets can be obtained by cutting the six faces of the cuboid. The element analysis was performed using an energy-dispersive x-ray spectroscopy (EDX) in a JEOL LSM-6500 scanning electron microscope. Single crystal neutron diffraction measurements were performed using the HB3A four-circle diffractometer at the High Flux Isotope Reactor at Oak Ridge National Laboratory. A crystal specimen of approximately 2 x 2 x 1 mm3 was loaded in a closed-cycle-refrigerator whose temperature was controlled in the range (4 - 350) K. For the measurements we used a monochromatic beam with the wavelength 1.551 selected by a multilayer [110]-wafer silicon monochromator, and the scattered intensity was measured using an Anger-camera type detector. The neutron diffraction data were analyzed by the using the FullProf Suite package. Transmission-electron-microscopy (TEM) sample was prepared by crushing the single crystal sample, and then dropping to Lacey carbon grid. X-ray powder diffraction data were collected at 28-ID-C beamline of NSLS-II at Brookhaven National Laboratory by utilizing monochromatic beam ( = 0.01858 nm) and Perkin-Elmer image plate detector from pulverized sample placed in cylindrical polyimide capilary. Data integration to 2 was carried out using Fit2D, while structural refinement of P4/nmm model used GSAS operated under EXPGUI platform.Hammersley ; Larson ; Toby High-resolution TEM imaging and electron diffraction were performed using the double aberration-corrected JEOL-ARM200CF microscope with a cold-field emission gun and operated at 200 kV. Magnetotransport measurements up to 9 T were conducted in a Quantum Design PPMS-9 with a conventional four wire method on cleaved and polished single crystals. Polishing is necessary in order to remove residual bismuth droplets from the surface of as-grown single crystals. Magnetotransport at high magnetic field up to 35 T was conducted at National High Magnetic Field Laboratory (NHMFL) in Tallahassee.
III CRYSTAL AND MAGNETIC STRUCTURE
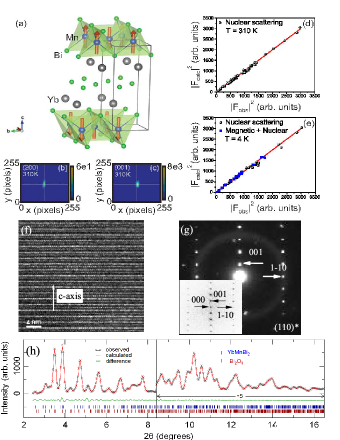
The crystal and magnetic structure of YbMnBi2 determined by neutron diffraction and high resolution TEM (HRTEM) is presented in Figure 1. The nuclear lattice structure was determined from measurements at K, where magnetic order is absent. The magnetic structure was determined at K, and the refined saturated magnetic moment at this temperature is Mn. Refinements were carried out using data sets of 82 reflections, the resulting structural parameters are listed in Table 1. R-factors were obtained for both temperatures. No indication of structural transformation between 300K and 4K has been detected, and no orthorhombic or monoclinic distortions were observed within the HB3a wave vector resolution. The data is fit equally well in both tetragonal and orthorhombic symmetry. The magnetic space group describing the antiferromagnetic (AFM) order at 4 K [Fig. 1 (a)] is . Note that this symmetry does not allow canting of Mn magnetic moments away from the axis, such as inferred in Ref. CavaRJ, . In fact, none of the maximal subgroups of allows such canting, which requires a lower symmetry group, e.g. , and which would mean that either the AFM transition is not of the second order, or that the lattice symmetry is not tetragonal, for which our measurements provide no indications. The SEM obtained atomic ratio of Yb: Mn: Bi is 26: 26: 48, consistent with the composition YbMnBi2. Both HRTEM electron diffraction pattern and fast Fourier transform can be well indexed as (110)* zone of YbMnBi2 structure. Powder diffraction data are well explained by P4/nmm model of YbMnBi2 [a=4.488(2) , c=10.826(2) ), Fig. 1(h). In addition to the main phase, about 10% by weight of Bi2O3 phase was also observed due to secondary oxidation of unreacted Bi metal on crystal surface during pulverization of the single crystal specimen.
| K. | |||||
| Symmetry group: . Bragg R-factor: 5.25. | |||||
| , . Magnetic moment Mn. | |||||
| Atom | x | y | z | Site Multiplicity | |
| Yb1 | 0.25 | 0.25 | 0.73174(19) | 1.051(148) | 2 |
| Mn1 | 0.75 | 0.25 | 0.0 | 1.255(255) | 2 |
| Bi1 | 0.75 | 0.25 | 0.5 | 0.917(159) | 2 |
| Bi2 | 0.25 | 0.25 | 0.16700(29) | 1.027(158) | 2 |
| K. | |||||
| Symmetry group: . Bragg R-factor: 4.83. | |||||
| , . Magnetic moment Mn. | |||||
| Atom | x | y | z | Site Multiplicity | |
| Yb1 | 0.25 | 0.25 | 0.73143(21) | 0.379(173) | 2 |
| Mn1 | 0.75 | 0.25 | 0.0 | 0.707(272) | 2 |
| Bi1 | 0.75 | 0.25 | 0.5 | 0.188(194) | 2 |
| Bi2 | 0.25 | 0.25 | 0.16567(32) | 0.256(187) | 2 |
IV RESULTS AND DISCUSSION
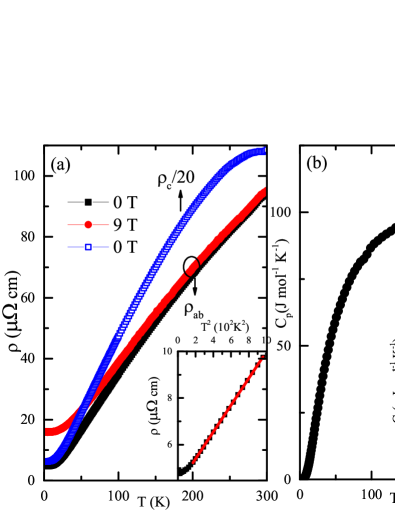
Figure 2(a) shows the temperature dependence of the in-plane () and out-of-plane () resistivity at 0 and 9 T for YbMnBi2 single crystal. The in-plane resistivity becomes flat below 8 K, extrapolating to a residual resistivity (0 T) 4.77 cm. The residual resistivity ratio (RRR) (300 K)/ is about 20. The MR ratio MR = [-] is 234% at 2 K in a 9 T field. The MR is gradually suppressed with temperature increase. The resistivity / is highly anisotropic. The hump below 300 K in , could indicate a crossover from high-T incoherent to low-T coherent conduction.Gutman1 ; Gutman2 As shown in inset in Fig. 2(a), is quadratic-in-temperature below about 5 K: = + with A = 5.74 n cm K-2. The parameter A is inversely proportional to the Fermi temperature, and is only one third of that of SrMnBi2.ParkSr This indicates that the effective mass in YbMnBi2 is rather small.
Specific-heat measurement on YbMnBi2 is shown in Fig. 2(b). A peak is clearly observed at around 285 K, which could be attributed to the magnetic transition.GuoYF The fitting of the low temperature data using = + + gives = 2.16 mJ mol-1 K-2, = 2.36 mJ mol-1 K-4, and = 0.00695 mJ mol-1 K-6. Thus, Debye temperature of 149 K can be obtained.
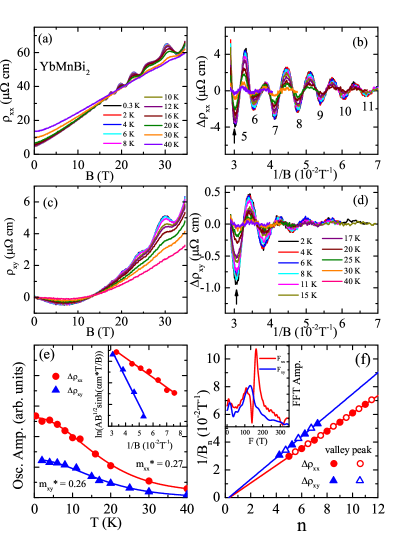
Clear Shubnikov-de Haas (SdH) oscillations in both longitudinal and transverse resistivity are observed up to 35 Tesla [Fig.3(a-d)]. From the fast Fourier transform (FFT) background-subtracted oscillating components and feature a single ( = 130 T)and double frequency (164 T and 108 T), respectively, at 2 K [Fig. 3(b,d)]. According to the classical expression for the Hall coefficient when both electron- and hole-type carriers are present,Smith
In the weak-field limit, the equation can be simplified as = /, while = 1/ in the high field limit. The positive slope of at high field gives , and the negative slope of at weak field indicates . Therefore, at low field, and the nonlinear behavior is the result of the carrier density and mobility competition between hole- and electron-type carriers. Fitting at high field using = 1/ yields = 2.09 cm-3. The mobility = is estimated to be 6.27 cm2 V-1 s-1 at 2 K, comparable to that in NbP and Cd3AsNbP ; LiangT
The main frequency of longitudinal oscillation (164 T) is between the frequencies of SrMnBi2 and CaMnBi2. The difference in FFT frequencies between and is likely due to the different Fermi surface contribution in Hall resistivity channel. From the Onsager relation = (/2), where is the flux quantum and is the orthogonal cross-sectional area of the Fermi surface, we estimate = 1.56 nm-2. This is rather small, similar to that in SrMnBi2 (1.45 nm-2) and is only a few % of the total area of Brillouin zone in (001) plane.ParkSr ; KefengCa We can also approximate 0.705 nm-1, assuming the circular cross-section = . Angle-resolved photoemission spectroscopy (ARPES) and theory calculations reveal three small Fermi surface parts in SrMnBi2: needle-shaped FSs on the - line and near the point, and flower-shaped hole pockets near the point.ParkSr ; CavaRJ It has been pointed out that the main frequency corresponds to the needle-shaped Fermi surfaces on the - line where a Dirac dispersion is expected.ParkSr ; JoYJ The flower-shaped pockets near the point are larger than the FS on the - line. Assuming similar Fermi surface properties between YbMnBi2 and SrMnBi2, the smaller frequency of 108 T might be attributed to the small FS near the point, consistent with the theory calculation, which found small electron-like pockets near the X-points.CavaRJ
Weyl points and the Fermi Arc connecting these points have been directly observed by ARPES in YbMnBi2.CavaRJ It is reported that the Fermi arcs, which participate in unusual closed magnetic orbits by traversing the bulk of the sample to connect opposite surfaces, can be detected by quantum oscillation.NC 5 5161 In our experiment we do not observe the frequency associated with the Fermi arc, possibly due to macroscopic thickness of our sample that exceeds the mean-free path.NC 5 5161 ; Moll
The cyclotron masses and quantum life time of carriers can be extracted from the temperature and field dependence of oscillation amplitude using the Lifshitz-Kosevich formula.Shoeneberg
Where = 22/e 14.69 T/K, = / is the cyclotron mass ratio ( is the mass of free electron), and , with the quantum lifetime. By fitting the thermal damping of the oscillation peak indicated by the arrow in Fig. 3(b) and 3(d), we can extract the cyclotron mass 0.27 and 0.26 for and , similar to that in SrMnBi2 and CaMnBi2.ParkSr ; KefengSr Then, a very large Fermi velocity = = 3.01 m/s can be obtained. As shown in Fig. 3(e), = 11.4 K and = 31.81 K can be obtained by fitting the field dependence of the oscillation amplitude, and is larger than that in BaMnBi2.LiLJ As a result, = 1.05 s and = 3.7 s are obtained. / = 2.8, indicating the anisotropy in longitudinal and transverse scatting time. The scattering time estimated from transport measurement is 9.6 s using = /. There are nearly four order difference between the transport times () and the quantum life time (), similar result has been observed in Cd3As2 and TaAs,LiangT ; JiaS one of the reason is that measures backscattering processes that relax the current while is sensitive to all processes that broaden the Landau levels.
Using the effective mass obtained above, we can calculate the electronic specific heat in quasi-two-dimensional approximation:Ca3Ru2O7
where is Avogadro’s number, is Boltzmann’s constant, and are the in-plane lattice parameters, is the quasiparticle mass and is Planck’s constant. From the effective mass obtained by quantum oscillation, and four bands observed by ARPES,CavaRJ = 2.16 mJ mol-1 K-2 can be obtained, in excellent agreement with the derived from specific heat [Fig. 2(b)], consistent with ARPES measurementCavaRJ and indicating that four bands detected by SdH alone contribute to the electronic specific heat.
One of the key evidence for the existence of Dirac Fermions is the non-trivial Berry’s phase.Ando Figure 3(f) presents the fan diagram of the Landau index. According to the Lifshitz-Onsager quantization rule, LL index is related to the cross section of FS by (/) = 2( + ). As shown in Fig. 3(f), the peak and valley positions of fall on a straight line, the fit gives = 0.21. should be zero for conventional metals but ( 1/2) for Dirac fermions due to the nonzero Berry’s phase associated with their cyclotron motion. Berry phase deviates from the exact value has also been observed on NbP, Bi2Se3, and Bi2Te2Se.NbP The deviation indicates significant spin-orbit coupling, in whose presence , where is the -factor, is the cyclotron mass, and the electron mass.Mikitik1 ; Mikitik2 ; Falkovskii The presence of parabolic bands at the Fermi surface that also might contribute to quantum oscillations is unlikely since their contribution would have been revealed in specific heat measurement. The peaks in should be ”phase-shifted” by 90o from the peaks in . As presented by Fig. 3(f), after the peaks and valleys of are shifted in by 1/4, the Landau fan phase diagram of and agree with each other quite well, confirming the non-zero Berry’s phase obtained from .
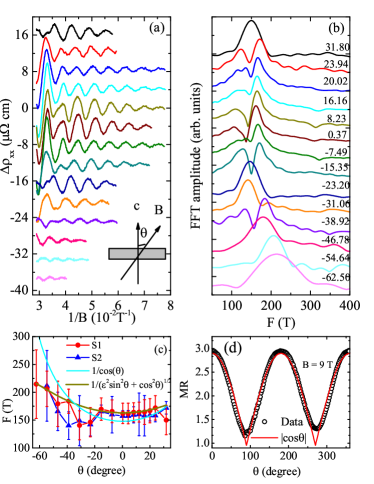
The Bi square nets in SrMnBi2, and CaMnBi2 host Dirac states with quasi-2D Fermi surface. We perform the field dependence of longitudinal resistance up to 35 T at different angles to study the topological structure of YbMnBi2. The geometry of the measurement setup is shown in the inset of Fig. 4(a). Figure 4(a) presents angle-dependent oscillation component after background subtraction. The oscillation peaks shift systematically with the angle increase. We perform FFT on the data in Fig. 4(a), and the results is shown in Fig. 4(b). Two peaks can be observed in the low angle data, we only take the main peak into consideration. The positions of main peak are summarized in Fig. 4(c); the frequency increases with the angle tilt from zero. The angle dependence of the FFT peaks can be roughly fitted assuming dominant contribution of quasi-2D conducting states (/cos) at the Fermi surface. However, as shown in Fig. 4(c), the ellipsoid function /(sin + cos)1/2, offers an alternative description. This suggests the interplay of quasi-2D and bulk 3D states in the topological structure of the FS. In addition, a dip between -23o to -31o also confirms non-trivial nature of the YbMnBi2 Fermi surface.
The MR of solids only responds to the extremal cross section of the Fermi surface along the field direction. For a 2D fermi surface, the MR will only respond to the perpendicular component the of the magnetic field Bcos(). Angle-dependent MR of YbMnBi2 single crystal at = 9 T and = 2 K is shown in Fig. 4(d). MR shows two fold symmetry; when magnetic field parallels to the axis of the single crystal ( = 0), the MR is maximized and it gradually decreases with the field titling away from axis. MR is minimized when the field is applied in the plane. The curve can be fitted by a function of cos(), indicating that quasi-2D fermi surface dominate magnetotransport in YbMnBi2.
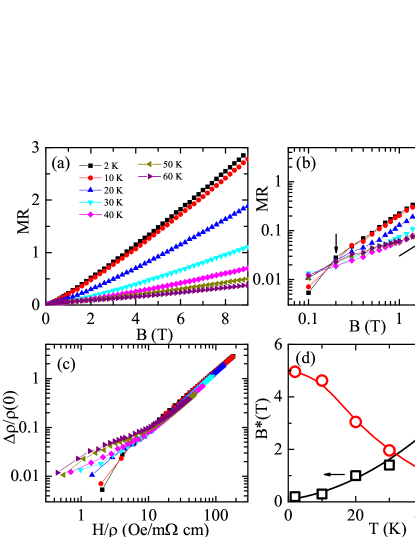
Figure 5(a) presents the magnetic field dependence of MR at different temperatures. MR is also plotted in Fig. 5(b) on a log-log scale to emphasize the low field behavior. From Fig. 5(b), we can observe that linear MR behavior is established above a crossover field B∗. With increasing temperature, MR gradually decreases and increases. The normal MR of bands with parabolic dispersion either saturates at high fields or increases as . The unusual nonsaturating linear magnetoresistance has been reported in Ag2-δ(Te/Se), Bi2Te3, Cd3As2, BaFe2As2 and (Ca, Sr)MnBi2.KefengSr ; KefengCa In the quantum limit where all the carriers occupy only the lowest LL, the observed corresponds to the quantum limit of = (1/2)(+)2.PRB 58 2788 As shown in Fig. 5(c), the B∗ can be fitted quite well by the above equation, which confirms the the existence of Dirac states in YbMnBi2. Furthermore, MR in YbMnBi2 conforms to Kohler’s rule /(0) = [/(0)] (where usually follows a power law) in high magnetic fields [Fig. 5(c)]. This indicates that there is a single salient scattering time in YbMnBi2, i.e. that even though the Fermi surface contains contribution from multiple bands, highly conducting (i.e. Dirac) states dominate MR.
V CONCLUSIONS
We have demonstrated quantum transport in antiferromagnetically ordered YbMnBi2 single crystals. At 4 K the saturated magnetic moment is Mn whereas Mn magnetic moments are oriented along the c-axis. High-magnetic-field magnetotransport is consistent with the presence of Dirac fermions and significant spin-orbitcoupling of the Dirac-like carriers. It would be of interest to study in depth details of magnetic structure, Berry phase in ultrathin samples and putative ferromagnetic states in doped crystals.
Acknowledgements
VOG gratefully acknowledge H. Cao for the support during the neutron diffraction experiment. Work at BNL was supported by the U.S. DOE-BES, Division of Materials Science and Engineering, under Contract No. DE-SC0012704. Work at the National High Magnetic Field Laboratory is supported by the NSF Cooperative Agreement No. DMR-0654118, and by the state of Florida. Work at the Oak Ridge National Laboratory was sponsored by the Scientific User Facilities Division, Office of Basic Energy Sciences, US Department of Energy. X-ray scattering data were collected at 28-ID-C x-ray powder diffraction beam line at National Synchrotron Light Source II at Brookhaven National Laboratory. Use of the National Synchrotron Light Source II, Brookhaven National Laboratory, was supported by the U.S. Department of Energy, Office of Science, Office of Basic Energy Sciences, under Contract No. DE-SC0012704.
References
- (1) T.O. Wehling, A.M. Black-Schaffer and A.V. Balatsky, Advances in Physics 63, 1 (2014).
- (2) Oskar Vafek and Ashvin Vishwanath, Annu. Rev. Condens. Matter Phys. 5, 83 (2014).
- (3) P. Richard, K. Nakayama, T. Sato, M. Neupane, Y.-M. Xu, J. H. Bowen, G. F. Chen, J. L. Luo, N. L. Wang, X. Dai, Z. Fang, H. Ding, and T. Takahashi, Phys. Rev. Lett. 104, 137001 (2010).
- (4) J. Orenstein and A. J. Millis, Science 288, 468 (2000).
- (5) K. S. Novoselov, A. K. Geim, S. V. Morozov, D. Jiang, M. I. Katsnelson, I. V. Grigorieva, S. V. Dubonos and A. A. Firsov, Nature 438, 7065 (2005).
- (6) A. K. Geim and K. S. Novoselov, Nat. Mater. 6, 183 (2007).
- (7) A. H. Castro Neto, F. Guinea, N. M. R. Reres, K. S. Novoselov, and A. K. Geim, Rev. Mod. Phys. 81, 109 (2009).
- (8) M. Z. Hasan, and C. L. Kane, Rev. Mod. Phys. 82, 3045 (2010).
- (9) X. L. Qi and S. C. Zhang, Rev. Mod. Phys. 83, 1057 (2011).
- (10) A. A. Abrikosov, Fundamentals of the Theory of Metals (North-Holland, Amsterdam, 1988).
- (11) A. A. Abrikosov, Phys. Rev. B 58, 2788 (1998).
- (12) Y. Zhang, Z. Jiang, Y.-W. Tan, H. L. Stormer, and P. Kim, Nature (London) 438, 201 (2005).
- (13) D. Miller, K. Kubista, G. Rutter, M. Ruan,W. de Heer, P. First, and J. Stroscio, Science 324, 924(2009).
- (14) K. K. Huynh, Y. Tanabe, and K. Tanigaki, Phys. Rev. Lett. 106, 217004 (2011).
- (15) Kefeng Wang, D. Graf, Hechang Lei, S. W. Tozer, and C. Petrovic, Phys. Rev. B 84, 220401(R) (2011).
- (16) Kefeng Wang, D. Graf, Limin Wang, Hechang Lei, S. W. Tozer, and C. Petrovic, Phys. Rev. B 85, 041101(R) (2012).
- (17) J. Park, G. Lee, F. Wolff-Fabris, Y. Y. Koh, M. J. Eom, Y. K. Kim, M. A. Farhan, Y. J. Jo, C. Kim, J. H. Shim, and J. S. Kim, Phys. Rev. Lett. 107, 126402 (2011).
- (18) L.-L. Jia, Z.-H. Liu, Y.-P. Cai, T. Qian, X.-P. Wang, H. Miao, P. Richard, Y.-G. Zhao, Y. Li, D.-M. Wang, J.-B. He, M. Shi, G.-F. Chen, H. Ding and S.-C. Wang, Phys. Rev. B 90, 035133 (2014).
- (19) G. Lee, M. A. Farhan, J. S. Kim, and J. H. Shim, Phys. Rev. B 87, 245104 (2013).
- (20) Y. Feng, Z. J. Wang, Ch. Y. Chen, Y. G. Shi, Z. J. Xie, H. M. Yi, A. J. Liang, S. L. He, J. F. He, Y. Y. Peng, X. Liu, Y. Liu, L. Zhao, G. D. Liu, X. L. Dong, J. Zhang, C. T. Chen, Z. Y. Xu, X. Dai, Z. Fang, and X. J. Zhou, Scientific Reports 4, 5385 (2014).
- (21) A. F. May, M. A. McGuire, and B. C. Sales Phys. rev. B 90, 075109 (2014).
- (22) Leon Balents, Physics 4, 36 (2011).
- (23) S. Borisenko, D. Evtushinsky, Q. Gibson, A. Yaresko, T. Kim, M. N. Ali, B. Büchner, M. Hoesch, R. J. Cava, arXiv: 1507.04847.
- (24) A. A. Burkov, M. D. Hook, and Leon Balents, Phys. Rev. B 84, 235126 (2011).
- (25) Xiangang Wan, Ari M. Turner, Ashvin Vishwanath, and Sergey Y. Savrasov, Phys. Rev. B 83, 205101 (2011).
- (26) A. P. Hammersley, S. O. Swenson, M. Hanfland and D. Hauseman, High Pressure Res. 14, 235 (1996).
- (27) A. C. Larson and R. B. von Dreele, Report No. LAUR-86-748, Los Alamos National Laboratory (1987).
- (28) B. H. Toby, J. Appl. Crystalogr. 34, 210 (2001).
- (29) D. B. Gutman and D. L. Maslov, Phys. Rev. Lett. 99, 196602 (2007).
- (30) D. B. Gutman and D. L. Maslov, Phys. Rev. B 77, 035115 (2008).
- (31) Y. F. Guo, A.J. Princep, X. Zhang, P. Manuel, D. Khalyavin, I. I. Mazin, Y. G. Shi, and A. T. Boothroyd, Phys. Rev. B 90, 075120 (2014).
- (32) R. A. Smith, Semiconductors (Cambridge University, Cambridge, England, 1978).
- (33) C. Shekhar, A. K. Nayak, Y. Sun, M. Schmidt, m. Nicklas, I. Leermakers, U. Zeitler, Y. Skourski, J. Wosnitza, Z. K. Liu, Y. L. Chen, W. Schnelle, H. Borrmann, Y. Grin, C. Felser, and B. H. Yan, Nature Phys. 11, 645 (2015).
- (34) T. Liang, Q. Gibson, M. N. Ali, M. H. Liu, R. J. Cava, and N. P. Ong, Nature Mater. 14, 280 (2015).
- (35) Y. J. Jo, J. Park, G. Lee, M. J. Eom, E. S. Choi, J. H. Shim, W. Kang, and J. S. Kim, Phys. Rev. Lett. 113, 156602 (2014).
- (36) A. C. Potter, I. Kimchi, and A. Vishwanath, Nat. Commun. 5, 5161 (2014).
- (37) P. J. W. Moll, N. L. Nair, T. Helm, A. C. Potter, I. Kimchi, A. Vishwanath, and J. G. Analytis, arXiv: 1505.02817
- (38) D. Shoeneberg, (Cambridge University Press, Cambridge, UK, 1984).
- (39) L. J. Li, K. F. Wang, D. Graf, L. M. Wang, A. F. Wang, and C. Petrovic, Phys. Rev. B 93 115141 (2016).
- (40) C. L. Zhang, Z. J. Yun, S. Y. Xu, Z. Q. Lin, B. B. Tong, M. Z. Hasan, J. F. Wang, C. Zhang, S. Jia, arXiv: 1502.00251
- (41) N. Kikugawa, A. W. Rost, C. W. Hicks, A. J. Schofield, and A. P. Mackenzie, J. Phys. Soc. Jpn., 79, 024704 (2010).
- (42) Yoichi Ando, J. Phys. Soc. Jpn. 82, 102001 (2013).
- (43) G. P. Mikitik and Yu. V. Sharlai, Phys. Rev. B 67, 115114 (2003).
- (44) G. P. Mikitik and Yu. V. Sharlai, Phys. Rev. B 85, 033301 (2012).
- (45) L. A. Falkovskii, J. Exp. Theor. Phys. 17, 1302 (1963).