Inherent Structure Energy is a Good Indicator of Molecular Mobility in Glasses
Abstract
Glasses produced via physical vapor deposition can display greater kinetic stability and lower enthalpy than glasses prepared by liquid cooling. While the reduced enthalpy has often been used as a measure of the stability, it is not obvious whether dynamic measures of stability provide the same view. Here, we study dynamics in vapor-deposited and liquid-cooled glass films using molecular simulations of a bead-spring polymer model as well as a Lennard-Jones binary mixture in two and three dimensions. We confirm that the dynamics in vapor-deposited glasses is indeed slower than in ordinary glasses. We further show that the inherent structure energy is a good reporter of local dynamics, and that aged systems and glasses prepared by cooling at progressively slower rates exhibit the same behaviour as vapor-deposited materials when they both have the same inherent structure energy. These findings suggest that the stability inferred from measurements of the energy is also manifested in dynamic observables, and they strengthen the view that vapor deposition processes provide an effective strategy for creation of stable glasses.
1 Introduction
Ordinary glasses are typically prepared by cooling a liquid at a rate that is sufficiently fast to avoid crystallization. Upon cooling towards the glass transition temperature , the viscosity and characteristic relaxation times increase considerably [1, 2, 3, 4, 5]. Eventually, such relaxation times exceed the cooling rate, leading to dynamic arrest and glass formation [3, 4, 5]. This transition is accompanied by a change in the specific heat and defines the calorimetric glass transition temperature [2, 4]. As the relaxation times become larger than the available laboratory time scales, the system is no longer able to reach its equilibrium state and thus “falls out of equilibrium” [5]. However, dynamics do not come to a halt in the glass phase. Instead, the system slowly evolves towards its equilibrium state in a process called “physical aging”, characterized by an increase of the density and the structural relaxation time [6]. Thus, within the traditional view of glass formation, two strategies can be followed to prepare a glass that is closer to its equilibrium state: employing a slower cooling rate, or letting the system age for an extended period period of time.
Recent experiments have shown that glasses can also be created through a process of physical vapor deposition (PVD), leading to materials whose macroscopic characteristics, such as mechanical properties or onset temperature, can exceed those of highly aged ordinary glasses. Specifically, PVD glasses can exhibit extraordinary thermodynamic and kinetic stability [7, 8], an increased density [7, 9, 8] and a reduced enthalpy [10, 11, 12, 13]. A growing body of numerical simulations has sought to interpret from a molecular perspective available experimental observations on PVD glasses. Simulations have been able to reproduce several experimentally observed features, including higher thermodynamic and kinetic stability, the existence of an optimal substrate temperature for vapor deposition, the existence of a mobile layer at the vacuum interface, and the ability to control anisotropy through the deposition process experiments [14, 15, 16, 17, 18].
In both experimental and simulation studies, the enthalpy has been used as a convenient, easily accessible measure for the stability. In experiments, the enthalpy is typically determined by relying on calorimetry measurements [19, 11, 12, 13, 20]. In simulations, one can determine directly the average potential energy per particle and use that to assess stability [15, 16, 17]. The enthalpy of a PVD glass can be compared to the measured or extrapolated enthalpy of an ordinary glass that has been aged over a long period of time, thereby providing an indirect means of assessing the age and stability of a material. Such a measure of stability, however, is purely thermodynamic. It is therefore of interest to determine whether dynamic measures of stability, such as characteristic relaxation times, provide the same view of PVD glasses that, up to now, has been generated on the basis of largely thermodynamic quantities. Annealing experiments have demonstrated that, upon heating, stable glasses take a much longer time to reach the liquid state than ordinary glasses, thereby suggesting that they exhibit strongly reduced dynamics [21, 22, 23]. Furthermore, dielectric measurements reveal a strong suppression of the -relaxation in stable glasses [24]. Similar techniques, however, have not been applied in simulations of vapor-deposited glasses. Here, a connection between the inherent structure energy and the dynamics is of particular interest as the energy, similar to the enthalpy, is easily accessible, whereas long and demanding simulation runs are necessary to extract dynamic properties.
More generally, in this work we address the issue of whether vapor deposited glasses are dynamically equivalent to aged glasses. We examine whether the dynamics in vapor deposited glasses are comparable to those of glasses aged over long periods of time. We ask if vapor deposited glasses are indeed closer to the equilibrium state than ordinary glasses, or if they represent a “hidden amorphous state” [25] that transforms back to an ordinary glass over time.
To approach these questions, we analyze the decay of the incoherent intermediate scattering function (ISF) in vapor deposited and ordinary glasses for three different glass formers: a bead-spring polymer melt, a two-dimensional binary mixture, and a three-dimensional binary mixture. For all three systems, we find that the dynamics are indeed strongly slowed in stable glasses. Furthermore, we confirm that none of the models considered here displays any sign of a “hidden amorphous state”. Instead, we find that the inherent structure energy is a good indicator for the dynamics, and that slowly cooled or aged ordinary glasses with the same inherent structure energy as a vapor deposited glass display almost identical dynamics. This finding also holds for vapor deposited and liquid cooled polymer films, which are structurally different.
2 Methods
The models and simulation protocols used to replicate the vapor deposition process have been described in the literature for the polymer system[17], the 3D Lennard-Jones binary mixture (3dBM)[15, 16], and the 2D Lennard-Jones binary system (2dBM)[26]. For completeness, only a brief summary is provided in what follows. The first glass former we consider is a binary mixture consisting of two types of particles, type and type , in a ratio of for the 3dBM system and for the 2dBM system [27]. The particles interact via a Lennard-Jones (LJ) potential truncated at and extrapolated to smoothly decay to zero at . In the following, all values are reported in LJ units. To this end, we set , , the mass , and . In these units, the relevant interaction parameters are , , , and .
As an alternative glass former, we study a simple bead-spring polymer model. The polymer system consists only of type- particles, connected via bonds to form chains of length or , well below the entanglement length [28]. Bonded particles (beads) are connected by a harmonic potential, whose spring constant and equilibrium bond length are chosen to prevent chain crossings and inhibit crystallization [29]. The substrate consists of a third type of atoms. It interacts with the glass former via a LJ potential with the following interaction parameters: (3d BM), (2d BM, polymer), (2d/3d BM), (polymer), (3d BM), (2d BM), , and .
| Polymer | Binary mixture (3d) | ||||||
|---|---|---|---|---|---|---|---|
| Polymer | Binary mixture (2d) | ||||||
To replicate the vapor deposition process, we first place substrate atoms randomly in a thin layer at the bottom of the simulation box and minimize the energy to remove overlap and to spread the atoms evenly across the layer. Then, the substrate atoms are tethered to their current position using a harmonic spring with spring constant . Onto this substrate we deposit the glass former. For the polymer glass and the 3dBM system, we iterate the following steps: (1) We introduce either a set particles of the binary mixture or one polymer chain into the system and bring it into contact with the surface of the film (or the substrate if no film has yet formed); (2) We slowly cool the newly introduced particle(s) to the substrate temperature; and (3) We perform energy minimization using the FIRE algorithm [30]. These steps are designed to improve the efficiency of the simulation by assisting the newly deposited particle(s) in finding their most favorable, nearby local energy minimum. During deposition and the subsequent isothermal run, all particles are coupled to an external heat bath using the Nosé-Hoover thermostat [31, 32]. This procedure differs from the experimental situation in that local equilibrium is attained by quenching the system to a nearby energy minimum through a steepest-descent procedure. By taking advantage of the reduced numerical complexity afforded in two dimensions, for the 2dBM system we follow a more realistic algorithm in which only the substrate atoms are coupled to an external heat bath, and we refrain from performing energy minimizations. Instead, we allow newly deposited particles to reach the equilibrium (substrate) temperature through “natural” energy dissipation mechanisms.
After the deposition is complete, all films are relaxed for LJ-time units before collecting data. Ordinary glass films are created by heating vapor deposited films well above the glass transition temperature and slowly cooling them to the desired temperature at a specified cooling rate.
In order to study the microscopic dynamics, we deposited films at various substrate temperatures in the range from to (see Table 1). At each temperature, we perform isothermal runs on four independent configurations for each system.
3 Results and discussion
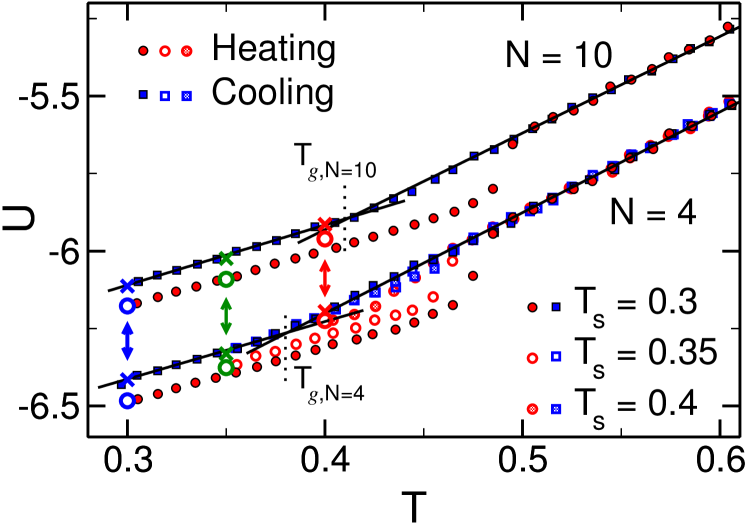
We begin our discussion with an analysis of our results for the polymer model. In order to compare vapor deposited glasses to ordinary glasses, vapor deposited materials are heated to , well above the glass transition temperature, and cooled back down to the desired temperature at a rate of . During this heating/cooling run, we calculate the average potential energy in the center region of the film[17]. Our aim is to reproduce standard differential scanning calorimetry procedures, albeit at much higher cooling rates than those typically used in experiments. Our results for the energy, shown in Fig. 1, bear several of the characteristics that have been experimentally observed in stable glasses: A lower potential energy, and an onset temperature that is much higher than the glass transition temperature for the same cooling/heating rate. These findings have been reported elsewhere, and strongly indicate that vapor-deposited materials lie deeper in the potential energy landscape[17]. What has perhaps not been firmly established before, however, is whether a low potential energy does indeed translate into slower structural relaxation in vapor deposited materials.
Our analysis of dynamics is performed by relying on the glass transition temperature as a reference. In this work, we use the simulated potential energy curves to define the relevant simulated glass transition temperatures by identifying two linear regimes in the cooling run, one corresponding to the equilibrium supercooled liquid and another to the glass regime, respectively. We then fit the data in the linear regimes (solid lines in Fig. 1) and calculate the intersection point. For the polymer systems considered here, we find for and for . For the binary systems, we find in three dimensions[16] and in the two-dimensional model[26].
The incoherent intermediate scattering function (ISF) is given by
| (1) |
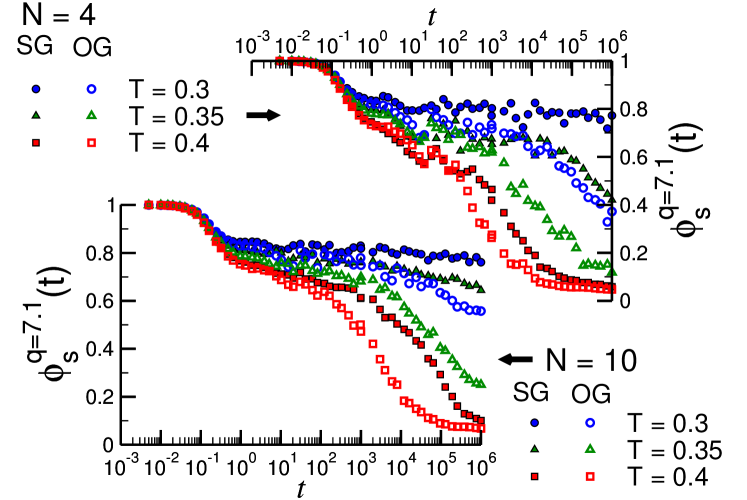
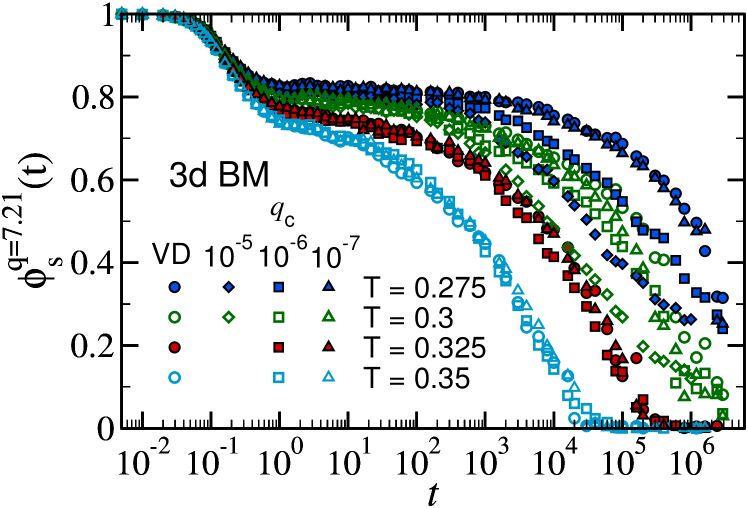
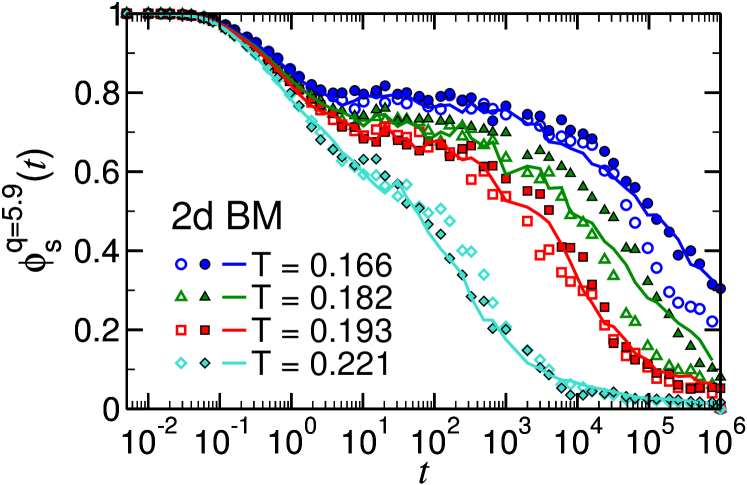
where is the aging time, i.e. the time between the start of the trajectory and the start of the measurement, and the average is taken over -vectors in random directions. Here, corresponds to the first peak in the static structure factor, which is at for the polymer melt, for the 3dBM system, and for the 2dBM system. For simplicity, we use .
Our results for the polymer system are shown in Fig. 2. First, we note that our basic hypothesis holds true: the decay of the ISF for vapor-deposited materials is slower than for their ordinary counterparts, indicating that the dynamics of simulated vapor-deposited glasses are significantly slower. This observation holds for all temperatures and both chain lengths. Furthermore, we note that the plateau value is slightly larger for the vapor deposited glass compared to the respective liquid-cooled one. This observation is consistent with the increased density observed in vapor-deposited systems. It is important to emphasize that, at least for the polymeric system, the structure of vapor deposited glasses is highly anisotropic and considerably different from that of the corresponding ordinary material [17]. As such, it is particularly important to stress that for these materials, a lower potential energy continues to correspond to slower dynamics, even if the material adopts different molecular packing arrangements. This finding is also relevant in view of recent findings, which indicate that vapor-deposition enables control of molecular anisotropy in stable glasses [33, 34, 8].
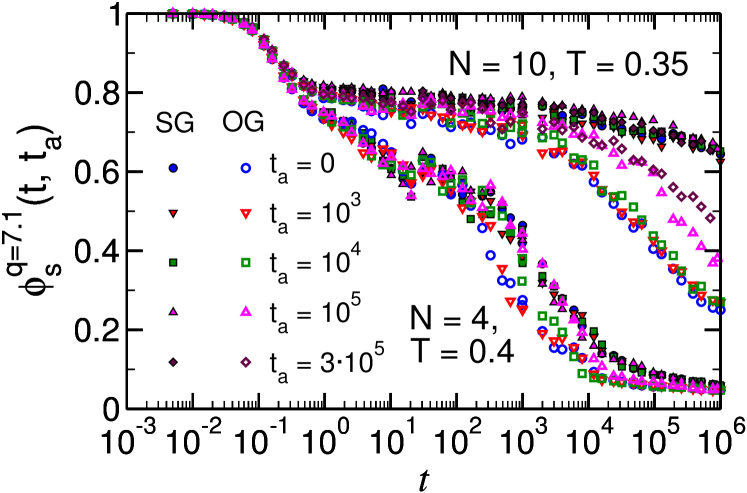
We further note that dynamics in the vapor deposited glass is significantly slower than in the ordinary material, even when deposited above , as can be seen in Fig. 2 for chains of length (deposited at ). Given the fact that the potential energy at is very close to the equilibrium supercooled-liquid line, the question arises as to which of the two systems corresponds to the equilibrium state. To address this issue, we calculate the ISF for various aging times. Figure 3 shows results for at and at . First, we note that at , the vapor deposited glass is in equilibrium, whereas for the fast cooling rates considered here, the system cooled from the liquid state retains some memory from its process of formation. We attribute this behavior to the polymeric nature of the molecules: while the system is able to relax on the scale of the individual chain segments at , it is not able to do so on the length scale of the entire chains. Our observation is further supported by the fact that the short chains deposited at show an onset temperature slightly larger than the glass transition temperature (see Fig. 1). For the longer chains , below equilibrium can no longer be attained by aging on the time scales considered here. Instead, we observe the typical aging behavior in which the plateau value increases and the decay from the plateau shifts to later times. In contrast, for the vapor deposited material, we find no evidence of aging on the time scales accessible to our simulations: the ISF data remain unchanged for all aging times studied in this work. Given that the potential energy of the stable glass lies on the extrapolated supercooled liquid line, it is plausible to assume that the system has reached its equilibrium potential energy. This observation further underscores that vapor deposition provides a surprisingly effective experimental and simulation technique for preparation of glasses whose properties are difficult to attain via traditional liquid-cooling processes.
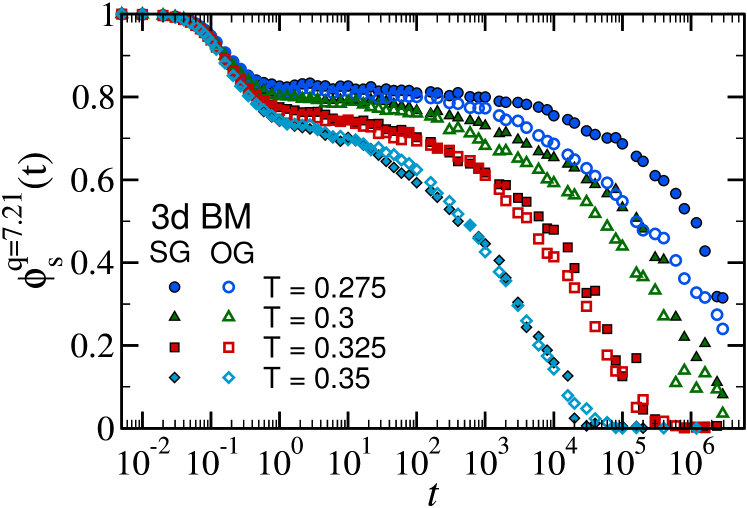
We now consider whether the 3D and 2D binary mixtures prepared by vapor deposition also exhibit slower dynamics. The ISFs for the 3-dimensional system are shown in Fig. 4. First, we note that the general behavior is similar to that found for the polymer system, albeit the difference between ordinary and stable glasses is less pronounced. As with the polymers, the difference in dynamics between the vapor deposited and the ordinary glass increases with lower deposition temperatures.
For the polymer systems we examined the effect of aging on the material. For the LJ mixtures, we examine the effect of cooling rate. Specifically, we consider the following three rates , , and . The corresponding ISFs are displayed in Fig. 5. As expected, the dynamics are markedly slower for systems cooled by slower cooling rates. For the slowest cooling rate considered here, the dynamics almost overlap with those of the as-deposited films. We note, however, that the liquid-cooling procedure is much more computationally demanding than vapor deposition.
These results do, in fact, raise a more fundamental question: What is a fair comparison between vapor deposited and liquid cooled films? This question is particularly important for numerical simulations, where typical cooling rates are orders of magnitude faster than the 1 /min typically employed in experiments. Two measures can be considered: One can (1) compare cooling and deposition protocols that are run over the same amount of time, measured in LJ time units, or, (2), which processes lead to the same inherent structure energy, i.e. which glasses are comparable in terms of the potential energy landscape. The lowest inherent structure energies that can be reached by vapor deposition are, in general, not attainable by liquid cooling. To reach the lowest inherent structure energy reported in Ref. [26] by liquid cooling, a rate on the order of would be necessary, requiring on the order of thousands of years of simulation time on a typical CPU. For the purposes of this manuscript, we have thus deliberately chosen suboptimal parameters for the vapor deposition process, leading to rather ”poor” glasses in comparison. Only these suboptimal parameters allow the liquid cooled system to reach in reasonable timescales the same inherent structure energy that is achieved by vapor deposition. The inherent structure energies for the three different protocols are listed in Table 2. We note that the inherent structure energies are lower for the vapor deposited films compared to the liquid cooled ones formed during the same amount of time, except for the highest temperature which is above . This demonstrates that vapor deposited glass lie deep in the potential energy landscape.
The ISFs for the three different formation protocols are displayed in Fig. 6. Two conclusions can be drawn from the figure. First, at lower temperatures, the ISF decays faster for the liquid cooled system formed over the same amount of time as the vapor deposited film. This further substantiates our premise that vapor deposition provides an efficient means by which to form glasses that reside deep in the potential energy landscape. Second, glasses that reach the same inherent structure energy via slow liquid cooling or vapor deposition exhibit almost identical dynamics. In fact, the ISFs mostly overlap with being a notable outlier. This is, however, not surprising given the fact that the inherent structure energy is lower for the slowly cooled system at this temperature (see Table 2). Thus, Fig. 6 suggests that systems with the same inherent structure energy display identical dynamics as measured by the incoherent scattering function. This is far from obvious, considering the different formation protocols, yet it is not implausible given that both systems are structurally similar.
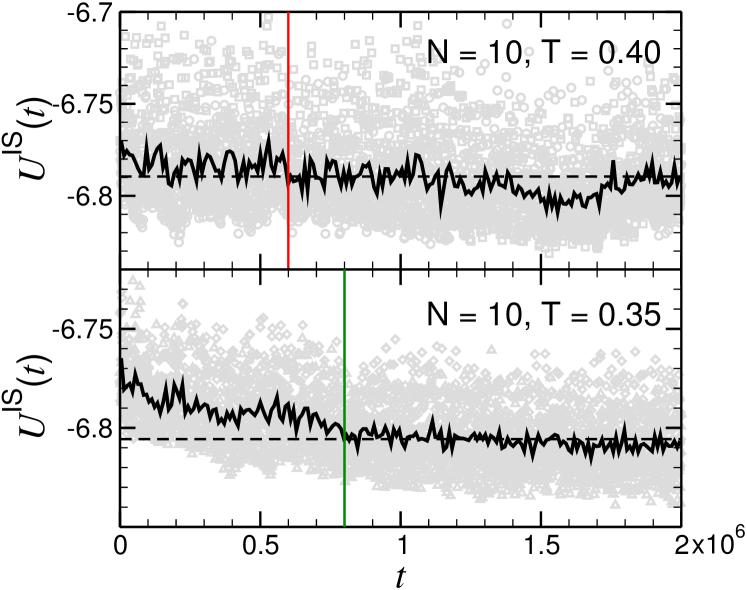
To test whether this finding holds also for systems that are structurally different, we turn again to the polymer system with chains of length . During deposition, these polymers stretch out on the surface and retain their alignment as the film grows [17]. Thus, vapor deposited polymer films display strong anisotropy, with the end-to-end vectors of the polymers closely aligned parallel to the film surface. Liquid-cooled polymer films, on the other hand, are fully isotropic. To determine the inherent structure energy , we performed an isothermal run and minimized the energy at regular intervals using the FIRE [30] algorithm. We determined the average for the vapor deposited glass within the first 1000 LJ time units (). Next, we determined for the ordinary glass over a long trajectory () and estimated the time at which the inherent structure energy reached the same value as the just-deposited film. The results are displayed in Fig. 7. At , i.e. above the glass transition temperature, changes only a little, whereas at a clear trend is visible. We estimate that after a time for the system above and for the system below , the ordinary glass has the same inherent structure energy as the vapor deposited glass. As for the 2d-KA system, we have again deliberately chosen suboptimal parameters for the vapor deposited glass at , using a deposition rate that is about one order of magnitude faster than that for all other polymer systems considered here. It is only with this very fast deposition rate that we arrive at an inherent structure energy that is sufficiently high to be attainable by simple aging of an ordinary glass.
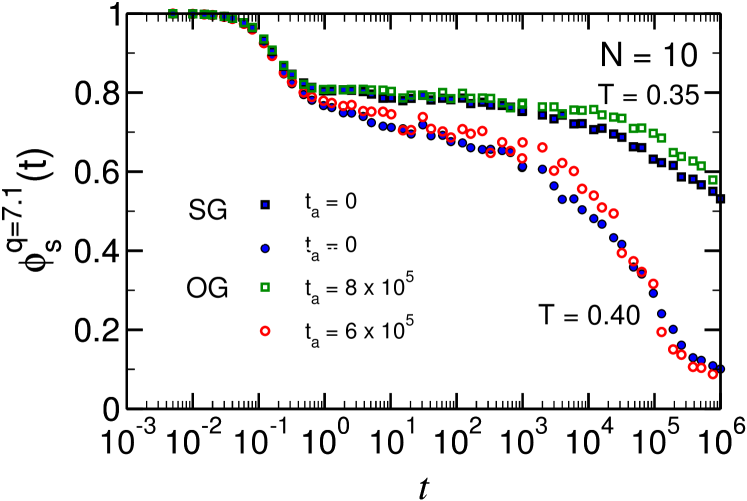
The results for the ISF are displayed in Fig. 8. We find that the ISFs of the vapor deposited glass and the ordinary glass are essentially identical, given the fact that they exhibit the same inherent structure energy. It is important to emphasize that this does not imply that the systems are in the same state. In fact, given the structural differences, we expect them to exhibit different mechanic and thermodynamic properties, and it would not be surprising if they displayed a different aging behavior. However, our results suggest that the inherent structure energy is a good indicator to gauge the local dynamics. Thus, we infer that it is also a good measure of the stability of the glass. Furthermore, this finding can also be interpreted in terms of the potential energy landscape. The similar dynamics of the systems, despite their different structures, suggests that they are not only in a potential that has the same depth (i.e. the same inherent structure energy), but also that the potential energy barriers surrounding them have similar heights, leading to similar dynamics. This, surprisingly, appears to hold even though pronounced structural differences indicate that the systems are in very different areas of the potential energy landscape. In other words, one could also argue that in deep energy minima, a different structure does not necessarily imply that the potential energy landscape exhibits a considerably different shape.
4 Conclusions
In this paper, we have demonstrated that the increased thermodynamic stability of simulated vapor deposited glasses is also manifest in the microscopic dynamics, as measured by the incoherent intermediate scattering function. These dynamics resemble closely those observed in ordinary glasses aged for long periods of time or liquid-cooled materials prepared at slow cooling rates. This may not come as a surprise. Indeed, vapor deposited glasses have been frequently compared to glasses aged for long times [19, 10]. Note, however, it is not immediately obvious that vapor deposited and well-aged glasses should exhibit identical dynamics. Indeed, a contrasting hypothesis would be that a vapor deposition process puts the glass in a “stable state” that is not accessible via liquid cooling, from which the system would transform back into an ordinary glass. In fact, experiments suggest that some organic molecules are indeed deposited in a “hidden amorphous state” not accessible via liquid cooling [25]. However, the results presented here show no evidence for such states, neither for a bead-spring polymer model, where chains remain in an anisotropic state, nor for a binary mixture which is, by construction, fully isotropic. We have compared the ISFs of vapor-deposited glasses to those of ordinary glasses either aged for various times or cooled at different cooling rates. We find that the dynamics of ordinary glasses gradually approach those of a vapor deposited glass for longer aging times and slower cooling rates. Here we note that vapor deposition represents a very different and efficient process for preparation of well-equilibrated glasses, both in experiments and in numerical simulations. Finally, we also compared vapor deposited glasses and ordinary glasses where either the cooling rate or the aging time were adjusted such that their final states would have the same inherent structure energy. We found that these systems display the same dynamics, even when comparing a highly anisotropic vapor deposited polymer film to a structurally different, isotropic, liquid-cooled one. This finding supports the assumption that the inherent structure energy is a good measure of the stability of a glass.
Acknowledgements
We gratefully acknowledge insightful discussions with Mark Ediger. JH acknowledges the financial support from the DFG research fellowship program, grant No. HE 7429/1. This work is supported by the National Science Foundation under a DMREF grant.
References
- [1] L. Berthier and G. Biroli. Theoretical perspective on the glass transition and amorphous materials. Rev. Mod. Phys., 83:587, 2011.
- [2] M. D. Ediger and P. Harrowell. Perspective: Supercooled liquids and glasses. J. Chem. Phys., 137:080901, 2012.
- [3] G. Biroli and J. P. Garrahan. Perspective: The glass transition. J. Chem. Phys., 138:12A301, 2013.
- [4] E.-J. Donth. The Glass Transition. Springer-Verlag, 2001.
- [5] K. Binder and W. Kob. Glassy Materials and Disordered Solids. World Scientific Publishing, 2011.
- [6] L. C. E. Struik. Physical aging in amorphous polymers and other materials. Elsevier, 1978.
- [7] S. F. Swallen, K. L. Kearns, M. K. Mapes, Y. S. Kim, R. J. McMahon, M. D. Ediger, T. Wu, L. Yu, and S. Satija. Organic glasses with exceptional thermodynamic and kinetic stability. Science, 315:353, 2007.
- [8] K. Ishii and H. Nakayama. Structural relaxation of vapor-deposited molecular glasses and supercooled liquids. Phys. Chem. Chem. Phys., 16:12073, 2014.
- [9] S. S. Dalal and M. D. Ediger. Molecular orientation in stable glasses of indomethacin. J. Phys. Chem. Lett., 3:1229, 2012.
- [10] K. L. Kearns, S. F. Swallen, M. D. Ediger, T. Wu, Y. Sun, and L. Yu. Hiking down the energy landscape: Progress toward the kautzmann temperature via vapor deposition. J. Phys. Chem. B, 112:4934, 2008.
- [11] K. L. Kearns, S. F. Swallen, M. D. Ediger, Y. Sun, and L. Yu. Calorimetric evidence for two distinct molecular packing arrangements in stable glasses of indomethacin. J. Phys. Chem. B, 113:1579, 2009.
- [12] E. León-Gutierrez, G. Garcia, M. T. Clavaguera-Mora, and J. Rodríguez-Viejo. Glass transition in vapor deposited thin films of toluene. Thermochim. Acta, 492:51, 2009.
- [13] K. Dawson, L. Zhu, L. A. Kopff, R. J. McMahon, L. Yu, and M. D. Ediger. Highly stable vapor-deposited glasses of four tris-naphthylbenzene isomers. J. Phys. Chem. Lett., 2:2683, 2011.
- [14] S. Singh and J. J. de Pablo. A molecular view of vapor deposited glasses. J. Chem. Phys., 134:194903, 2011.
- [15] S. Singh, M. D. Ediger, and J. J. de Pablo. Ultrastable glasses from in silico vapour deposition. Nature Materials, 12:139, 2013.
- [16] I. Lyubimov, M. D. Ediger, and J. J. de Pablo. Model vapor-deposited glasses: Growth front and composition effects. J. Chem. Phys., 139:144505, 2013.
- [17] P.-H. Lin, I. Lyubimov, L. Yu, M. D. Ediger, and J. de Pablo. Molecular modeling of vapor-deposited polymer glasses. J. Chem. Phys., 140:204504, 2014.
- [18] I. Lyubimov, L. Antony, D. M. Walters, D. Rodney, M. D. Ediger, and J. J. de Pablo. Orientational anisotropy in simulated vapor-deposited molecular glasses. J. Chem. Phys., 143:094502, 2015.
- [19] K. L. Kearns, S. F. Swallen, M. D. Ediger, T. Wu, and L. Yu. Influence of substrate temperature on the stability of glasses prepared by vapor deposition. J. Chem. Phys., 127:154702, 2007.
- [20] K. R. Whitaker, D. J. Scifo, M. D. Ediger, M. Ahrenberg, and C. Schick. Highly stable glasses of cis-decalin and cis/trans-decalin mixtures. J. Phys. Chem. B, 117:12724, 2013.
- [21] Z. Chen, A. Sepulveda, M. D. Ediger, and R. Richert. Dynamics of glass-forming liquids. xvi. observation of ultrastable glass transformation via dielectric spectroscopy. J. Chem. Phys., 138:12A519, 2013.
- [22] A. Sepulveda, S. F. Swallen, and M. D. Ediger. Manipulating the properties of stable organic glasses using kinetic facilitation. J. Chem. Phys., 138:12A517, 2013.
- [23] A. Sepulveda, M. Tylinski, A. Guiseppi-Elie, R. Richert, and M. D. Ediger. Role of fragility in the formation of highly stable organic glasses. Phys. Rev. Lett., 113:045901, 2014.
- [24] H. B. Yu, M. Tylinski, A. Guiseppi-Elie, M. D. Ediger, and R. Richert. Suppression of -relaxation in vapor-deposited ultrastable glasses. Phys. Rev. Lett., 115:185501, 2015.
- [25] K. J. Dawson, K. L. Kearns, L. Yu, W. Steffen, and M. D. Ediger. Physical vapor deposition as a route to hidden amorphous states. Proc. Natl. Acad. Sci. USA, 106:15165, 2009.
- [26] D. Reid. Age and structure of a model vapor-deposited glass. Submitted to Nature Communications, 2016.
- [27] R. Brüning, D. A. St-Onge, S. Patterson, and W. Kob. Glass transitions in one-, two-, three-, and four-dimensional binary lennard-jones systems. J. Phys. Condens. Matter, 21:035117, 2009.
- [28] R. Everaers, S. K. Sukumaran, G. S. Grest, C. Svaneborg, A. Sivasubramanian, and K. Kremer. Rheology and microscopic topology of entangled polymeric liquids. Science, 303:823, 2004.
- [29] G. S. Grest and M. Murat. Computer simulations of tethered chains. In Monte Carlo and Molecular Dynamics Simulations in Polymer Science. Oxford University Press, 1995.
- [30] E. Bitzek, Koskinen. P., F. Gähler, M. Moseler, and P. Gumbsch. Structural relaxation made simple. Phys. Rev. Lett., 97:170201, 2006.
- [31] W. Shinoda, M. Shiga, and M. Mikami. Rapid estimation of elastic constants by molecular dynamics simulation under constant stress. Phys. Rev. B, 69:134103, 2004.
- [32] D. Frenkel and B. Smit. Understanding Molecular Simulation. Academic Press, 2002.
- [33] K. Dawson, L. A. Kopff, L. Zhu, R. J. McMahon, L. Yu, R. Richert, and M. D. Ediger. Molecular packing in highly stable glasses of vapor-deposited tris-naphthylbenzene isomers. J. Chem. Phys., 136:094505, 2012.
- [34] D. Bhattacharya and V. Sadtchenko. Enthalpy and high temperature relaxation kinetics of stable vapor-deposited glasses of toluene. J. Chem. Phys., 141:094502, 2014.