Detection of a turbulent gas component associated with a starless core with subthermal turbulence in the Orion A cloud
Abstract
We report the detection of a wing component in NH3 emission toward the starless core TUKH122 with subthermal turbulence in the Orion A cloud. This NH3 core is suggested to be on the verge of star formation because the turbulence inside the NH3 core is almost completely dissipated, and also because it is surrounded by CCS, which resembles the prestellar core L1544 in Taurus showing infall motions. Observations were carried out with the Nobeyama 45 m telescope at 0.05 km s-1 velocity resolution. We find that the NH3 line profile consists of two components. The quiescent main component has a small linewidth of 0.3 km s-1 dominated by thermal motions, and the red-shifted wing component has a large linewidth of 1.36 km s-1 representing turbulent motions. These components show kinetic temperatures of 11 K and 30 K, respectively. Furthermore, there is a clear velocity offset between the NH3 quiescent gas ( km s-1) and the turbulent gas ( km s-1). The centroid velocity of the turbulent gas corresponds to that of the surrounding gas traced by the 13CO () and CS () lines. LVG model calculations for CS and CO show that the turbulent gas has a temperature of K and an H2 density of cm-3, suggesting that the temperature of the turbulent component is also 10 K. The detections of both NH3 quiescent and wing components may indicate a sharp transition from the turbulent parent cloud to the quiescent dense core.
keywords:
ISM: individual (Orion Nebula, Orion Molecular Cloud) —ISM: molecules —ISM: structure—stars: formation1 Introduction
“Giant molecular clouds (GMCs)” are well known to be major sites of star formation in our Galaxy, and often show star cluster formation including massive stars (e.g., Shu et al., 1987). Molecular line observations of GMCs reveal that the observed linewidths are much larger than thermal linewidths and GMCs are known to contain supersonic turbulent motions (e.g., Larson, 1981; Solomon et al., 1987). “Molecular clouds cores” or “dense cores” having sizes of the order of 0.1 pc have been identified in GMCs and are thought to be birth places of stars (e.g., Myers & Benson, 1983; Beichman et al., 1986; Lada et al., 1991). The turbulent motions still remain even in these dense cores and support the dense cores against gravitational collapse. It has been suggested that the dissipation of turbulence can initiate the star formation process in turbulent cores (Nakano, 1998; Myers & Lazarian, 1998). However, it is poorly understood how turbulence is dissipated within cores and whether cores dissipate turbulence partially or completely before star formation. To investigate star formation within turbulent cores, it is essential to observationally characterize them in the turbulent environments where most stars are born.
We focus our study on dense cores located in the Orion A cloud, one of the nearest and best studied GMCs. The distance to the Orion A cloud is estimated to be 418 pc (Kim et al., 2008). At this distance, 1 arcmin corresponds to 0.12 pc. The whole structure of the Orion A cloud is filamentary and contains “-shaped filament” in the northern region (Bally et al., 1987; Johnstone & Bally, 1999). The carried out a large survey of the Orion A cloud with and instruments and provided a young stellar object (YSO) catalog (Megeath et al., 2012). Recently, the carried out an extensive imaging survey toward the Orion A cloud with at m and at m. Stutz & Kainulainen (2015) analyzed column density probability distribution function (N-PDF) and suggested that the N-PDF power-law index is associated with the evolutionary state of the gas. These high sensitivity and large imaging surveys provide us with information on the physical condition of prestellar cores (e.g., Polychroni et al., 2013). To investigate the dynamical conditions of prestellar cores, molecular line observations are crucial. Wide field molecular line observations have been carried out toward the Orion A cloud using CO, 13CO, C18O (), CS (), NH3 and , N2H+ (), and others (Maddalena et al., 1986; Cesaroni & Wilson, 1994; Ikeda et al., 2007; Buckle et al., 2012; Shimajiri et al., 2015; Tatematsu et al., 1993, 2008).
Tatematsu et al. (1993) identified 125 molecular cloud cores in CS () emission and cataloged their positions (here we use the prefix of TUKH for their core numbers). Subsequently, Tatematsu et al. (2010) made one-pointing observations toward more than 60 cores in the Orion A cloud in CCS, HC3N, N2H+ and other lines. They detected CCS emission for the first time in the Orion A cloud. The carbon-chain molecules of CCS and HC3N are thought to be tracers of chemically young molecular gas, while N-bearing molecules of N2H+ and NH3 are thought to be tracers of evolved gas in nearby cold dark clouds (e.g., Suzuki et al., 1992; Benson et al., 1998; Hirota et al., 2002). Tatematsu et al. (2014a) mapped N2H+ () and CCS () toward six cores in the Orion A cloud with the Nobeyama 45 m telescope and confirmed that the N2H+/CCS column density ratio can be used as a chemical evolution tracer even in the Orion A cloud. Similarly, Ohashi et al. (2014) found that the NH3/CCS column density ratio is anti-correlated with the CCS linewidth, and suggested that chemical evolution and turbulence dissipation can be indicators of the dynamical evolution of cores. Among these cores, the prestellar core TUKH122 seems to be the closest to form stars because the N2H+/CCS column density ratio is the largest value among the starless cores. Tatematsu et al. (2014b) observed the NH3 () and CCS () emission lines toward the TUKH122 core with the Very Large Array (VLA) and revealed narrow NH3 line profiles ( 0.2 km s-1), in contrast to the broader previous observed CS () line profiles ( 0.8 km s-1). They also found that an NH3 oval structure (core) is surrounded by CCS emission. This configuration is quite similar to that of the starless cores L1544 and L1498 in Taurus (Aikawa et al., 2001; Lai & Crutcher, 2000). The prestellar core L1544 displays infall motions (Tafalla et al., 1998), which means that NH3 cores surrounded by CCS emission might indicate that these cores are chemically evolved and on the verge of the star formation.
Here, we report new single-pointing observations of the NH3 () () and () emission lines toward the TUKH122 core at 0.05 km s-1 velocity resolution using the Nobeyama 45 m telescope in order to investigate the kinematics and the physical conditions of the core. Measurements of the NH3 inversion lines are ideal for temperature of dense gas (Ho & Townes, 1983).
2 Observations
Single-pointing observation was carried out with the Nobeyama 45 m telescope on 2015 March 4. At 23 GHz, the half-power beam width (HPBW) and main beam efficiency () of the telescope were 73 and 0.825, respectively. The observations were perfomred in the position switch mode. For the receiver front end, we employed the 20 GHz HEMT receiver (H22). For the back end, we used the SAM45 digital spectrometer with a spectral resolution of 3.81 kHz (0.05 km s-1 at 23 GHz) and a bandwidth of 16 MHz. The NH3 () and () lines were simultaneously observed. We used rest frequencies of 23.69449 and 23.72263 GHz for NH3 () and (), respectively (Kukolich, 1967). The system noise temperatures ranged from 90 to 96 K. The standard chopper wheel method was used, and the intensity is reported in terms of the main-beam temperature , which is obtained by dividing the antenna temperature by the main beam efficiency. The on-source integration time was 52 min, resulting in an rms noise level of 37 mK in for the NH3 observations in the dual polarization mode, and 51 mK in for the NH3 observations in the single polarization mode. The telescope pointing was checked at the beginning of the observation by observing the SiO maser source Orion KL and was better than 10.
3 Results and Discussion
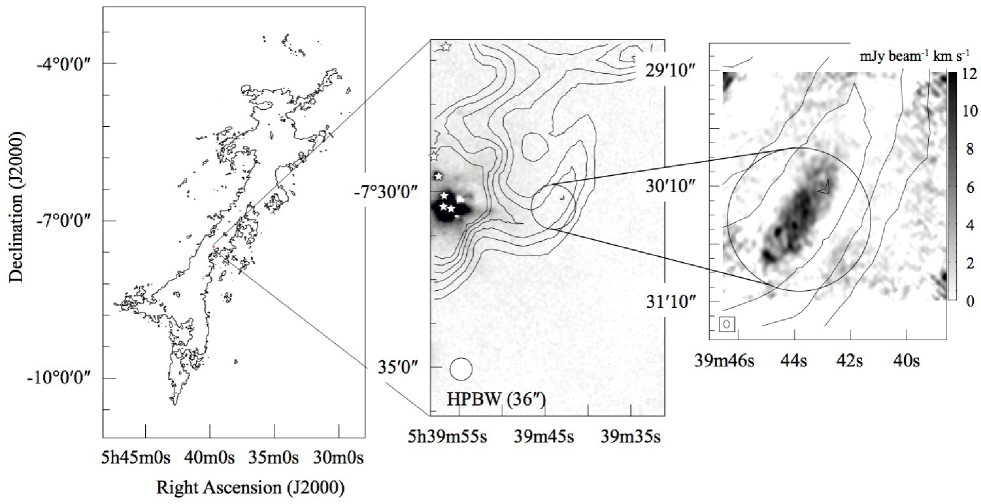
Figure 1 shows the location of TUKH122 on top of 70 m, thermal dust continuum map, and NH3 emission map. The bright 70 m source corresponds to TUKH123, which contains six protostars identified by (Megeath et al., 2012). On the other hand, no 70 m emission was detected toward the TUKH122 core, which is consistent with the fact that the TUKH122 core has no protostars. We can see a filamentary structure elongated from northwest to southeast toward the TUKH122 core (Figure 1). The width of the filament is about 0.1 pc and its length is 0.5 pc. On the NH3 map, an oval structure with embedded condensations is seen toward TUKH 122.
3.1 Hyperfine fitting and derivation of physical parameters
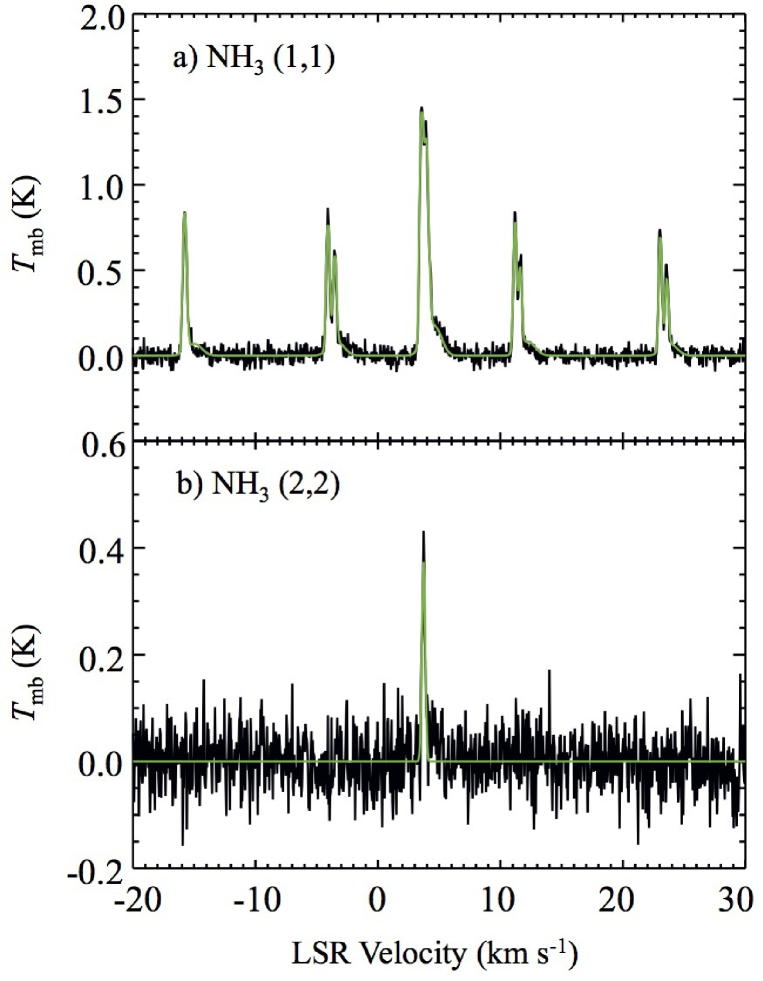
Figure 2 shows the line profile and hyperfine fitting of the NH3 () () and () lines obtained with the Nobeyama 45 m telescope. We identified a total of nine hyperfine components with K in the NH3 () () line. The hyperfine fitting was performed to the NH3 () spectra by using equations:
| (1) |
where
| (2) |
The optical depth is the sum of the centroid optical depths of all the hyperfine components. The background temperature is 2.7 K. is the Planck function in temperature units. The free parameters are the optical depth (), LSR velocity (), linewidth (), and excitation temperature (). We assume a uniform excitation temperature in all NH3 hyperfine components. The intrinsic line strengths () and velocity offsets () of the hyperfine components are adopted from Levshakov et al. (2010). We fit the hyperfine structure with a least-squares Gaussian hyperfine structure fitting routine written in IDL. Fitting is optimized by the use of the Levenberg-Marquardt algorithm (for non-linear fitting). Iterations are performed until the solutions converge.
Because we identified another component (wing component) in the NH3 () () spectrum, we fit a two-velocity-component hyperfine model. The fitting results of the wing emission will be discussed in the following subsection. The fitting results of the quiescent component are: , 0.01 km s-1, km s-1, and K. The NH3 hyperfine components are moderately optically thick. It is found that the core is thermally dominated because the observed linewidth is close to the thermal linewidth (th) , which is 0.16 km s-1 for NH3 at K. Here, is the Boltzmann constant, and is the mass of the molecule.
We performed a single Gaussian fitting to the NH3 () () spectrum because there is only one detected velocity component and hyperfine lines are not detected. The fitting results are: peak intensity of K, centroid velocity of km s-1, and linewidth of km s-1. The optical depth of can be derived from equation (1) assuming that NH3 () () and () transition have the same excitation temperature and a filling factor of unity for both transitions. The rotational temperature of NH3 was derived from the () () and () transitions by following Bachiller et al. (1987) and equation (3)
| (3) |
where is the optical depth of the main hyperfine component group (). Following Mangum et al. (1992) and Mangum & Shirley (2015), the column density was derived as
| (4) |
The total column density was obtained by using
| (5) |
From these equations, we derived a rotation temperature of K and cm-2. In order to estimate the kinetic temperature , we used the relations derived by Tafalla et al. (2004)
| (6) |
The kinetic temperature is derived to be K. The value of K is consistent with the fact that there is no heating source in this core. We also investigate how the filling factor affects equation (1). If the filling factor is 0.5, the kinetic temperature and the column density are derived to be 11 K and cm-2, respectively. The kinetic temperature is not significantly affected by the filling factor because it is derived from the intensity ratio of NH3 ) () and emission. Again, we assume that both transitions have the same filling factor.
3.2 Wing emission
In addition to the narrow linewidth component of km s-1, we identified a red-shifted wing component in the NH3 spectrum for the first time for this source (see Figures 2 a and 3).
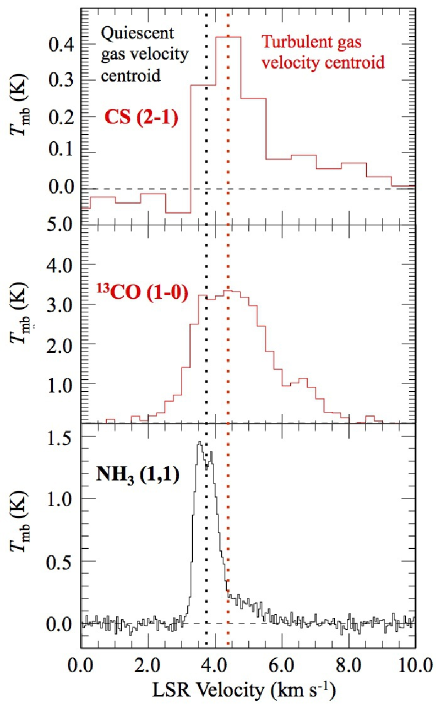
To analyze the wing emission, we performed the hyperfine fitting including the quiescent main component and the wing component, simultaneously. The fitting results of the wing component are: , 0.02 km s-1, km s-1, and K, suggesting that the wing emission is turbulent. Because we were unable to detect a counterpart in the NH3 () ) emission, we estimated the upper limit to the kinetic temperature to be 30 K assuming the 3 upper limit of the NH3 () ) emission. The centroid velocity of NH3 quiescent gas is 3.7 km s-1, while that of the wing/high velocity gas is 4.4 km s-1. The velocity offset is about 0.7 km s-1, more than twice the linewidth of the quiescent component. In Figure 3, we show the CS (), 13CO (), and NH3 () line profiles toward TUKH122. The 13CO () and CS () lines are convolved with a Gaussian kernel to match the beam size of the NH3 observations (73). These lines were observed by Tatematsu et al. (1993, 1998, 2014a). We find that the 13CO () and CS () emission lines are dominated by turbulent motions and their velocity centroids are consistent with that of the NH3 turbulent gas rather than that of the NH3 quiescent gas within the uncertainties (see also table 1). A rest frequency of 110.201353 GHz was used for 13CO () (Ulich et al., 1976).
| molecular lines | ||||
|---|---|---|---|---|
| (km s-1) | (km s-1) | (K) | ||
| NH3 () main | 8.40.1 | 3.740.01 | 0.30 | 4.140.05 |
| NH3 () wing | 3.230.03 | 4.400.02 | 1.36 | 2.90.1 |
| CS () | 4.370.33 | 1.7 | ||
| 13CO () | 4.510.09 | 2.6 |
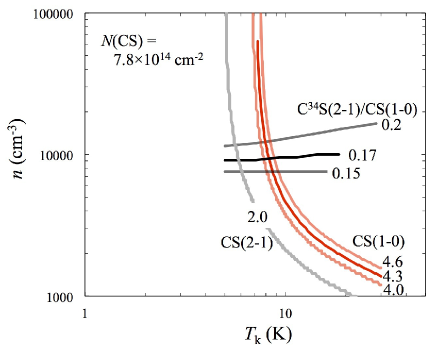
In addition to the upper limit to the kinetic temperature of the turbulent gas explained above, we tried to obtain the temperature by another method. We make LVG calculations (e.g., Scoville & Solomon, 1974; Goldreich & Kwan, 1974) for the multitransition CS , CS( and C34S data to derive the kinetic temperature of the turbulent gas. LVG analysis was made by using the RADEX software (van der Tak et al., 2007). The collision rates for CS are taken from Lique et al. (2006). We assume that the CS lines are emitted from similar volumes and they are from a uniform density sphere.
In LVG calculations, we investigate the parameter range of cm-3 and K. We use a column density of (CS) cm-2, obtained from CS by assuming LTE condition, and a linewidth of 0.56 km s-1. The formulation can be found, for example, in Lee et al. (2013). We assume the abundance ratio of to be 15 (Blake et al., 1987). We use a CS () intensity of 4.3, a C34S ()/CS() intensity ratio of 0.17, and a CS () intensity of 0.7 toward the peak position of TUKH122. Figure 4 shows the results and the derived values are listed in Table 2. Temperature is significantly low ( 10 K) even taking into account the uncertainties of the intensities. The observed CS intensity is generally weaker than the value determined by the model. This has been already pointed out by Tatematsu et al. (1998). They suggested that foreground absorption due to less dense gas is significant for . Nishimura et al. (2015) also performed LVG analysis using CO , CO , 13CO ), and 13CO lines and derived a kinematic temperature of 13 K toward TUKH122. Therefore, we conclude that the turbulent gas is also cold ( 10 K).
| model | (CS) | Min | ||
|---|---|---|---|---|
| (cm-3) | (K) | (cm-2) | ||
| fitting range | 7.8 | |||
| results | 8.7 | 8 | 7.8 | 0.0002 |
It is worth noting that our previous results of NH3 observations with the VLA (Tatematsu et al., 2014b) have shown no wing emission toward the core. The VLA observations were carried out using NH3 () () emission with 0.2 km s-1 velocity resolution (Figure 7 in Tatematsu et al. 2014b). From the observed intensity of the wing emission in the present study ( 0.22 K), the flux density is estimated to be 1.31 mJy beam-1 at the VLA configuration of 42 31 resolution. The wing component were not detected with the VLA because the rms noise level of the VLA observations was as high as 2.6 mJy beam-1. Therefore, the non-detection of the wing component with the VLA will be due to lower sensitivity. Another possibility is that the turbulent gas is widely extended and resolved out in the interferometric observations.
3.3 The linewidth-size relations
The linewidth-size relation has been investigated in many studies (e.g., Larson, 1981; Caselli & Myers, 1995; Goodman et al., 1998). It is suggested that the coefficient or intercept (in the log-log form) of the linewidth-size relation in GMC turbulent cores is larger than in low-mass star-forming regions, which means GMC cores have a higher level of turbulence (Tatematsu et al., 1993; Caselli & Myers, 1995; Ballesteros-Paredes et al., 2011; Heyer et al., 2009). Lu et al. (2014) investigated the linewidth-size relation in high-mass star-forming regions in NH3 emission using the VLA. Their results suggest that high-mass star-forming cores still have high level of turbulence within 0.1 pc.
We estimate the nonthermal linewidth , which is defined as , where and is the mass of the observed molecules (Fuller & Myers, 1992). We assume 11 K, which was obtained from the NH3 inversion transition observations, for all molecular lines. The thermal linewidth for NH3 and mean molecular weight (2.33 u) are 0.17 km s-1 and 0.47 km s-1, respectively.
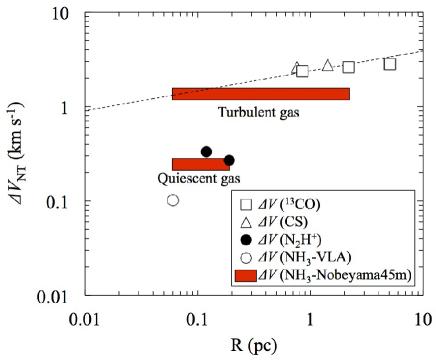
Figure 5 shows the nonthermal linewidth against the core radius in TUKH122 observed in several molecular lines; 13CO (), CS (), NH3 () ), and N2H+ (). The (equivalent) core radius is calculated from the area inside the 25%, 50%, and 75% levels with respect to the maximum intensities of these molecular lines. That is the core radius can be represented
| (7) |
We derived the observed linewidth, , from the average spectrum from positions within the contours. We omit the plot of (75%) for CS and N2H+ because (75%) for CS and N2H+ is similar to the telescope beam area and the contour is not fully resolved. Our NH3 single dish observations cannot constrain the radius. Therefore, we use the horizontal bar to illustrate the probable radius range of the NH3 quiescent core. The NH3 quiescent core was observed with VLA, but it was found that diffuse emission was resolved out. It is possible that the NH3 quiescent core is as large as the N2H+ quiescent, if N2H+ and NH3 coexist. We also use the horizontal bar for the NH3 turbulent core radius. The NH3 turbulent gas distribution can be as small as the NH3 quiescent core observed with VLA, while it can be widespread as observed in CS and 13CO with the Nobeyama 45 m telescope. The dashed line represents a power law index of 0.21 derived by Caselli & Myers (1995) in Orion cores. We find that the nonthermal component in TUKH122 follows the trend in the Orion cores if the core radius is larger than 0.2 pc. We also find that turbulence is dissipated within 0.2 pc, and the nonthermal linewidth becomes smaller than the thermal linewidth (0.47 km s-1) for the mean molecular weight. Our new results with high velocity resolution confirm that the nonthermal motion is almost completely dissipated. This may be the first evidence of a coherent region in a GMC core.
The nonthermal linewidth of the NH3 wing component is derived to be 1.36 km s-1, which is consistent with the trend of the linewidth-size relation derived for CS and 13CO turbulent gas. Furthermore, the centroid velocity of the NH3 wing component of 4.7 km s-1 corresponds to that of CS and 13CO lines. Therefore, the NH3 wing component should also trace the turbulent surrounding gas. We have observed dense turbulent gas and quiescent dense gas in a single tracer. Our detection of both NH3 quiescent and wing components may indicate a sharp transition from the turbulent parent cloud to the quiescent high dense core.
Similar objects that have a sharp transition between turbulent surrounding gas and a coherent core have been reported by Pineda et al. (2010, 2011). However, it is still not clear how these coherent cores are formed in such turbulent environments. Some models suggest that shocks may dissipate the turbulence (Pon et al., 2012). Recently, hydrodynamic turbulent cloud simulations show the filament formation made up of a network smaller and coherent sub-filaments (Smith et al., 2016). They found that sub-filaments are formed at the stagnation points of the turbulent velocity fields where shocks dissipate the turbulence. Our results of the velocity offsets between the quiescent dense core and its parent cloud may be consistent with such simulations and TUKH122 core might be formed at the stagnation point.
4 Conclusion
We observed NH3 () ) and () lines toward the quiescent starless core TUKH122 with the Nobeyama 45 m telescope. We found that the NH3 () ) line profile consists of not only a quiescent component ( 0.30 km s-1) but also a wing turbulent component ( 1.36 km s-1). Analyzing the NH3 () ) and () lines, we derived kinetic temperatures of 11 K and 30 K for the quiescent and turbulent components, respectively. Taking into account the fact that the turbulence is rapidly dissipated within a 0.2 pc region, this core may have a coherent region. This is the first detection of such an object in the GMC. There is a clear offset between the centroid velocity of NH3 quiescent gas ( km s-1) and that of the turbulent gas ( km s-1). The centroid velocity of the turbulent gas, rather than the quiescent one, corresponds to that of the surrounding gas traced by the 13CO () and CS () lines. Our results from the NH3 high velocity resolution observations may indicate a sharp transition from the turbulent parent cloud to the quiescent high dense core.
Acknowledgments
We appreciate the anonymous referee for the very helpful comments to improve this paper. We are grateful to the staff of Nobeyama Radio Observatory. Nobeyama Radio Observatory is a branch of the National Astronomical Observatory of Japan, National Institutes of Natural Sciences. Data analysis were carried out on common use data analysis computer system at the Astronomy Data Center, ADC, of the National Astronomical Observatory of Japan.
References
- Aikawa et al. (2001) Aikawa, Y., Ohashi, N., Inutsuka, S.-i., Herbst, E., & Takakuwa, S. 2001, ApJ, 552, 639
- Bachiller et al. (1987) Bachiller, R., Guilloteau, S., & Kahane, C. 1987, A&A, 173, 324
- Ballesteros-Paredes et al. (2011) Ballesteros-Paredes, J., Hartmann, L. W., Vázquez-Semadeni, E., Heitsch, F., & Zamora-Avilés, M. A. 2011, MNRAS, 411, 65
- Bally et al. (1987) Bally, J., Langer, W. D., Stark, A. A., & Wilson, R. W. 1987, ApJ, 312, L45
- Beichman et al. (1986) Beichman, C. A., Myers, P. C., Emerson, J. P., et al. 1986, ApJ, 307, 337
- Benson et al. (1998) Benson, P. J., Caselli, P., & Myers, P. C. 1998, ApJ, 506, 743
- Blake et al. (1987) Blake, G. A., Sutton, E. C., Masson, C. R., & Phillips, T. G. 1987, ApJ, 315, 621
- Buckle et al. (2012) Buckle, J. V., Davis, C. J., Francesco, J. D., et al. 2012, MNRAS, 422, 521
- Caselli & Myers (1995) Caselli, P., & Myers, P. C. 1995, ApJ, 446, 665
- Cesaroni & Wilson (1994) Cesaroni, R., & Wilson, T. L. 1994, A&A, 281, 209
- Fuller & Myers (1992) Fuller, G. A., & Myers, P. C. 1992, ApJ, 384, 523
- Goldreich & Kwan (1974) Goldreich, P., & Kwan, J. 1974, ApJ, 189, 441
- Goodman et al. (1998) Goodman, A. A., Barranco, J. A., Wilner, D. J., & Heyer, M. H. 1998, ApJ, 504, 223
- Harju et al. (1993) Harju, J., Walmsley, C. M., & Wouterloot, J. G. A. 1993, A&AS, 98, 51
- Heyer et al. (2009) Heyer, M., Krawczyk, C., Duval, J., & Jackson, J. M. 2009, ApJ, 699, 1092
- Hirota et al. (2002) Hirota, T., Ito, T., & Yamamoto, S. 2002, ApJ, 565, 359
- Ho & Townes (1983) Ho, P. T. P., & Townes, C. H. 1983, ARA&A, 21, 239
- Ikeda et al. (2007) Ikeda, N., Sunada, K., & Kitamura, Y. 2007, ApJ, 665, 1194
- Johnstone & Bally (1999) Johnstone, D., & Bally, J. 1999, ApJ, 510, L49
- Kim et al. (2008) Kim, M.K., et al. 2008, PASJ, 60, 991
- Kukolich (1967) Kukolich, S. G. 1967, Phys. Rev., 156, 83
- Lada et al. (1991) Lada, E. A., Depoy, D. L., Evans, N. J., II, & Gatley, I. 1991, ApJ, 371, 171
- Lai & Crutcher (2000) Lai, S.-P., & Crutcher, R. M. 2000, ApJS, 128, 271
- Larson (1981) Larson, R. B. 1981, MNRAS, 194, 809
- Lee et al. (2013) Lee, K., Looney, L. W., Schnee, S., & Li, Z.-Y. 2013, ApJ, 772, 100
- Levshakov et al. (2010) Levshakov, S. A., Molaro, P., Lapinov, A. V., et al. 2010, A&A, 512, A44
- Lique et al. (2006) Lique, F., Spielfiedel, A., & Cernicharo, J. 2006, A&A, 451, 1125
- Lu et al. (2014) Lu, X., Zhang, Q., Liu, H. B., Wang, J., & Gu, Q. 2014, ApJ, 790, 84
- MacLaren et al. (1988) MacLaren, I., Richardson, K. M., & Wolfendale, A. W. 1988, ApJ, 333, 821
- Maddalena et al. (1986) Maddalena, R. J., Morris, M., Moscowitz, J., & Thaddeus, P. 1986, ApJ, 303, 375
- Mangum et al. (1992) Mangum, J. G., Wootten, A., & Mundy, L. G. 1992, ApJ, 388, 467
- Mangum & Shirley (2015) Mangum, J. G., & Shirley, Y. L. 2015, PASP, 127, 266
- Megeath et al. (2012) Megeath, S.T., et al. 2012, AJ, 144, 192
- Myers & Benson (1983) Myers, P. C., & Benson, P. J. 1983, ApJ, 266, 309
- Myers & Lazarian (1998) Myers, P. C., & Lazarian, A. 1998, ApJ, 507, L157
- Nakano (1998) Nakano, T. 1998, ApJ, 494, 587
- Nishimura et al. (2015) Nishimura, A., Tokuda, K., Kimura, K., et al. 2015, ApJS, 216, 18
- Ohashi et al. (2014) Ohashi, S., Tatematsu, K., Choi, M., et al. 2014, PASJ, 66, 119
- Pineda et al. (2010) Pineda, J. E., Goodman, A. A., Arce, H. G., et al. 2010, ApJ, 712, L116
- Pineda et al. (2011) Pineda, J. E., Goodman, A. A., Arce, H. G., et al. 2011, ApJ, 739, L2
- Polychroni et al. (2013) Polychroni, D., Schisano, E., Elia, D., et al. 2013, ApJ, 777, L33
- Pon et al. (2012) Pon, A., Johnstone, D., & Kaufman, M. J. 2012, ApJ, 748, 25
- Scoville & Solomon (1974) Scoville, N. Z., & Solomon, P. M. 1974, ApJ, 187, L67
- Shimajiri et al. (2015) Shimajiri, Y., Kitamura, Y., Nakamura, F., et al. 2015, ApJS, 217, 7
- Shu et al. (1987) Shu, F. H., Adams, F. C., & Lizano, S. 1987, ARA&A, 25, 23
- Smith et al. (2016) Smith, R. J., Glover, S. C. O., Klessen, R. S., & Fuller, G. A. 2016, MNRAS, 455, 3640
- Solomon et al. (1987) Solomon, P. M., Rivolo, A. R., Barrett, J., & Yahil, A. 1987, ApJ, 319, 730
- Stutz & Kainulainen (2015) Stutz, A. M., & Kainulainen, J. 2015, A&A, 577, L6
- Suzuki et al. (1992) Suzuki, H., Yamamoto, S., Ohishi, M., et al. 1992, ApJ, 392, 551
- Tafalla et al. (1998) Tafalla, M., Mardones, D., Myers, P. C., et al. 1998, ApJ, 504, 900
- Tafalla et al. (2004) Tafalla, M., Myers, P. C., Caselli, P., & Walmsley, C. M. 2004, A&A, 416, 191
- Tatematsu et al. (1993) Tatematsu, K., Umemoto, T., Kameya, O., et al. 1993, ApJ, 404, 643
- Tatematsu et al. (1998) Tatematsu, K., Umemoto, T., Heyer, M. H., et al. 1998, ApJS, 118, 517
- Tatematsu et al. (2008) Tatematsu, K., Kandori, R., Umemoto, T., & Sekimoto, Y. 2008, PASJ, 60, 407
- Tatematsu et al. (2010) Tatematsu, K., Hirota, T., Kandori, R., & Umemoto, T. 2010, PASJ, 62, 1473
- Tatematsu et al. (2014a) Tatematsu, K., Ohashi, S., Umemoto, T., et al. 2014a, PASJ, 66, 16
- Tatematsu et al. (2014b) Tatematsu, K., Hirota, T., Ohashi, S., et al. 2014b, ApJ, 789, 83
- Turner et al. (1973) Turner, B.E., et al. 1973 ApJ 186, 123
- Ulich et al. (1976) Ulich, B.L. Haas, R.W., 1976, ApJS 30, 247
- van der Tak et al. (2007) van der Tak, F. F. S., Black, J. H., Schöier, F. L., Jansen, D. J., & van Dishoeck, E. F. 2007, A&A, 468, 627
- Wilson et al. (1999) Wilson, T. L., Mauersberger, R., Gensheimer, P. D., Muders, D., & Bieging, J. H. 1999, ApJ, 525, 343