The Extreme Ultraviolet Spectra of Low Redshift Radio Loud Quasars
Abstract
This paper reports on the extreme ultraviolet (EUV) spectrum of three low redshift () radio loud quasars, 3C 95, 3C 57 and PKS 0405-123. The spectra were obtained with the Cosmic Origins Spectrograph (COS) of the Hubble Space Telescope. The bolometric thermal emission, , associated with the accretion flow is a large fraction of the Eddington limit for all of these sources. We estimate the long term time averaged jet power, , for the three sources. , is shown to lie along the correlation of and found in previous studies of the EUV continuum of intermediate and high redshift quasars, where the EUV continuum flux density between 1100 Å and 700 Å is defined by . The high Eddington ratios of the three quasars extends the analysis into a wider parameter space. Selecting quasars with high Eddington ratios has accentuated the statistical significance of the partial correlation analysis of the data. Namely. the correlation of and is fundamental and the correlation of and is spurious at a very high statistical significance level (99.8%). This supports the regulating role of ram pressure of the accretion flow in magnetically arrested accretion models of jet production. In the process of this study, we use multi-frequency and multi-resolution Very Large Array radio observations to determine that one of the bipolar jets in 3C 57 is likely frustrated by galactic gas that keeps the jet from propagating outside the host galaxy.
keywords:
Black hole physics — magnetohydrodynamics (MHD) — galaxies: jets—galaxies: active — accretion, accretion disks1 Introduction
There is mounting evidence that radio jet power is anti-correlated with the extreme ultraviolet (EUV) luminosity in quasars (Punsly, 2014, 2015). In particular, the three quantities, the long term time averaged jet power, , the bolometric thermal emission, , associated with the accretion flow and , the spectral index of the EUV continuum (the EUV continuum flux density is defined as the flux density between 1100 Å and 700 Å where ) are inter-related. A partial correlation analysis indicted that the fundamental correlation is between and (Punsly, 2015). Furthermore, evidence of a real time anti-correlation between the contemporaneous jet power, , and the EUV luminosity was shown over a 40 year period for the distant quasar, 1442+101 (Punsly et al., 2016).
All of these results were developed based on intermediate and high redshift quasars () due to the constraint that the EUV continuum at 700Å is observable with the Hubble Space Telescope (HST) for . We believe that by studying the EUV spectra of very bright quasars in the EUV, we can push this limit a little further to slightly lower redshift. In this paper, we consider three low redshift radio sources at , 3C 57, 3C 95 and PKS 0405-123 111With the Hubble Space Telescope, the shortest wavelength that can be efficiently detected with the Cosmic Origins Spectrograph is . This corresponds to an emitted wavelength of . For , . Typically, in quasar spectra, there is a strong very broad NIV, NeVIII emission line centered at which will obfuscate the continuum unless the blue wing is completely resolved (Shull et al., 2012; Punsly, 2015). Thus, is the extreme limit of our ability to reliably estimate in the range .. These quasars have been selected to be observed in the EUV because they are the most EUV luminous radio loud quasars (RLQs) in the local Universe. This allows us to probe the and relationship at low redshift and high Eddington rate. Fortunately, there are archival high sensitivity Cosmic Origins Spectrograph observations of these three sources. The high EUV luminosity and the high quality spectra allow us to reliably estimate even though the spectral data ends at .
In next section, we present the EUV spectra of the three sources. In Section 4, we derive for these quasars and in Section 5, the results are discussed in terms of the and correlation.


2 The EUV Spectra
In this section, the EUV spectra of the three RLQs are described. All spectra are from the COS spectrograph on HST with the G130M and G160M gratings. The flux density data that are downloaded from MAST are in units of ergs/sec//Å; . The spectral indices of the EUV continuum derived from composite spectra in Telfer et al. (2002); Zheng et al. (1997) were based on . Consequently, the original studies on the EUV continuum of radio loud quasars, Punsly (2014, 2015); Punsly et al. (2016) adopted the same convention and we continue this here for the sake of easy comparison to previous treatments. Hence, our definition of the continuum power law, . The MAST data will gives us the power law fit as . We convert this to the desired form with the formula, .
2.1 3C 95
The quasar 3C 95 is a classic relaxed lobe dominated quasar at a redshift, z = 0.616 that extends more than 500 kpc from end to end (Hutchings et al., 1988; Price et al., 1993). The H profile is very wide with a full width half maximum of the broad component equal to 9030 Å (see Table 1). The details required for an estimate of the central black hole mass are summarized in Table 1. Columns (2) and (3) are the data needed for an estimate of the black hole mass in column (6) using the mass estimator in Vestergaard and Peterson (2006) and the very broad H profile. Columns (4) and (5) provide the data needed for the independent virial mass estimator of Shen and Liu (2012) based on the MgII profile. This result is listed in the last column. The data listed in the first row yields a range of virial central black hole mass estimate of . The quasar was observed on 8/15/2014 with the G160M grating and on 8/20/2014 with the G130M. grating. These data were down loaded from MAST (Mikulski Archive for Space Telescopes). These spectra have never been discussed in the literature previously.
In the top frame of Figure 1 is the EUV spectrum corrected for Galactic extinction using the method of Cardelli et al. (1989) with and the visual extinction from the NASA Extragalactic Database (NED). The plotted wavelength is the quasar rest frame wavelength, , in order to facilitate the identification of the emission lines. The flux density is that which is measured at earth, designated as . From Punsly (2014), the luminosity near the peak of the spectral energy distribution at Å (quasar rest frame wavelength), provides a robust estimator of the bolometric luminosity associated with the thermal accretion flow, ,
| (1) |
Note that his estimator does not include reprocessed radiation in the infrared from distant molecular clouds. This would be double counting the thermal accretion emission that is reprocessed at mid-latitudes (Davis and Laor, 2011). If the molecular clouds were not present, this radiation would be directed away from the line of sight to Earth. However it is reradiated back into the line of sight towards Earth and this combines with the radiation that has a direct line of sight to Earth from the thermal accretion flow. As such, it would skew our estimate of the bolometric luminosity of the thermal accretion flow and needs to be subtracted from the broadband spectral energy distribution. Applying this equation to the spectrum in Figure 1 indicates a very high luminosity, . However, as noted above, is very large, so the Eddington luminosity is large . Even so, the data indicates a relatively high Eddington ratio, .
The G130M raw spectrum was affected by a Lyman limit system just above the Galactic Ly region of contamination, making it difficult to detect. The absorption begins at (Todd Tripp private communication 2016). A correction was made for the depressed emission using a opacity law. The smoothest extension of the continuum to short wavelengths is attained with a maximum flux depression of 30% to 35%. A correction of 35% was used to produce Figure 1. The resulting continuum fit was made with and it is plotted with the red dashed line.
2.2 PKS 0405-123
PKS 0405-123 is a classical triple radio source at a redshift of z = 0.573. It is the most luminous EUV source in this study. It has two strong radio lobes and a bright flat spectrum core. The source is rather compact only 120 kpc from end to end (Hutchings et al., 1996). Thus, the line of sight to the nucleus is likely somewhat more polar than for 3C 95. The FWHM of the broad component of H is 4720 km/s which might be moderated due to a more polar line of sight than in 3C 95. Table 1 indicates a range of virial central black hole mass estimates of . The mass might be slightly underestimated due to the effects of a more polar line of sight.
In order to eliminate possible artifacts from continuum variability, it is desirable to obtain simultaneous G130M and G160M observations. This was accomplished by the observation on 12/21/2009 and these data were downloaded from MAST.
In the middle frame of Figure 1 the EUV spectrum corrected for Galactic extinction using the method of Cardelli et al. (1989) with and the visual extinction from NED is plotted. Equation (1) and the spectrum in Figure 1 indicates a very high luminosity, . From the black hole mass estimates, the Eddington ratio is extremely high, . Even considering possible more polar line of sight effects in the black hole mass estimate, one concludes that the Eddington ratio is . This seems very extreme, so one must also ask if there is a significant contribution to the continuum from the optical high frequency tail of the synchrotron emission associated with the radio core? There are two strong pieces of evidence against this possibility. First of all, the optical polarization is very low, 0.5%, which is atypical of blazar dilution of the optical quasar spectrum in low redshift sources (Wills et al., 1992). Secondly, the EUV spectrum in Figure 1 shows very strong emission lines for which the equivalent width does not appear to be reduced by a synchrotron background component. Super-Eddington accretion rates were previously found by the completely independent method of fitting accretion disk models to the broadband spectrum (Malkan, 1983). PKS 0405-123, with its powerful radio lobes (see the next section), is perhaps the most extreme counter-example to the notion that radio loud quasars are associated with low Eddington rates (Boroson, 2002). This is apparently a very remarkable radio source worthy of further detailed study. The EUV continuum fit is indicated by the dashed red line and it is estimated that .
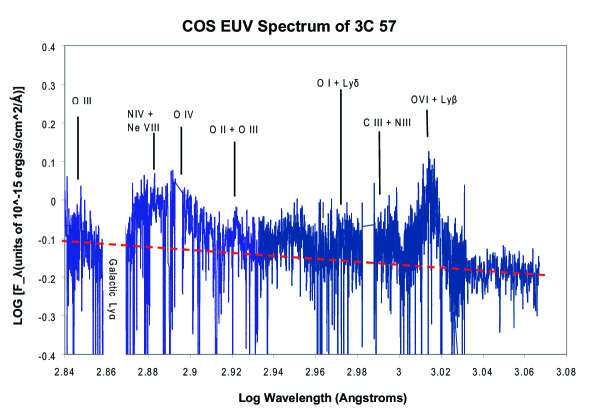
2.3 3C 57
3C 57 is a luminous quasar at z = 0.671 with a complex radio morphology. It has a double steep spectrum nucleus (two bright components separated by kpc, located within the host galaxy) and a low luminosity radio lobe (Reid et al., 1999; Hutchings et al., 1988). This cryptic radio structure will be analyzed in detail in the next section. The results in Table 1 indicate a range of virial central black hole mass estimates, . The quasar was observed on 8/17/2011 with the G160M grating and on 8/19/2011 with the G130M. grating. These data were down loaded from MAST.
In the bottom frame of Figure 1, the EUV spectrum corrected for Galactic extinction using the method of Cardelli et al. (1989) with and the visual extinction from NED is plotted. Equation (1) and the spectrum in Figure 1 indicates a high luminosity, . From the black hole mass estimate, the Eddington ratio is extremely high, . The EUV continuum fit is indicated by the dashed red line and it is estimated that . An attempt was made to consider the possibility that the decline in the flux density at wavelengths just above the excised Galactic Ly region is a consequence of a Lyman limit system (at approximately with ) as was done for 3C 95. In this scenario, even a 15 - 20% decrement correction degraded the continuum extension significantly from just above the excised Galactic Ly region of the spectrum to that below the excised Galactic Ly region of the spectrum. Any Lyman limit system correction will raise the continuum at wavelengths just above the excised Galactic Ly region of the spectrum more than it will below the excised region. This exaggerates the already existing small dip in the continuum in this region (see Figure 1), making the continuum look very unnatural. It is concluded that the decline in the flux density at the short wavelength end of the spectrum relative to the flux density at wavelengths just above the excised Galactic Ly region represents the expected drop in the emission line flux short-ward of the blue wing of the very broad blend of NIV, NeVIII and OIV that is generally very strong in all of the spectra in Figure 1.

3 Estimating the Long Term Time Averaged Jet Power
A method that allows one to convert 151 MHz flux densities, (measured in Jy), into estimates of long term time averaged jet power, , (measured in ergs/s) is captured by the formula derived in Willott et al. (1999); Punsly (2005):
| (2) | |||
| (3) |
where , is the total optically thin flux density from the lobes (i.e., contributions from Doppler boosted jets or radio cores are removed). This calculation of the jet kinetic luminosity incorporates deviations from the overly simplified minimum energy estimates into a multiplicative factor f that represents the small departures from minimum energy, geometric effects, filling factors, protonic contributions and low frequency cutoff Willott et al. (1999). The quantity, f, was further determined to most likely be in the range of 10 to 20 Blundell and Rawlings (2000). In this paper we adopt the following cosmological parameters: =70 km/s/Mpc, and . Define the radio spectral index, , as . The formula is most accurate for large classical double radio sources, thus we do not consider sources with a linear size of less than 20 kpc which are constrained by the ambient pressure of the host galaxy. Alternatively, one can also use the independently derived isotropic estimator in which the lobe energy is primarily inertial in form Punsly (2005)
| (4) |
Due to Doppler boosting on kpc scales, core dominated sources with a very bright one sided jet (such as 3C 279 and most blazars) must be treated with care (Punsly, 1995). The best estimate is to take the lobe flux density on the counter-jet side and multiply this value by 2 (bilateral symmetry assumption) and use this estimate for the flux density in Equations (2) and (4).
For strong radio sources, the value of Equation (4) is typically slightly less than that found in Equation (3) with (Punsly, 2005). Thus, we take Equation (4) as a lower bound on the estimate of (Blundell and Rawlings, 2000). Likewise, Equation (2) with is the maximum upper bound on the estimate of in the following (Willott et al., 1999; Blundell and Rawlings, 2000). The values of that we list below are the average of the upper and lower bound. The assigned uncertainty is the difference between the maximum bound and the average.
3C 95 is a large lobe dominated quasar, so the 24.8 Jy of flux at 160 MHz found in NED is due almost entirely from the radio lobes. A typical lobe spectral index of and Equations (2) - (4) indicate that . PKS 0405-123 has a strong flat spectrum radio core. The multi-frequency component decomposition from Hutchings et al. (1996) is used to subtract off the core flux density as a function of wavelength. The lobe flux density is 1580 mJy at 1.41 GHz. Using and Equations (2) - (4) indicates that erg/s.
| Component | 1.52 GHz Flux | 4.86 GHz Flux | 14.94 GHz Flux | |
| Density (mJy) | Density (mJy)/ | Density (mJy) | ||
| 1.6” beamwidth | 1.8” beamwidth | 1.9” beamwidth | ||
| RMS = 0.8 mJy/beam | RMS = 0.4 mJy/beam | RMS = 0.8 mJy/beam | ||
| 10/31/1988 | 3/18/1989 | 1/12/1987 | ||
| Component N2 | 0.87 | |||
| Component N1 | 0.54 | |||
| Southern Lobe, S | 1.07 |


As mentioned earlier the radio morphology of 3C 57 is more complicated. Figure 2 is a previously unpublished radio image of 3C 57 at 1.52 GHz from the VLA in A-Array from October 31, 1988. The spatial resolution is reasonably well matched to published VLA B-array at 4.86 GHz observations and the VLA C-array observations at 14.94 GHz (Reid et al., 1999; Bogers et al, 1994). We have captured the the results of a three component model of the source at the three frequencies in Table 2. The components are a southern lobe and a a northern component that we split as N1 and N2. The northern component is partially resolved and is fit by two elliptical Gaussians separated by 1.35”. The columns (2) - (5) list the frequency of observation, the beamwidth, the RMS noise level and the flux densities for each component in the model. The matched resolution allows us to estimate the spectral index of the components in a two component fit to the northern component. The spectral indices are derived from the best fit to the three data points for each component and are tabulated in the last column. Component N1 is more luminous above 1 GHz and is flatter spectrum. This is likely the true nucleus. The spectral index for the lobe is not reliable. The flux densities at 4.86 GHz and 14.94 GHz are not reliable for a diffuse lobe, since the surface brightness is very low for this steep spectrum feature. Typically, flux is missed in higher frequency observations of diffuse low surface brightness structures. Thus, we still cannot rule out a more typical spectral index of for the lobe emission.
The first thing that we analyze is component N1. We have three reliable flux density measurements. We note that this component dominates the spectrum at 14.94 GHz and the spectrum is the flattest of the three components. Therefore, it should comprise the preponderance of flux at 90 GHz. The flux density at 90 GHz is mJy (Steppe et al., 1988). In addition to the three values in Table 2, 90 GHz provides a fourth frequency for which the flux density is captured. The data in Table 1 already indicates a spectral break at 4.86 GHz. So, we fit these four points with a model comprised of two power-laws. There will be two amplitudes and two power law indices representing 4 equations (the total flux at each of the 4 frequencies) and four unknowns (the four parameters of the two components model), so there exists a solution if the model is a good approximation to the data. Based on many other steep spectrum radio cores, one expects that a flat spectrum core might be buried inside this feature. The left hand frame of Figure 3 is our two component fit. We describe the optically thin (steep) component of N1 by a flux density at 4.86 GHz of 339 mJy and a power law spectral index of 0.97. We describe the optically thick (flat) component of N1 by a flux density at 4.86 GHz of 431 mJy and a power law spectral index of 0.18. This analysis clearly identifies N1 with the central engine and the true nucleus.
An identification and characterization of the nucleus elucidates the nature of the triple radio source in Figure 2. The right frame of Figure 3 compares a four power law component model to the radio data from NED augmented by the 90 GHz data and we correct the 31.4 GHz data from NED, it should be mJy (Geldzahler and Witzel, 1981). The four component model is the two power law component model of N1 (from the left hand frame) and the power law for N2 in Table 2 and the radio lobe with a spectral index and 106 mJy at 1.52 GHz. The sum of the four components is the dark black curve. The curve fits the data very well from 750 MHz to 90 GHz. Below 750 MHz, the flux density of the model starts to exceed the actual data, significantly. Below 750 MHz, there is clearly a spectral break required to fit the low frequency spectrum. This is likely a consequence free-free absorption (FFA), a phenomenon commonly attributed to the spectral turnover of gigahertz peaked radio sources (O’Dea, 1998). We also note a small discrepancy in the fit near 20 GHz. This might be evidence of blazar-like variability of the flat spectrum radio core.
One can compute the total radio luminosity of the compact steep spectrum regions, if one assumes a strong spectral break between 365 MHz and 750 MHz based on the right hand frame of Figure 3. Secondly, we assume that spectral ageing creates an enhanced downward curvature in the spectrum at GHz. The radio luminosity, is erg/s for the SNSC and erg/s for the northern component of the compact double.
The radio lobe 65 kpc to the southeast shows faint extensions and an elongation back towards the nuclear region. This is indicative of a hot spot at the termination of a radio jet. Higher sensitivity 1.4 GHz B-Array observations with the VLA might reveal some extended jet-like emission in this region. Comparing the flux density of the faint radio lobe from 1.5 GHz, 5 GHz and 15 GHz indicates a very steep spectrum with . As noted above, this result is likely skewed by faint diffuse emission being resolved out at high frequency. However, a very steep spectrum is not ruled out. In order to capture this possibility we extrapolate the 1.52 GHz flux density of 106 mJy to 151 MHz (required for Equations (2) and (4)) two different ways. For the upper bound from Equation (2), we choose and for the lower bound in Equation (4), we use a more conventional . A 300 MHz VLA A-array observation would resolve this ambiguity. However, as noted in the discussion below Equation (4), we need to multiply our calculation of by 2 in order to account for the lack of an estimate for the northern radio jet. The northern radio jet (component N2) is apparently thwarted by galactic gas and dissipates kpc from the nucleus. Thus we estimate erg/s. In this interpretation, and noting the value of , above, the northern jet dissipates between 21% and 76% of its energy as radio emission on sub-galactic scales in component N2.

The large dissipation of jet power into radio luminosity is not entirely unexpected. Recall the comment in the text following Equation (3). Our estimators of jet power in Equations (2) and (4) are technically accurate only for relaxed classical double radio sources. These radio sources expand into a diffuse intra-galactic medium Hence our restriction of applicability that the lobe must be kpc from the central engine (outside of the host galaxy) in order for us to apply this relationship to our radio sources. Equation (2) yields a radio luminosity of the jet power. A similar result has been found for in studies of classical relaxed radio sources (Cavagnolo et al., 2010; Daly et al., 2012). Component N2 is kpc from the central engine, and as we have noted previously, it is likely located within the dense medium of the host galaxy. The work required to displace dense nebular clouds and the intergalactic medium, in general, likely involves MHD waves (including shock waves) and instabilities that can be highly dissipative. This leads to an enhanced radiative luminosity and Equations (2) and (3) will always drastically overestimate the power of the jet if the enveloping environment is dense. However, in the context of the large radio luminosity of the northern component noted above, this does not preclude the possibility that the central engine underwent“a brief” (relative to the long lifetime of the radio source) episode of elevated jet power years ago.
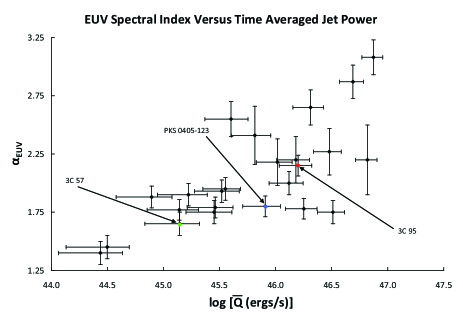
4 Discussion
This paper considers the EUV spectrum and radio properties of three RLQs at the high end region of the quasar parameter space. In the left hand frame of Figure 4 is the scatter plot of - from Punsly and Marziani (2015) with our three new sources added. The three quasars conform to the existing correlation. The exploration of the high end of parameter space can be used to fortify the statistics of the partial correlation analysis of Punsly (2015) amongst the variables, , and that indicated that the correlation of and is fundamental and the correlation of and is spurious. In particular, consider the Spearman partial correlation of with when is held fixed. The partial correlation coefficient with the expanded sample is 0.594 (was 0.492 in Punsly (2015)) which correspondence to a statistical significance of 0.998 (was 0.984). Conversely, the partial correlation of with when is held fixed has a a statistical significance of only 0.188 (was 0.581). Thus, the addition of quasars from the high end of parameter space to the sample has accentuated the fact that the correlation of and is fundamental and the correlation of and is spurious at a very high statistical significance level.
This is a very important result at a fundamental physical level. For example, it highlights the fact that the mass accretion rate is strongly coupled to jet power in quasars that can support a relativistic jet. In particular, the accretion rate regulates jet power in RLQs. As discussed in detail in Punsly (2015), this is a basic prediction of magnetically arrested accretion scenarios for jet production in quasars. This idea is predicated on the fact that large scale magnetic flux is trapped within the inner accretion flow by ram pressure. The rotating magnetic flux is the source of the relativistic jet. More trapped magnetic flux means a stronger jet. The trapped poloidal magnetic flux is vertical as it penetrates the inner accretion flow (perpendicular to the plane on the inflow) in some numerical simulations and models of magnetically arrested accretion (Igumenshchev, 2008; Punsly et al., 2009). Thus, as the large scale magnetic flux forms the base of the radio jet, the thermal gas that is displaced by the magnetic flux results in less EUV emission from the inner accretion flow. Thus, a consistent explanation of the and correlation is achieved given that there is significant vertical flux that threads the inner accretion flow..
References
- Bogers et al (1994) Bogers, W. et al 1994 A $ A 105 91
- Boroson (2002) Boroson, T. 2002, ApJ 565 78
- Blundell and Rawlings (2000) Blundell, K., Rawlings, S. 2000 AJ 119 1111
- Cardelli et al. (1989) Cardelli, J., Clayton, G., Mathis, J. 1989 ApJ 345 245
- Cavagnolo et al. (2010) Cavagnolo K., McNamara B., Nulsen J., Carilli C., Jones C., Birzan L., 2010 ApJ 720 1066
- Daly et al. (2012) Daly, R., Sprinkle, T., O’Dea, C., Kharb, P., & Baum, S., 2012 MNRAS 423 2498
- Davis and Laor (2011) Davis, S., Laor, A. 2011, ApJ 728 98
- Decarli et al. (2011) Decarli, R.; Dotti, M.; Treves, A., 2011 MNRAS 413 39
- Geldzahler and Witzel (1981) Geldzahler, B. and Witzel, A. 1981 AJ 86 1306
- Hutchings et al. (1988) Hutchings, J., Price, E., Gower, A. 1988 ApJ 329 122
- Hutchings et al. (1996) Hutchings, J., Gower, A., Reynveld, S., Dewey, A. 1996 AJ 111 2167
- Igumenshchev (2008) Igumenshchev, I. V. 2008 ApJ 677 317
- Malkan (1983) Malkan, M. 1983 ApJ 268 582
- Marziani et al. (2003) Marziani, P., Sulentic, J. W., Zamanov, R., Calvani, M., Dultzin-Hacyan, D., Bachev, R., Zwitter, T. 2003 ApJS 145 199
- O’Dea (1998) O’Dea, C. 1998 PASP, 110, 493
- Price et al. (1993) Price, E., Gower, A..Hutchings, J., Talon, S., Duncan D., Ross, G. 1993 ApJS 86 365
- Punsly (1995) Punsly, B. 1995 AJ 109 1555
- Punsly (2005) Punsly, B. 2005 ApJL 623 9
- Punsly et al. (2009) Punsly, B., Igumenshchev, I. V., Hirose, S. 2009 ApJ 704 1065
- Punsly (2014) Punsly, B. 2014 ApJL 797 33
- Punsly (2015) Punsly, B. 2015 ApJ 806 47
- Punsly and Marziani (2015) Punsly, B. and Marziani 2015 MNRAS Lett 453 16.
- Punsly et al. (2016) Punsly, B.; Marziani, P.; Kharb, P/; O’Dea, C.; Vestergaard, M.. 2016 ApJ 812 79
- Reid et al. (1999) Reid, R. I., Kronberg, P. P., & Perley, R. A. 1999 ApJS 124 285
- Shen and Liu (2012) Shen, Y., & Liu, X. 2012, ApJ 753 125
- Shull et al. (2012) Shull, M., Stevans, M., Danforth, C. 2012ApJ 752 162
- Steppe et al. (1988) Steppe, H. et al !998 A & A Sup. Ser. 75 317
- Sulentic et al. (2015) Sulentic, J. et al 2015 MNRAS 450 1916
- Telfer et al. (2002) Telfer, R., Zheng, W., Kriss, G., Davidsen, A. 2002 ApJ 565 773
- Vestergaard and Peterson (2006) Vestergaard, M. and Peterson, B. 2006 ApJ 641 689.
- Willott et al. (1999) Willott, C., Rawlings, S., Blundell, K., Lacy, M. 1999 MNRAS 309 1017
- Wills et al. (1992) Wills, B. J., Wills, D.; Breger, M., Antonucci, R.., Barvainis, R. 1992, ApJ 398 454
- Zheng et al. (1997) Zheng, W. et al. 1997 ApJ 475 469