ALMA 0.1–0.2 arcsec resolution imaging of the NGC 1068 nucleus - compact dense molecular gas emission at the putative AGN location
Abstract
We present the results of our ALMA Cycle 2 high angular resolution (01–02) observations of the nuclear region of the nearby well-studied type-2 active galactic nucleus (AGN), NGC 1068, at HCN J=3–2 and HCO+ J=3–2 emission lines. For the first time, due to a higher angular resolution than previous studies, we clearly detected dense molecular gas emission at the putative AGN location, identified as a 1.1 mm (266 GHz) continuum emission peak, by separating this emission from brighter emission located at 05–20 on the eastern and western sides of the AGN. The estimated intrinsic molecular emission size and dense molecular mass, which are thought to be associated with the putative dusty molecular torus around an AGN, were 10 pc and several 105M⊙, respectively. HCN-to-HCO+ J=3–2 flux ratios substantially higher than unity were found throughout the nuclear region of NGC 1068. The continuum emission displayed an elongated morphology along the direction of the radio jet located at the northern side of the AGN, as well as a weak spatially resolved component at 20 on the southwestern side of the AGN. The latter component most likely originated from star formation, with the estimated luminosity more than one order of magnitude lower than the luminosity of the central AGN. No vibrationally excited (v2=1f) J=3–2 emission lines were detected for HCN and HCO+ across the field of view.
Subject headings:
galaxies: active — galaxies: nuclei — galaxies: Seyfert — galaxies: starburst — radio lines: galaxies1. Introduction
An active galactic nucleus (AGN) produces very bright emission from the central compact region of its galaxy due to the release of energy by a mass-accreting supermassive black hole. AGNs can be classified as either type-1 (which show broad optical emission lines) or type-2 (which do not). Based on observations of the nearby type-2 AGN, NGC 1068 (z = 0.0037, distance = 14 Mpc, 1 arcsec is 70 pc), the widely accepted unified picture of AGNs was proposed, which postulates that a central engine (i.e. a mass-accreting supermassive black hole) is surrounded by a toroidally distributed dusty medium, the so-called “dusty torus” (Antonucci & Millar, 1985). Dust located in close proximity to a central AGN is heated by the AGN’s energetic radiation and produces strong mid-infrared (3–20 m) emission. Thus, high angular resolution mid-infrared observations of AGNs are a powerful tool for understanding the properties of the dusty torus.
Based on nuclear infrared to submillimeter photometric observations and a clumpy torus model, the outer size of the dusty torus of NGC 1068 is estimated to be 20 pc (Garcia-Burillo et al., 2014). Very high angular resolution (10 mas) mid-infrared (10 m) interferometric imaging is another powerful tool that can directly constrain the size of the mid-infrared-emitting region in the dusty torus and was applied to NGC 1068 to derive its size of several pc (Jaffe et al., 2004; Poncelet et al., 2006; Raban et al., 2009; Burtscher et al., 2013; Lopez-Gonzaga et al., 2014). Because mid-infrared 10 m observations selectively trace hot (a few 100 K) dust in the inner part of the torus and are not sensitive to cooler dust in the outer part, the actual size of the dust torus could be larger than estimated. Where dust is present in the universe, molecular gas usually co-exists. As the density of dust is likely to be enhanced in the dusty torus, compared with the surrounding area, dense gas (104–105 cm-3) is expected to be abundant in this region. High angular resolution molecular gas observations of the nucleus of NGC 1068, using (sub)millimeter interferometry and dense gas tracers such as HCN and HCO+, can play an important role in observationally constraining the properties of the dusty molecular torus by reducing contamination from more diffuse, less dense molecular gas emission from the host galaxy.
Using the Submillimeter Array (SMA) with an angular resolution of 05–20, HCN J=3–2, HCO+ J=3–2 and J=4–3 emission lines were detected at the nucleus of NGC 1068 (Krips et al., 2011). Subsequent Atacama Large Millimeter/submillimeter Array (ALMA) higher angular resolution (05–06) observations further scrutinized the morphology of the molecular gas emission and revealed that the emission primarily originates from the eastern and western knots, 05–20 arcsec (35–70 pc) offset from the putative AGN position (Garcia-Burillo et al., 2014). The properties of compact molecular gas emission associated with the dusty molecular torus are not yet clear observationally, because the emission is overwhelmed by the much brighter nearby eastern knot (Garcia-Burillo et al., 2014). Molecular gas observation with even higher angular resolution may better reveal the molecular emission arising from the dusty molecular torus. In this paper, we present the results of our ALMA Cycle 2 observations of the nucleus of NGC 1068 at HCN J=3–2 and HCO+ J=3–2 lines, with an angular resolution of 0102.
2. Observations and data analysis
Band 6 (211–275 GHz) ALMA observations of the nucleus of NGC 1068 were conducted as part of our Cycle 2 program 2013.1.00188.S (PI = M. Imanishi) on 2015 September 19 (UT), with a median precipitable water vapor value of 1.9 mm. In our proposal, we had requested an angular resolution of 06, and we adopted the widest 1.875 GHz width mode in each spectral window. There were 36 antennas, and the baseline lengths were 41–2270 m. J02240659, J0334401, and J02190120 were used as bandpass, flux, and phase calibrators, respectively. The total net on-source integration time was 24.9 min.
We covered 263.9–268.6 GHz with three spectral windows, allowing us to observe HCN J=3–2 ( = 265.886 GHz) in one spectral window and HCO+ J=3–2 ( = 267.558 GHz) in another window. HCN v2=1f J=3–2 ( = 267.199 GHz) was observed in the same spectral window as HCO+ J=3–2. The HCO+ v2=1f J=3–2 ( = 268.689 GHz) line was covered in the third spectral window.
Data analysis began with calibrated data provided by the Joint ALMA Observatory, using CASA 4.5.0 (https://casa.nrao.edu). After checking the visibility plots, we estimated the continuum flux level using channels that were not affected by strong emission lines. We subtracted the estimated constant continuum level using the CASA task “uvcontsub”, and then applied the task “clean” (natural weighting, gain 0.1, threshold 0.8 mJy) to create final continuum-subtracted molecular emission line data. The clean task was also applied to the extracted continuum data (the so-called “mfs” (Multi-frequency synthesis) method). During the clean procedures, we binned 40 channels (20 km s-1) to increase the signal-to-noise ratios and utilized a pixel scale of 003 pixel-1, because our observations were conducted with a long maximum baseline. As we intended to discuss emission morphology not only at the nucleus, but also at some off-nuclear regions, we applied the primary beam correction to all data. The absolute flux calibration uncertainty and maximum recoverable scale of our ALMA band 6 data are 30% 111 This is mainly caused by the flux uncertainty of the flux calibrator, J0334401. and 40, respectively.
Because we made only one measurement of the NGC 1068 nucleus, and the field of view of our ALMA band 6 data is 10 arcsec in radius, dense molecular gas emission from the well-known star-forming molecular gas ring at 10–15 arcsec from the nucleus (Tsai et al., 2012; Garcia-Burillo et al., 2014) was not adequately probed. Thus, our discussion focuses on the nuclear dense molecular gas emission properties within a central region of a few arcsec. We have confirmed that the PSFs of our data are fairly clean, with no significant side lobes are recognizable at the region of our interest.
3. Results
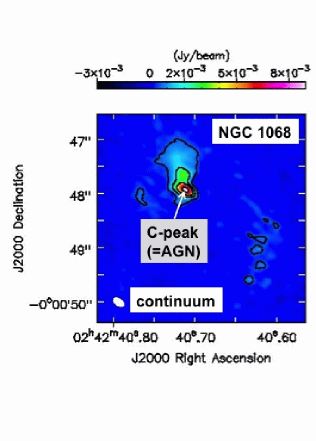
Figure 1 shows a map of the continuum. The achieved angular resolution was 023012, which was significantly higher than our specified minimum. The peak flux is estimated to be 9.2 mJy beam-1 (51) at (02h42m40.711s, 00∘00′47.93)J2000 in our 003 pixel-1 continuum map. The peak coordinate agrees with the reported AGN location at (02h42m40.71s, 00∘00′47.94′′)J2000 (Roy et al., 1998; Garcia-Burillo et al., 2014). We therefore regard the coordinates of our continuum peak as the AGN location, denoted as “C-peak”.
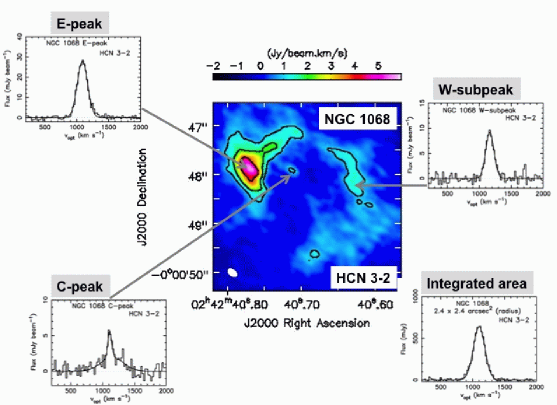
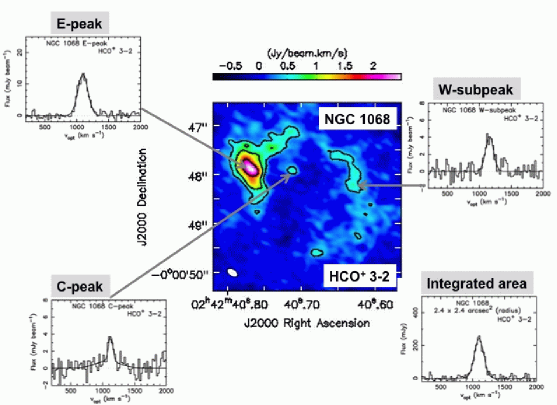
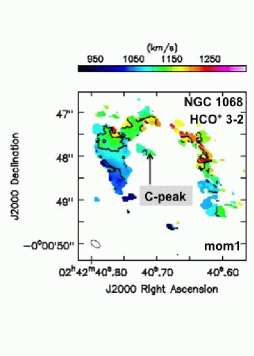
Integrated intensity (moment 0) maps for the HCN J=3–2 and HCO+ J=3–2 emission lines are presented in Fig. 2, and their properties are summarized in Table 1. The angular resolution in these maps is 01–02. The brightest HCN J=3–2 and HCO+ J=3–2 emission is found at 10 on the eastern side of the AGN (C-peak), with a peak position at (02h42m40.77s, 00∘00′47.87′′)J2000, which is denoted as “E-peak”. Additionally, weak emission is observed at the western side of the AGN; here, the peak positions are slightly different between HCN and HCO+. We tentatively denote the HCO+ J=3–2 emission peak in the western knot at (02h42m40.63s, 00∘00′48.24′′)J2000 as “W-subpeak”. These properties have already been recognized in previously obtained interferometric HCN and HCO+ maps (Krips et al., 2011; Garcia-Burillo et al., 2014). Our high angular resolution (01–02) maps allow compact molecular emission to be clearly identified at the AGN location (C-peak) for the first time, by separating this emission from the brighter molecular gas emission from the eastern and western sides of the AGN.
The spectra at E-peak, W-subpeak, and C-peak are shown in Fig. 3. To investigate the overall molecular line emission properties within the central region of NGC 1068 of a few arcsec, we created a spectrum by integrating a 24 radius circular region around (02h42m40.69s, 00∘00′48.50′′)J2000, as shown in Fig. 3.
Gaussian fits for the HCN J=3–2 and HCO+ J=3–2 emission lines in the spectra, within the beam size, at the E-peak, W-subpeak, and C-peak are also shown in Fig. 2. Molecular line fluxes, estimated from the Gaussian fits, within the beam size are summarized in Table 1. Gaussian fits to the detected molecular emission lines in the area-integrated spectrum (24 radius circular region) and their best-fit parameters are included in Fig. 2 and Table 1, respectively. We adopt the fluxes estimated with these Gaussian fits for our subsequent discussion. A broad emission component is detected at the C-peak, but not in the other regions. This broad component may be related to highly turbulent molecular gas in the torus (Wada et al., 2009) and/or possible compact outflow activity.
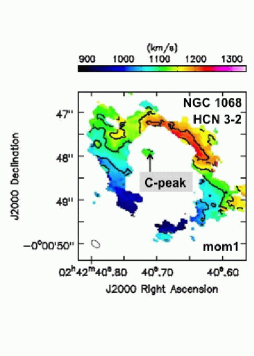
Figure 4 presents intensity-weighted mean velocity (moment 1) maps for the HCN J=3–2 and HCO+ J=3–2 emission lines, to provide a better understanding of their dynamics.
In the spectra, we see no clear signatures of vibrationally excited v2=1f J=3–2 emission lines of HCN and HCO+. We generated integrated-intensity (moment 0) maps of these lines by summing ten velocity channels with vopt = 1000–1210 km s-1, but obtained non-detection with 3 upper limits of 0.15 [Jy beam-1 km s-1], both for vibrationally excited (v2=1f) HCN J=3–2 and HCO+ J=3–2 emission lines.
4. Discussion
4.1. Molecular emission from the putative AGN dusty torus
Compact HCN J=3–2 and HCO+ J=3–2 emission lines are clearly detected at the C-peak, where the putative dusty molecular torus is located. The most natural explanation is that this compact emission is associated with the dusty molecular torus around an AGN’s central engine. The deconvolved intrinsic size of the HCN J=3–2 emission, estimated using the CASA task “imfit”, is 17552 [mas] 9231 [mas], or 12.33.6 [pc] 6.22.2 [pc] 222 The size measurement of the HCO+ J=3–2 emission at the C-peak, using “imfit”, provides 16494 [mas] 54121 [mas].. This is roughly comparable to the estimated torus size of 20 [pc], based on a nuclear infrared to submillimeter spectral energy distribution and a clumpy torus model (Garcia-Burillo et al., 2014).
We estimated the mass of dense molecular gas in the dusty molecular torus from the detected compact HCN J=3–2 emission at the C-peak, within the beam size. If HCN emission is thermalized at up to J=3 and optically thick, then the HCN J=1–0 flux is 1/9 of the HCN J=3–2 flux. If the emission is sub-thermal, then the HCN J=1–0 flux is larger than 1/9 of the HCN J=3–2 flux. The HCN J=1–0 luminosity, derived using Equations (1) and (3) of Solomon & Vanden Bout (2005), is 2.00.6 [L⊙] or (8.82.6)104 [K km s-1 pc2], or possibly even higher. Adopting the relationship between dense molecular mass and HCN J=1–0 luminosity, Mdense = 10 HCN J=1–0 luminosity [M⊙ (K km s-1 pc2)-1] (Gao & Solomon, 2004; Krips et al., 2008), we obtain a dense molecular mass in the torus of several 105 M⊙ (with large potential uncertainty), which roughly agrees to the gas mass estimated with the clumpy torus model, (2.11.2)105 M⊙ (Garcia-Burillo et al., 2014). This agreement suggests that the bulk of the molecular gas in the torus is in a dense form and has been properly probed with our HCN J=3–2 observation.
In the HCN/HCO+ J=3–2 moment 0 map, faint emission connecting the C-peak to the bright eastern molecular knot is just visible in the northeastern direction from the C-peak. The northern molecular gas is thought to be further out than the central AGN and its putative dusty torus (Garcia-Burillo et al., 2014). The connected part is the least redshifted in the northern region (i.e., the observed velocity toward the other side is the smallest) and may be related to the molecular gas supply from the eastern molecular region to the central AGN torus, though higher sensitivity observations are necessary to pursue this scenario in further detail.
4.2. Continuum emission
The continuum emission in Fig. 1 displays an elongated morphology along the northern direction from the peak. As the putative dusty molecular torus is estimated to be oriented along the southeastern to northwestern direction (Greenhil et al., 1996; Raban et al., 2009), the continuum elongation is visible in a direction that is not intercepted by the torus. Synchrotron emission along the radio jet (Roy et al., 1998; Gallimore et al., 2004) and thermal radiation from mid-infrared 10–20 m continuum-emitting dust (Alloin et al., 2000; Tomono et al., 2001) also show a similarly elongated morphology along the northern direction. Multi-frequency 01–02 angular resolution ALMA data will help to resolve the origin of this elongated continuum emission.
Spatially extended weak emission is visible at 20 in the southwestern part of the C-peak or the southern part of the W-subpeak, at (02h42m40.60–40.65s, 00∘00′48.5–49.7′′) J2000. In this region, similarly spatially extended HCN J=3–2 and HCO+ J=3–2 emission lines are also evident in Fig. 2. Continuum emission at 349 GHz and 689 GHz was also detected in this area (Garcia-Burillo et al., 2014). A natural origin for the continuum emission at 260 GHz is star-formation, because newly-born stars in dense molecular gas can (1) heat the surrounding dust and emit dust thermal radiation, and (2) create HII-regions, from which thermal free-free emission is produced. In fact, in Fig. 2, HCN J=3–2 and HCO+ J=3–2 emission lines are weaker in the region where continuum emission is detected (hereafter, the SW star-forming region), than the region close to the W-subpeak. It is likely that conversion from dense molecular gas to stars and additional possible stellar feedback to the surrounding molecular gas dissipate the dense molecular gas and weaken the HCN J=3–2 and HCO+ J=3–2 emission lines in the SW star-forming region.
We measured the total continuum flux in the SW star-forming region (rectangular with a width of 07 in the east-west a width of 21 in the north-south) (02h42m40.59–40.64s, 00∘00′47.89–50.00′′)J2000 to be 10 mJy. If this is solely due to the thermal free-free emission inside star-forming HII-regions, then the corresponding far-infrared (40–500 m) luminosity becomes 6 1043 [erg s-1], or there is a star formation rate of 3 M⊙ yr-1 (Kennicutt, 1998), when Equation (1) of Nakanishi et al. (2005) is used. If dust thermal radiation contributes in some way to the continuum flux there, the estimated star-formation luminosity will be smaller. Previous infrared spectroscopy failed to clearly detect the signatures of ongoing active star-formation at the central few arcsec region of the NGC 1068 nucleus, due to the lack of polycyclic aromatic hydrocarbon (PAH) emission features (Imanishi et al., 1997; Le Floc’h et al., 2001), which are a good probe of star-formation activity (Moorwood, 1986; Imanishi & Dudley, 2000). It was also argued that the molecular gas properties at the NGC 1068 nucleus are dominated by AGN radiation, rather than star-formation (Usero et al., 2004; Garcia-Burillo et al., 2010). Thus, our continuum emission map provides a new signature for the detectable amount of star-formation activity in the nuclear few arcsec region of NGC 1068, thanks to the high sensitivity of ALMA. The PAH emission flux within the nuclear 38 38 region in infrared spectroscopy is estimated to be 2.7 1040 [erg s-1] (Imanishi, 2002), which corresponds to star-formation-originated far-infrared luminosity with 2.7 1043 [erg s-1] (Mouri et al., 1990). This upper limit is apparently smaller than the above estimate but can be reconciled because (1) not all of the SW star-forming region was covered by previous infrared slit spectroscopy (Imanishi et al., 1997), (2) the estimated star-formation luminosity is reduced if dust thermal radiation contributes to the observed continuum emission at 266 GHz, and (3) some fraction of the PAHs can potentially be destroyed by the AGN’s strong X-ray radiation in the close vicinity of the AGN in NGC 1068 (Voit, 1992).
4.3. Molecular emission at the nuclear region
Throughout the nuclear few arcsec region of NGC 1068, the HCN J=3–2 flux tends to be higher than the HCO+ J=3–2 flux in the moment 0 maps. We compared the HCN J=3–2 and HCO+ J=3–2 fluxes, based on Gaussian fits, at representative regions, E-peak, W-subpeak, C-peak (all within the beam size), and the 24 radius circular region. The HCN-to-HCO+ J=3–2 flux ratios were 1.6–3.3 (Table 1), and were much higher than those of the starburst regions (Imanishi et al., 2016a). Enhanced HCN-to-HCO+ flux ratios were also found in the nucleus of NGC 1068 at J=1–0 (Krips et al., 2008) and J=4–3 (Garcia-Burillo et al., 2014; Viti et al., 2014). Although signatures of the SW star-forming region are found in our ALMA data, the estimated star-formation luminosity of LSF-SW 6 1043 [erg s-1] is an order of magnitude lower than the central AGN luminosity of LAGN 6 1044 [erg s-1] (Bock et al., 2000). It has been argued that AGNs tend to have higher HCN-to-HCO+ J-transition flux ratios than starburst regions (Kohno, 2005; Krips et al., 2008; Imanishi et al., 2007, 2009; Imanishi & Nakanishi, 2014; Izumi et al., 2016). Our observational results of high HCN-to-HCO+ J=3–2 flux ratios at the NGC 1068 nuclear region can naturally be explained by the effect of the AGN.
5. Summary
We conducted 01–02 angular-resolution ALMA Cycle 2 observations of the nucleus of NGC 1068 at HCN J=3–2, HCO+ J=3–2, and nearby continuum emission. The high angular resolution of our data allowed detection of dense molecular gas emission at the putative AGN dusty molecular torus for the first time, by clearly separating this emission from brighter emission at 05–20 on the eastern and western sides of the central AGN. Enhanced HCN-to-HCO+ J=3–2 flux ratios, substantially larger than unity, were found throughout the region a few arcsec from the nucleus of NGC 1068. We detected continuum emission, most likely to have originated during star formation, at 20 in the southwestern part of the AGN. These are the first clearly resolved ongoing star-formation signatures, despite much lower luminosity than the AGN, in the NGC 1068 nuclear region.
We thank the anonymous referee for his/her useful comment which helped to improve the clarity of this manuscript. We are grateful to Dr. Y. Ao and A. Kawamura for their supports regarding ALMA data analysis. M.I. was supported by JSPS KAKENHI Grant Number 23540273 and 15K05030. This paper makes use of the following ALMA data: ADS/JAO.ALMA#2013.1.00188.S. T.I. is thankful for the fellowship received from the Japan Society for the Promotion of Science (JSPS). ALMA is a partnership of ESO (representing its member states), NSF (USA) and NINS (Japan), together with NRC (Canada), NSC and ASIAA (Taiwan), and KASI (Republic of Korea), in cooperation with the Republic of Chile. The Joint ALMA Observatory is operated by ESO, AUI/NRAO, and NAOJ.
References
- Alloin et al. (2000) Alloin, D., Pantin, E., Lagage, P. O., & Granato, G. L. 2000, A&A, 363, 926
- Antonucci & Millar (1985) Antonucci, R. R. J. & Millar, J. S. 1985, ApJ, 297, 621
- Bock et al. (2000) Bock, J. J., Neugebauer, G., Matthews, K., 2000, AJ, 120, 2904
- Burtscher et al. (2013) Burtscher, L., Meisenheimer, K., Tristram, K. R. W., et al. 2013, A&A, 558, A149
- Gallimore et al. (2004) Gallimore, J. F., Baum, S. A., & O’dea, C. P., 2004, ApJ, 613, 794
- Gao & Solomon (2004) Gao, Y., & Solomon, P. M. 2004, ApJ, 606, 271
- Garcia-Burillo et al. (2010) Garcia-Burillo, S., Usero, A., Fuente, A., 2010, A&A, 519, A2
- Garcia-Burillo et al. (2014) Garcia-Burillo, S., Combes, F., Usero, A., et al. 2014, A&A, 567, 125
- Greenhil et al. (1996) Greenhill, L. J., Gwinn, C. R., Antonucci, R., & Barvainis, R. 1996, ApJ, 472, L21
- Imanishi (2002) Imanishi, M. 2002, ApJ, 569, 44
- Imanishi & Dudley (2000) Imanishi, M., & Dudley, C. C. 2000, ApJ, 545, 701
- Imanishi & Nakanishi (2014) Imanishi, M., & Nakanishi, K. 2014, AJ, 148, 9
- Imanishi et al. (2016a) Imanishi, M., & Nakanishi, K. et al. 2016a, in preparation
- Imanishi et al. (2007) Imanishi, M., Nakanishi, K., Tamura, Y., Oi, N., & Kohno, K. 2007, AJ, 134, 2366
- Imanishi et al. (2009) Imanishi, M., Nakanishi, K., Tamura, Y., & Peng, C. -H. 2009, AJ, 137, 3581
- Imanishi et al. (1997) Imanishi, M., Terada, H., Sugiyama, K., et al. 1997, PASJ, 49, 69
- Izumi et al. (2016) Izumi, T., Kohno, K., Aalto, S., et al. 2016, ApJ, 818, 42
- Jaffe et al. (2004) Jaffe, W., Meisenheimer, K., Rottgering, H. J. A., et al. 2004, Nature, 429, 47
- Kennicutt (1998) Kennicutt, Jr. R. C. 1998, ARA&A, 36, 189
- Kohno (2005) Kohno, K. 2005, in AIP Conf. Ser. 783, The Evolution of Starbursts, ed. S. Hüttemeister, E. Manthey, D. Bomans, & K. Weis (New York: AIP), 203 (astro-ph/0508420)
- Krips et al. (2008) Krips, M., Neri, R., Garcia-Burillo, S., Martin, S., Combes, F., Gracia-Carpio, J., & Eckart, A. 2008, ApJ, 677, 262
- Krips et al. (2011) Krips, M., Martin, S., Eckart, A., et al. 2011, ApJ, 736, 37
- Le Floc’h et al. (2001) Le Floc’h, E., Mirabel, I. F., Laurent, O., et al. 2001, A&A, 367, 487
- Lopez-Gonzaga et al. (2014) Lopez-Gonzaga, N., Jaffe, W., Burtscher, L., Tristram, K. R. W., & Meisenheimer, K. 2014, A&A, 565, A71
- Moorwood (1986) Moorwood, A. F. M. 1986, A&A, 166, 4
- Mouri et al. (1990) Mouri, H., Kawara, K., Taniguchi, Y., & Nishida, M. 1990, ApJ, 356, L39
- Nakanishi et al. (2005) Nakanishi, K., Okumura, S. K., Kohno, K., Kawabe, R., & Nakagawa, T. 2005, PASJ, 57, 575
- Poncelet et al. (2006) Poncelet, A., Perin, G., & Sol, H. 2006, A&A, 450, 483
- Raban et al. (2009) Raban, D., Jaffe, W., Rottgering, H., et al. 2009, MNRAS, 394, 1325
- Roy et al. (1998) Roy, E. J. M., Wilson, A. S., & Ulvestad, J. S., 1998, ApJ, 504, 147
- Solomon & Vanden Bout (2005) Solomon, P. M., & Vanden Bout, P. A. 2005, ARA&A, 43, 677
- Tomono et al. (2001) Tomono, D., Doi, Y., Usuda, T., & Nishimura, T. 2001, ApJ, 557, 637
- Tsai et al. (2012) Tsai, M., Hwang, C-Y., Matsushita, S., Baker, A., & Espada, D. 2012, ApJ, 746, 129
- Usero et al. (2004) Usero, A., Garcia-Burillo, S., Fuente, A., Martin-Pintado, J., & Rodriguez-Fernandez, N. J., 2004, A&A, 419, 897
- Viti et al. (2014) Viti, S., Garcia-Burillo, S., Fuente, A., et al. 2014, A&A, 570, A28
- Voit (1992) Voit, G. M. 1992, MNRAS, 258, 841
- Wada et al. (2009) Wada, K., Papadopoulos, P. P., & Spaans, M. 2009, ApJ, 702, 63
| Position | Line | Integrated intensity (moment 0) map | Gaussian line fit | |||||
|---|---|---|---|---|---|---|---|---|
| [GHz] | Peak | rms | Beam | Velocity | Peak | FWHM | Flux | |
| [Jy beam-1 km s-1] | [′′ ′′] (∘) | [km s-1] | [mJy] | [km s-1] | [Jy km s-1] | |||
| (1) | (2) | (3) | (4) | (5) | (6) | (7) | (8) | (9) |
| E-peak | HCN J=3–2 | 5.8(18) | 0.32 | 0.220.13 (54∘) | 10902 | 281 | 1934 | 5.70.1 |
| HCO+ J=3–2 | 2.6 (17) | 0.15 | 0.240.13 (57∘) | 10973 | 131 | 1867 | 2.60.1 | |
| W-subpeak | HCN J=3–2 | 1.4(4.5) | 0.32 | 0.220.13 (54∘) | 11654 | 9.20.4 | 1529 | 1.50.1 |
| HCO+ J=3–2 | 0.65 (4.4) | 0.15 | 0.240.13 (57∘) | 11598 | 4.10.4 | 14720 | 0.640.11 | |
| C-peak | HCN J=3–2 | 1.1(3.4) | 0.32 | 0.220.13 (54∘) | 11107, 115133 | 3.80.7, 1.90.4 | 6916, 41176 | 1.10.3 |
| HCO+ J=3–2 | 0.66(4.5) | 0.15 | 0.240.13 (57∘) | 112512, 1081(fix) | 2.90.8, 0.830.38 | 8121, 474(fix) | 0.670.22 | |
| 24 | HCN J=3–2 | — | — | — | 11011 | 6408 | 2123 | 1443 |
| HCO+ J=3–2 | — | — | — | 11013 | 2437 | 1716 | 442 | |
Note. — Col.(1): Position. Col.(2): Line. Col.(3): Integrated intensity in [Jy beam-1 km s-1] at the emission peak. The detection significance relative to the rms noise (1) in the moment 0 map is shown in parentheses. Possible systematic uncertainty is not included. For HCN J=3–2 and HCO+ J=3–2, 22 and 21 velocity channels of 20 MHz (20 km s-1) width for each (870–1350 km s-1 and 890–1350 km s-1) are summed, respectively. Col.(4): rms noise (1) level in the moment 0 map in [Jy beam-1 km s-1], derived from signals in the annular region with 24–60 centered at (02h42m40.70s, 00∘00′48.5′′)J2000, to avoid an area of significant molecular emission line detection. Col.(5): Beam size in [arcsec arcsec] and position angle in [degree]. Position angle is 0∘ along the north-south direction, and increases counterclockwise. Cols.(6)–(9): Gaussian fits of emission lines in the spectra. At the C-peak, two Gaussian fits are made because a very broad component is observed, in addition to a narrow component. Col.(6): Optical velocity (vopt) of emission peak in [km s-1]. Col.(7): Peak flux in [mJy]. Col.(8): Observed FWHM in [km s-1] in the spectra of Fig. 2. Col.(9): Flux in [Jy km s-1].