The Ionization Structure of Sharpless 2-264: Multiwavelength Observations of the Ori H II Region
Abstract
We present velocity-resolved maps taken with the Wisconsin H-Alpha Mapper (WHAM) in H, [S II] , and [N II] around the well-known O8 III star Ori A (HD 36861) ( to , to ). The integrated intensity ( to km s-1), , within WHAM’s one-degree beams varies from R near the center to R on the periphery of the nebula where it becomes comparable to foreground and/or background emission in this complex region. Intensity ratios for [N II]/H and [S II]/H average 0.28 and 0.35, respectively. In both ratios, higher values are found preferentially at larger radii from Ori, although the behavior of [N II]/H is complicated near the edges of the nebula. The [S II]/[N II] intensity ratio ranges from to , with the value increasing toward larger radii (and lower H intensities). Variations of [S II]/H, [N II]/H, and [S II]/[N II] line ratios in this diffuse region show some similar trends to those seen in the warm ionized medium (WIM) but with generally lower metal-line ratios. As with the WIM, the trends are driven by changes in the underlying physical parameters, most notably the ionization states and gas temperature. To investigate which cause might be dominant in this region, we use these extremely high signal-to-noise observations to construct a map of temperature and non-thermal velocity throughout the nebula. Using the line widths of H and [S II], we separate thermal and non-thermal components and find spatial trends of these parameters within the nebula. Ion temperatures range between 4000 K and 8000 K throughout the nebula. The non-thermal velocity map reveals a decrease in velocity from about 10 km s-1 to 5 km s-1 from the center to the edge of the lower half of the H II region. In addition to using the widths as a measure of temperature, we also use the variation in [N II]/H to estimate electron temperature. The results obtained from this diffuse H II region around Ori can be compared to studies of the WIM to provide important insight into the nature of the diffuse ionized gas (DIG) throughout the disk and halo of the Galaxy.
1 INTRODUCTION
The Wisconsin H-Alpha Mapper (WHAM) has measured a variety of optical emission lines for a multitude of large-scale ionized structures that include loops, filaments, and bubbles. The results from such studies provide insight into the workings of these discrete structures as well as the warm ionized medium (WIM) that pervades the Galaxy. The unique design of its 15-cm dual-etalon Fabry-Perot spectrometer allows WHAM to produce the first kinematic H map of the ionized gas in the Milky Way (Haffner et al., 2003) as well as spectral maps of diagnostic lines such as [S II] 6716, [N II] 6583, and [O III] 5007 (e.g., Haffner et al., 1999; Madsen et al., 2006). Other recent large-angle surveys that trace diffuse H in our region of study include the Southern H Sky Survey Atlas (SHASSA; Gaustad et al. 2001) and the Virginia Tech Spectral-Line Survey (VTSS; Dennison et al. 1998). Although both provide higher spatial resolution than WHAM, these imaging surveys provide no spectral information and cannot isolate overlapping emission features. WHAM is also an order of magnitude more sensitive in the survey-mode presented here due to its large beam (1°) sampling and its ability to spectrally remove all contamination from atmospheric sky lines. Here, we present the first multi-wavelength spectral maps of Sh 2-264, an H II region ionized by the O8 III star, Ori A (HD 36861; , ).
Such relatively isolated, large-angle, diffuse H II regions form an important observational bridge between the concentrated, classical, bright nebulae in high-density star-forming environments and the wide-spread, low-density WIM. Unlike the WIM, these regions have simple, well-understood sources of ionization with density characteristics more typical of the diffuse ISM. A few of these have also become important calibration targets for WHAM as regions of moderate intensity over large-angular scales that are visible from its former northern and new southern locations.
Ori A anchors a small knot of massive stars in the center of the H II region but dominates the ionizing luminosity of the association. Studies of the recent and on-going star formation in the immediate surroundings of Ori suggest that violent stellar activity has reorganized the gas since its formation. A comprehensive review of the region, with particular emphasis on the star-formation history, is presented by Mathieu (2008). For our study, we adopt the hypothesis put forth in Dolan & Mathieu (2001, 2002) that at least one supernova has reorganized the molecular gas in the region 1–2 Myr ago, truncating star formation in the central region near Ori and creating the low-density cavity for the diffuse H II region. We also adopt the main-sequence fitting distance for the cluster of pc as derived by Dolan & Mathieu (2001) as the distance to the center of Sh 2-264, placing it about 94 pc away from the Galactic Plane. Although the H II region appears to be relatively isolated and dominated predominantly by the influence from Ori alone, Sh 2-264 is in the vicinity of the impressive Orion-Eridanus superbubble complex and likely shares a complex, common history with the region. Ochsendorf et al. (2015) present a recent, comprehensive view derived from several multiwavelength surveys.
Using WHAM observations of the H line () and the faint optical emission lines [S II] 6716 and [N II] 6583, we begin a study of the physical state of the diffuse H II region surrounding Ori. H survey data are combined with [S II] and [N II] observations to learn about the ionization state of the gas and to derive non-thermal velocity and temperature throughout the -pc-diameter H II region. Our multiwavelength study also probes into regions beyond the apparent Strömgren sphere, revealing nearby filamentary structure, including a portion of Barnard’s Loop (Sh 2-276).
2 OBSERVATIONS
The WHAM spectrometer was designed to detect optical emission lines from diffuse sources at high spectral resolution. The recombination line H—typically the brightest of these—is used as the primary tracer to map ionized gas. The physical conditions and ionization state of the gas can then be studied by adding observations of collisionally excited diagnostic lines. WHAM’s first major effort produced the first kinematic map of the northern sky () in H, which took approximately two years. This map reveals detailed structure of supernova remnants in the form of giant bubbles and super-shells as well as filaments of warm pervasive gas seen far from classical H II regions. The WHAM Northern Sky Survey (WHAM-NSS; Haffner et al., 2003), containing more than 37,500 individual H spectra obtained with a 1∘diameter beam, is the first spectral survey to map the spatial distribution and kinematic structure of diffuse ionized gas throughout the Galaxy (Reynolds et al., 2002; Haffner et al., 2003). By using a Fabry-Perot spectrometer, WHAM can accept this large solid angle while delivering high spectral resolution (). This beam size combined with our ability to cleanly separate Galactic and atmospheric emission allows the deepest WHAM observations to be roughly 100 times more sensitive to diffuse, extended emission than current imaging instruments, opening up new opportunities for exploration. It is now located in Chile and has observed the southern sky to provide the first all-sky, kinematic H map analogous to surveys of H I in 21 cm. Considerable detail about WHAM’s optical design, performance, and data reduction can be found in Tufte (1997) and Haffner et al. (1999).
In this study, H observations have been extracted from the WHAM-NSS and have been supplemented with WHAM observations in [S II] and [N II] within a area surrounding Ori. The area surveyed spans the region in Galactic coordinates to and to . The H observations were mainly taken in 1997 during the northern H survey while the [S II] and [N II] observations were obtained in 2006. On-sky exposure times are 30 s for H and 60 s for [S II] and [N II] observations. Since the WHAM spectrometer records only spectral information, each observation taken with WHAM represents the average spectrum within a 1∘-diameter beam on the sky. The region of study includes 552 original observations in each spectral line. Five directions contain too much spectral contamination from bright stars having mag (, , , and Ori; Tau) and are excluded from the final dataset of 547 spectra in each line.
Due to heavy dilution by the one-degree beam relative to diffuse emission, only the brightest stars impact our observations. However, all spectra obtained with WHAM contain noticeable features from the earth’s atmosphere. In H, the geocoronal H emission line is the primary contaminant, which arises from neutral hydrogen being excited by scattered solar Ly radiation in the exosphere (Mierkiewicz et al., 2006; Nossal et al., 2006). [S II] observations contain emission from the terrestrial neon line (Ne I ), which originates from city lights scattered into the night sky around Kitt Peak (Reynolds & Ogden, 1982; Haffner et al., 1999). This line is located km s-1 from the geocentric zero of [S II] emission but is much fainter than geocoronal H. Since these lines vary independently from the fainter atmospheric lines described below, a Gaussian profile is fit to them and subtracted from each observation. Haffner et al. (2003) describes this procedure for H in more depth.
[S II] and [N II] emission—as well as H—are also contaminated by –7 other atmospheric lines which have full-width-at-half-maximum (FWHM) km s-1 and intensities –0.5 R. The absolute strengths of the atmospheric lines are observed to vary with position and time. Within a given night, these intensities correlate well with zenith distance. Yet the relative strengths of these faint lines are constant to . As a result, we can construct an atmospheric template by observing directions with little Galactic emission multiple times over several nights (Hausen et al., 2002). We use high signal-to-noise averaged spectrum from each observational “block” (up to a grid of individual 1∘-observations) to determine the absolute intensity level of the template for that block. Semi-automated software is then used to fit Gaussian profiles to multiple Galactic components and remove atmospheric emission present in each individual spectrum. Haffner et al. (2003) describe this procedure in more detail for the H survey. For all three spectral windows presented here, the total emission from faint atmospheric lines in our 200 km s-1 spectral window near km s-1 varies from about 0.2 to 0.8 R depending on the night and look direction. We are able to determine the absolute intensity level of the atmospheric templates better than 10% in most spectra. Directions where the Galactic emission is very bright ( R) make this determination difficult, but for the same reason any residual contamination from atmospheric lines also becomes negligible. From our analysis, we estimate a conservative systematic uncertainty of 0.05 R contributed by residuals over the whole 200 km s-1 spectrum.
Each spectrum is calibrated to obtain a stable velocity zero-point with respect to the local standard of rest (LSR). Velocity calibration in H and [S II] is accomplished by using the brighter atmospheric lines (geocoronal H and terrestrial Ne I). Line centers fit during atmospheric subtraction are recorded and used to establish the geocentric velocity frame (e.g., Haffner et al., 1999, 2003). Translation from the geocentric frame to LSR is calculated using the same traditional value for the Standard Solar Motion adopted by 21 cm observers, +20 km s-1 toward (Haffner et al., 2003). A thorium argon (Th-Ar) lamp is used as the wavelength calibrator for the [N II] observations. Velocity calibration can also be verified for the [N II] observations by comparing H and [N II] spectra from bright nebulae—with the assumption that the emission from both lines takes on relatively similar velocity profiles (Haffner et al., 1999).
Our intensity calibration is tied to regular observations of NGC 7000 (North American Nebula; NAN), a large emission nebula in Cygnus. NGC 7000 subtends a large enough solid angle to fill WHAM’s 1∘-beam and bright enough to achieve very high signal-to-noise in our typical exposure times. We use the absolute H intensity of NGC 7000 as determined by Scherb (1981) who used the planetary nebula NGC 7662 and standard stars as reference objects. This study measured the intensity of the NGC 7000 to be R for a 49′ FOV using a Fabry-Perot spectrometer. [S II] and [N II] emission is calibrated by applying a correction factor of 0.94 for [S II] and 1.15 for [N II]. These factors account for instrument throughput differences between these lines and H throughout the instrument (Haffner et al., 1999).
3 RESULTS AND DISCUSSION
Figures 1a, 1b, and 1c display intensity-integrated maps of H, [N II], and [S II] emission surrounding Ori as sampled in the WHAM survey mode. Each map is constructed from 547 individual -beam observations. The color represents the intensity of each emission spectrum integrated over velocities to km s-1 after subtraction of atmospheric and continuum emission as discussed in §2. These three intensity maps look qualitatively similar with the brightest emission around Ori at revealing the -diameter Strömgren sphere. Darker regions still contain emission from the WIM but are much fainter than the Ori H II region.
Figures 1d, 1e, and 1f show several line-ratio combinations: [S II]/[N II], [N II]/H, and [S II]/H. These reveal that the H II region has distinct spectral properties compared to the more diffuse surrounding emission—in addition to its elevated optical line intensities. The spatial distribution depicted in these maps complements the quantitative analysis in sections below that derive physical conditions of the gas surrounding Ori.
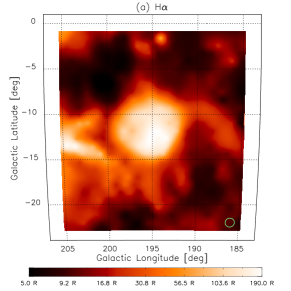
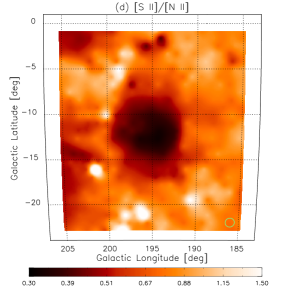
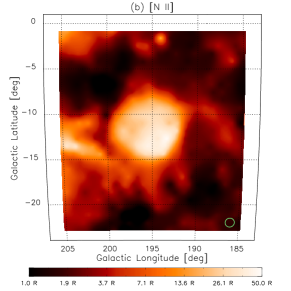
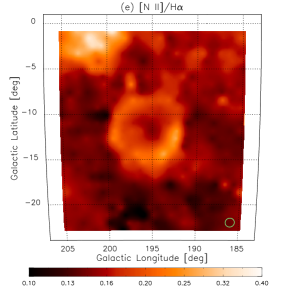
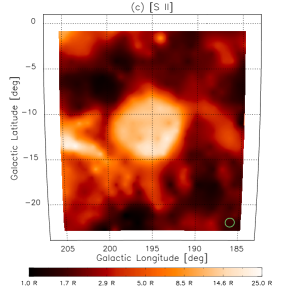
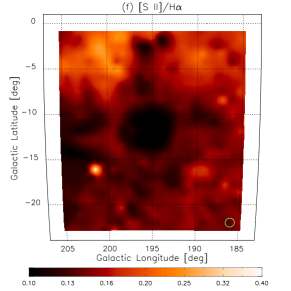
Figure 2 shows a pair of sample individual spectra in each of the three lines along two different lines of sight in the region. The spectra highlighted in Figure 2 are toward the brightest direction of the H II region at and one away at . The spectra are plotted as intensity (R/(km s-1)) versus LSR velocity (km s-1). The total integrated intensity of the emission lines is labeled in the upper left corner of each plot. Note that the intensity of [S II] and [N II] increases relative to H in fainter regions, as can also be seen in Figures 1e and 1f. In sections below, we often concentrate on the H II region—observations within of Ori. These bright spectra are dominated by the nebular emission and are fit well by a single Gaussian. This region of focus spans roughly to and to .
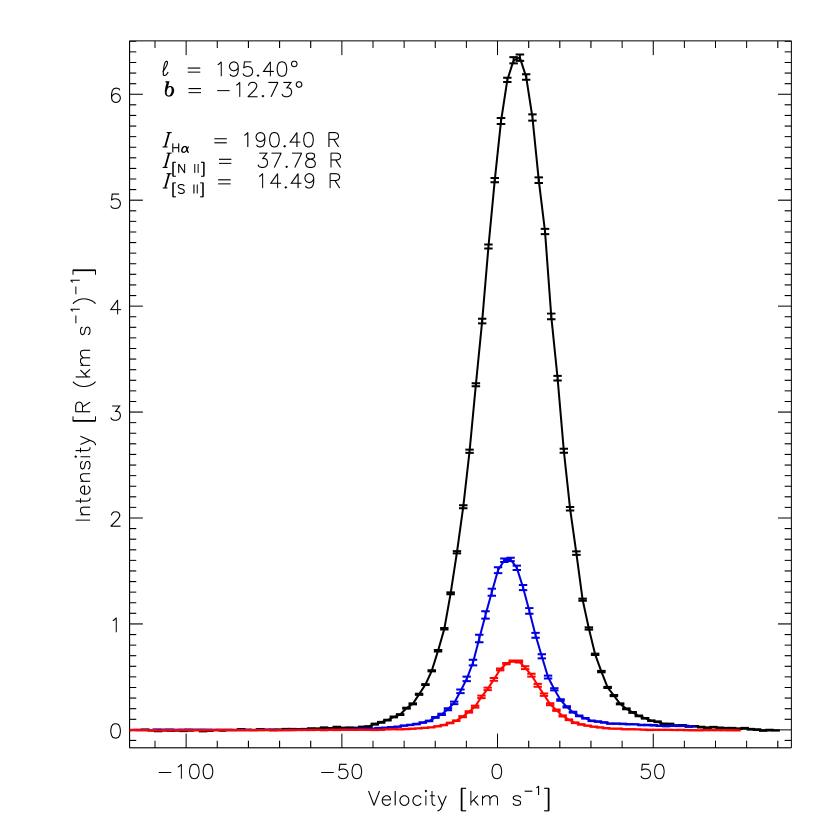
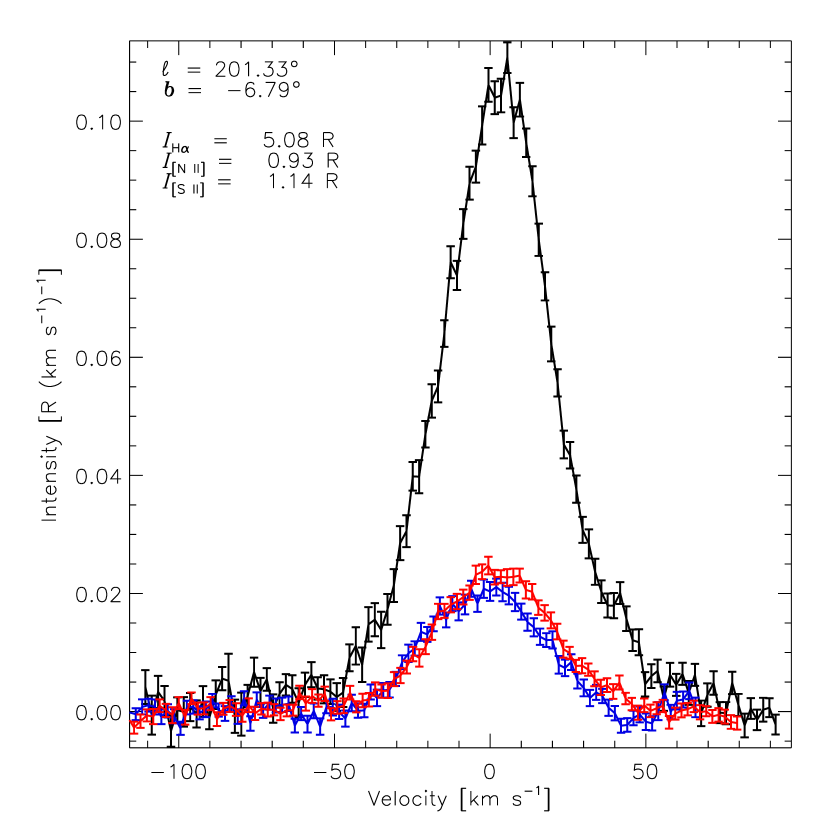
Table 1 summarizes several basic properties for a line of sight centered near Ori. We adopt the selective extinction parameter, , from photometry and intrinsic colors presented in Cruz-González et al. (1974); spectral type from Maìz-Appellaniz et al. (2004); and distance from Dolan & Mathieu (2001). Using this distance, we calculate the distance away from the Galactic mid-plane, , where is the distance to Ori, and is the Galactic latitude. Beams with elevated H extend to approximately , which then leads to an estimate of the physical radius of the H II region, . The values for and are computed below in §3.1. Uncertainties on these last three parameters are dominated by the uncertainty in the distance to Ori.
| Parameter | Symbol | Value |
|---|---|---|
| Star | HD 36861 | |
| Spectral type | O8 III | |
| Galactic coordinates | (19505, -1200) | |
| Selective extinction | 0.12 | |
| Distance from Sun | pc | |
| Distance from Galactic Plane | pc | |
| Angular radius of H ii region | ||
| Physical radius of H ii region | pc | |
| H intensityaaAs sampled by the one-degree WHAM beam toward Ori. Higher intensity emission may exist on smaller scales. | R | |
| Emission measureaaAs sampled by the one-degree WHAM beam toward Ori. Higher intensity emission may exist on smaller scales. | EM | cm-6 pc |
| Ionizing photon luminositybbAs derived in this work. See §3.1 | ph s-1 | |
| Average H ii region densitybbAs derived in this work. See §3.1 | cm-3 |
3.1 H EMISSION
From Haffner et al. (2003),
| (1) |
where is measured in Rayleighs. Including a correction for dust extinction and assuming a temperature of 8000 K, we arrive at this standard equation from Reynolds & Ogden (1982):
| (2) |
For simplicity we assume the selective extinction, , is the same throughout the H II region as measured toward Ori. Future work will incorporate H observations to correct for each WHAM beam. The peak H intensity () is measured to be 185 R. From equation (1), we see that , and thus the ionization of the nebula. By summing over the total observed intensity of the H II region, we can estimate the luminosity of the Lyman continuum photons () produced by Ori using the following equation (from Haffner 2001):
| (3) |
where is the distance to the region, is the H intensity emitted over the solid angle , and is the extinction correction, defined observationally with . The factor 2.75 is computed from the extinction models of Cardelli et al. (1989) at H assuming the typical diffuse total to selective extinction () ratio of 3.1. is the fraction of H photons produced per Lyman continuum photon, 0.47 for gas at 8000 K (Martin, 1988). We compute the H intensity of the H II region using . Here, is the observed, integrated intensity ( to km s-1) of each spectrum, and is the intensity along the line of sight from behind and in front of the H II region. Examining the distribution of intensities in this region by taking cuts through Sh 2-264, we estimate the average background/foreground emission R.
Approximating the integral in equation (3) as a sum over WHAM beams,
| (4) |
Here, represents the solid angle subtended by a single pointing in the 1∘-circular beam of WHAM ( sr); /(N) is a correction factor that estimates gaps and overlaps of the survey grid within the H II region; and is the number of observations within a -radius region surrounding Ori. For a circular region on the sky (i.e., cone in solid angle),
| (5) |
and
| (6) |
Using the and distance in Table 1, we find ph s-1. The uncertainty on this value is dominated by the uncertainty of the distance to Ori resulting in a on our estimate of . Our calculation of is low compared to recent model calculations for O8 III stars, 1.7 1049 ph s-1 (e.g., Vacca et al., 1996). However—assuming the model reflects the true output of the star—our estimate using the H intensity of the H II region is expected to be a lower limit if any ionizing flux escapes the region. Our correction for H removed from our line of sight by dust scattering () using the selective extinction toward Ori assumes the value is constant across the nebula. We have no specific reason to expect this correction to be too low on average, but future work using H will remove this assumption.
With , we can also estimate the density () of the emitting gas. In a spherical H II region where H in the nebula is assumed to be fully ionized and constant, the recombination balance equation is:
| (7) |
where, is the recombination coefficient and equals to 3.10 1013 cm3 s-1 for gas at K (Osterbrock, 1989). Then,
| (8) |
In this equation, is in units of ph s-1, is in pc, and is in cm-3. With R pc and we find cm-3.
3.2 [S II] AND [N II] LINE RATIOS
The relative intensities of metal-line emission to H and each other can reveal information about the ionization state and temperature of diffuse ionized gas (e.g., Haffner et al., 1999; Reynolds et al., 1999; Madsen et al., 2006). We use the H, [S II], and [N II] intensity maps shown in Figure 1 to examine [N II]/H, [S II]/H, and [S II]/[N II] emission line ratio behavior. The H intensity decreases by a factor of approximately 19 from the center to the edge of the H II region (with our one-degree beam sampling), from R near the center to R on the periphery of the area under analysis. However, line ratios vary by much less. The [S II]/H ratio increases from at the center to at the edge, and the [N II]/H ratio increases from at the center to at the edge of the nebula, factors of 2 and 1.75 from the center to the edge of the nebula, respectively. The [S II]/[N II] ratio also increases by about a factor of 2.5 from at the center to at the edge. The range of in the [S II]/H, [N II]/H, and [S II]/[N II] line ratios for this diffuse nebula are not too different from those seen in the WIM (e.g., Madsen et al., 2006), but the trends show different behaviors.
Past studies of diffuse H, [S II], and [N II] and more recent investigations of the WIM carried out with WHAM show that there is a good correlation between the line ratios and variation in the temperature of the WIM (Reynolds, 1985a, 1988; Haffner et al., 1999; Reynolds et al., 1999). Haffner et al. (1999) suggested that the tight correlation of [S II]/[N II] seen in their data arose simply from the dominance of S+ and N+ ionization states in this gas together with similar excitation energy of these two emission lines. They derived estimates of the electron temperature and ionization state of sulfur for a large region of the sky. While all their assumptions for the WIM are not valid in a classical H II region since the ionization structure of emission nebulae changes significantly over smaller scales, the techniques used to examine the line ratio behavior are still useful here.
The basic equation for the intensity of emission lines from collisionally excited ions found in Osterbrock (1989) and Haffner et al. (1999) is given as:
| (9) |
where is in units of ph s-1 cm-2 sr-1, is the collision strength of the transition, wi is the statistical weight of the ground level, Eij is the energy of the upper level of the transition above the lower, ni and ne is the ion and electron density, respectively, k is Boltzmann’s constant, T is the temperature of the gas, dl is the pathlength through the emitting region, and is the fraction of downward transitions that produce the emission line in question (e.g., Osterbrock, 1989; Haffner et al., 1999).
The intensities of [S II] 6716 and [N II] 6583 emission are then:
| (10) |
and
| (11) |
where is in units of 104 K and EM is related to in equation (1). The ratio of the metal emission lines is then:
| (12) |
Haffner et al. (1999) adopted parameters for (S/H) from Anders and Grevesse (1989) and (N/H) from Meyer et al. (1997) for the gas-phase abundances of S and N. This ratio is insensitive to temperature because of the nearly identical energies required to excite the lines. As a result, when [S II]/[N II] is seen to be constant throughout a spatial region, also changes little.
Models (Sokolowski, 1994; Sembach et al., 2000) have shown in diffusely ionized regions (e.g., the WIM, IVCs, HVCs, etc.) N+/N0 tracks H+/H0 because of their similar first ionization potentials (14.5 eV and 13.6 eV, respectively) and a weak charge-exchange reaction. This relationship allows us to use equation (11) as a rough estimate of the electron temperature within the emitting gas. Furthermore, in these regions where the fractional ionization of H has been also measured to be near unity (Reynolds et al., 1998; Madsen et al., 2006) and higher ionization species such as He+ and O++ are extremely faint or not detected (Reynolds & Tufte, 1995; Tufte, 1997; Howk & Savage, 1999; Madsen et al., 2006), N+ should be the dominant ion state with N – 1.0 (Haffner et al., 1999). On the other hand, S has a second ionization potential of 23.4 eV, just below neutral He at 24.6 eV. As a result, it is likely partially ionized to S++. Using this justification and equation (12), Haffner et al. (1999) estimated ionization states of S+/S that range between about 0.25 and 0.8 in the WIM, with an average in the local diffuse background of 0.6 – 0.65. Such ratios have been found to be systematically higher in the WIM than in classical H II regions (e.g., Reynolds, 1988; Reynolds et al., 1999; Haffner et al., 1999). The lower S+/S ratios in H II regions is somewhat expected since the ionization parameter () is large and S+ is ionized to S++ more readily, which produces a corresponding decrease in the observed [S II] intensity relative to H (Domgörgen & Mathis, 1994; Sokolowski, 1994; Haffner et al., 1999). However, Haffner et al. (1999) show that a higher electron temperature () in the WIM will also increase the [S II]/H ratio.
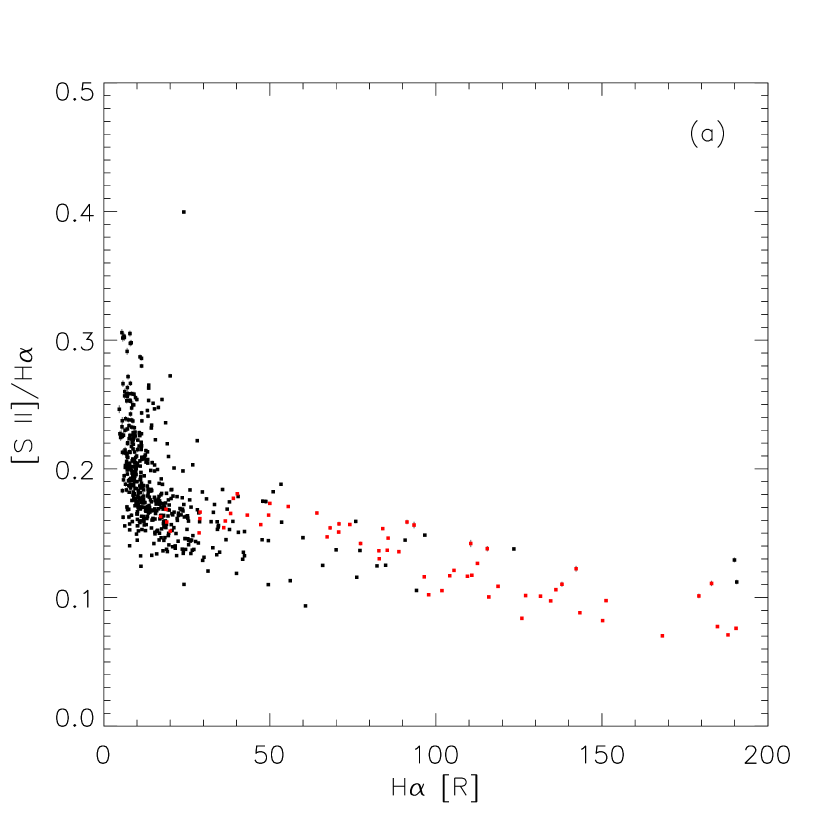
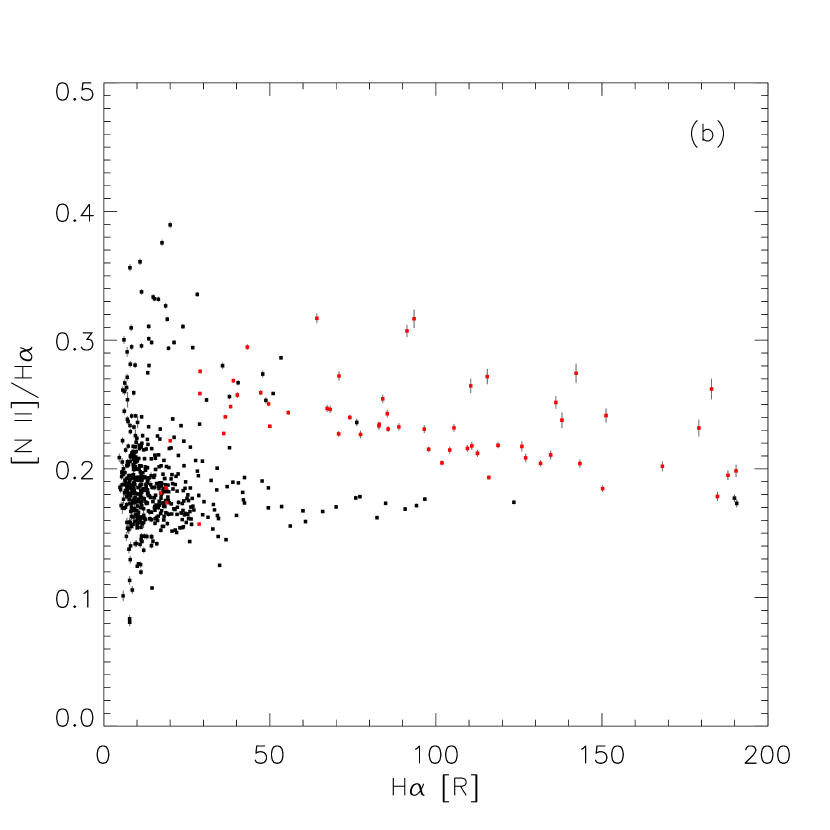
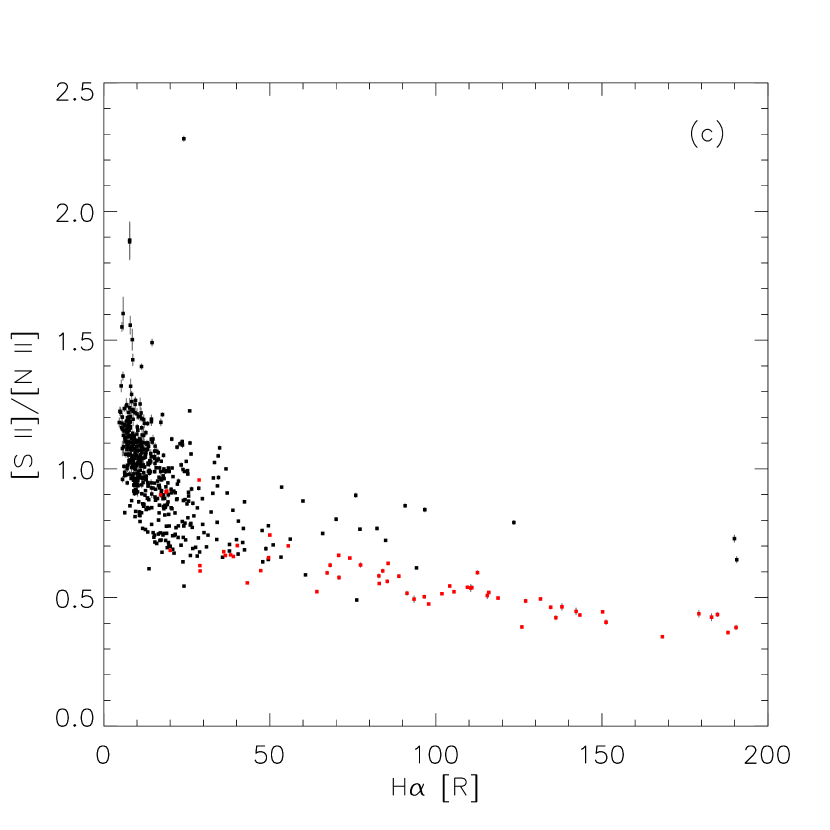
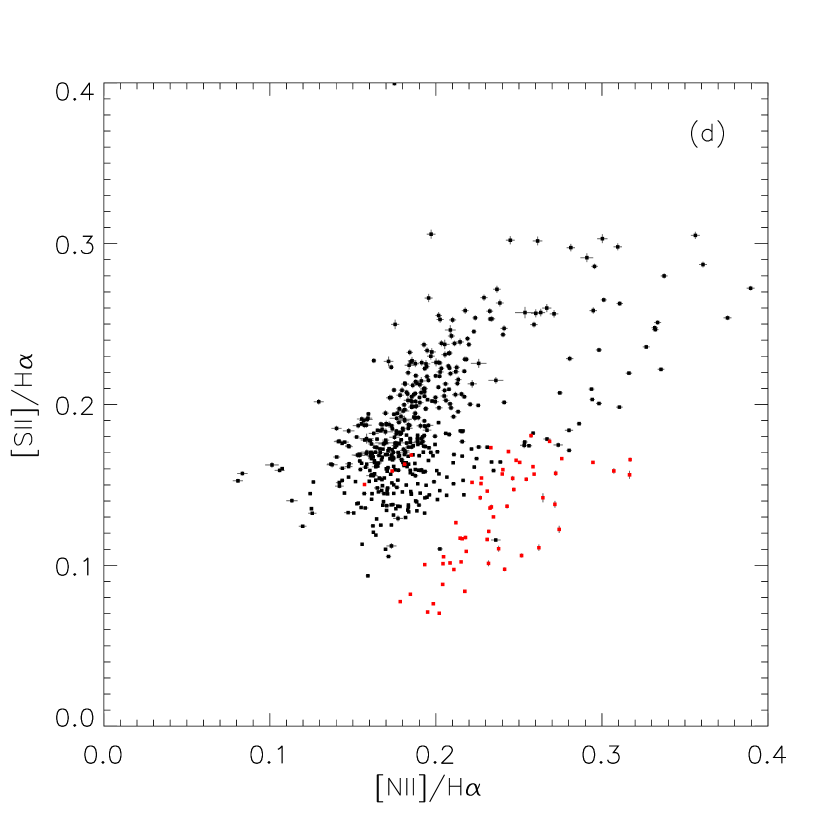
Figure 3 shows the behavior of [S II]/H, [N II]/H and [S II]/[N II] as a function of H intensity as well as [S II]/H vs. [N II]/H throughout this region containing Sh 2-264. The core of the H II region, observations within 4° of Ori, are highlighted in red. In general, Figure 3a shows a marked increase in [S II]/H ratio with decreasing H intensity, both inside and outside the H II region. A trend in the [N II]/H ratio in Figure 3b is less pronounced, although the H II region has a distinctly elevated track in this ratio, which is visible as the radial gradient close to the star in Figure 1e. As equation (12) shows, Figure 3c ([S II]/[N II] vs. H) is fairly insensitive to temperature so that variation is dominated by the ion ratio (S+/N+). Figure 3d plots [S II]/H and [N II]/H against one other, with the H II region again occupying a distinct area of the figure. The distinct separation of H II regions from the more diffuse background is common in these studies (e.g., Figures 7 & 13 of Madsen et al. 2006) and highlights the different natures of the radiation field near ionizing sources and out in the diffusely ionized and more widely distributed ISM.
3.3 LINE WIDTHS
We can use the widths (FWHM) of H and [S II] emission lines to measure temperature and nonthermal velocity throughout the Ori H II region. This method was utilized by Reynolds (1985a) to show that the properties of diffuse gas along several lines of sights in the WIM differs from those in classical H II regions. The temperature and nonthermal velocity of the emitting gas in Sh 2-264 can be derived from the total line widths of [S II] and H, if the emission lines originate from ions that are uniformly mixed within the H II region (Reynolds, 1985b, 1988).
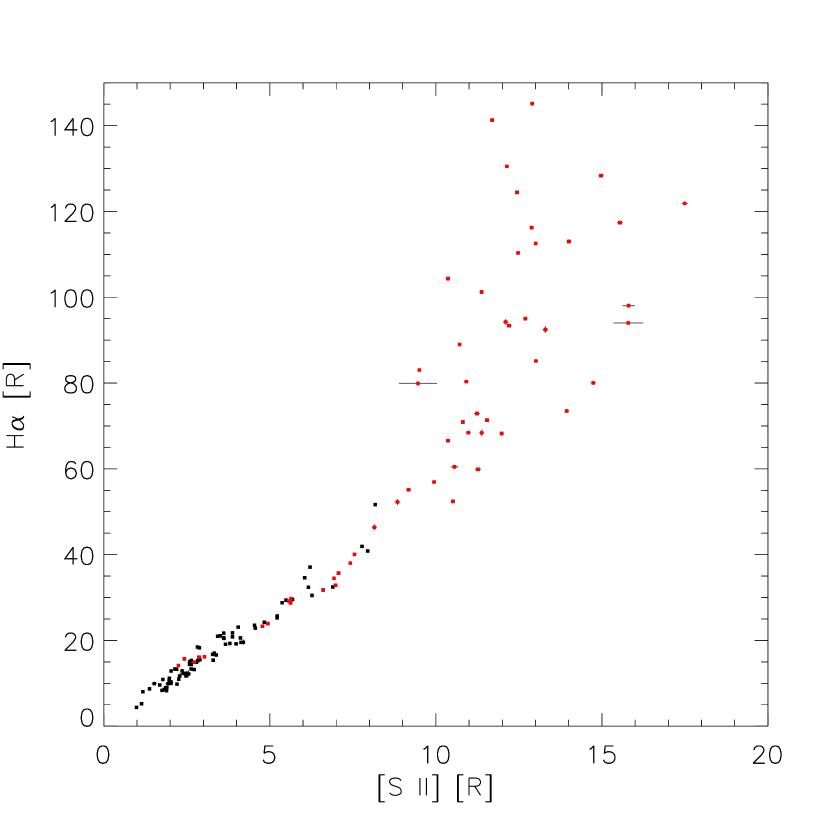
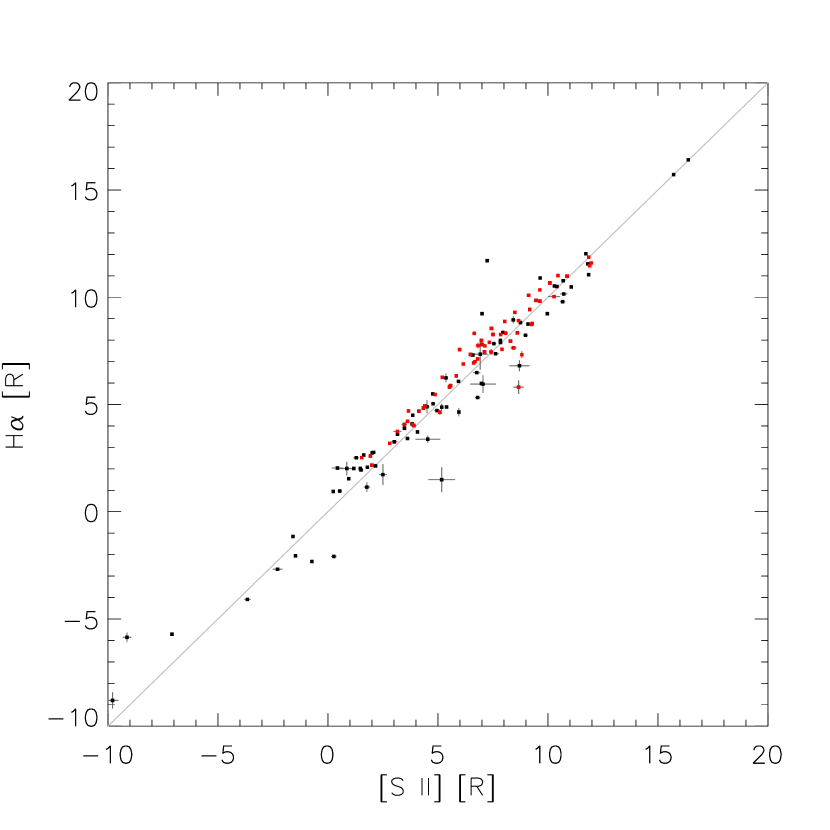
Some evidence that the ions share a kinematic profile is provided by Figure 2 above, which shows the agreement in the shape and extent of the line profiles of [S II] and H emission. Further confidence comes from comparing some of the quantitative properties of the line emissions. In Figure 4, we plot the intensity of the H emission against the intensity of corresponding [S II] emission. This figure reveals that the [S II] is generally correlated with H (deviations are highlighted in the [S II]/H ratio plot of Figure 3a). Furthermore, the peak of these lines track each other in radial velocity as seen in Figure 5. The correlation in the plots of Figures 4 and 5 as well as the similarity in shape of the line profiles in Figure 2 provide sufficient evidence that components within the two lines originate from the same region of gas for the purpose of our analysis. However, our ability to accurately derive the widths decreases when the H II region component becomes comparable to the foreground and/or background emission in this complex area of the Galaxy. For the rest of this analysis, we use only the observations within a 4∘-radius of Ori where we are able to isolate the H II region emission.
The H and [S II] total line widths (FWHM), and , are given by:
| (13) |
and
| (14) |
where is temperature as measured by the ion speeds and is the most probable speed of the nonthermal velocity distribution; the extra 0.070 term in equation (13) accounts for width due to the fine structure of the H line (Reynolds, 1985a). It is reasonable to treat the nonthermal radial velocity distribution as a Gaussian because the [S II] components, whose widths are dominated by nonthermal motions at these temperatures (see equation (14) and the limit on and ) are well-fit by Gaussian profiles.
The mode of the nonthermal velocity distribution, or most probable speed , and the gas temperature are then given by:
| (15) |
| (16) |
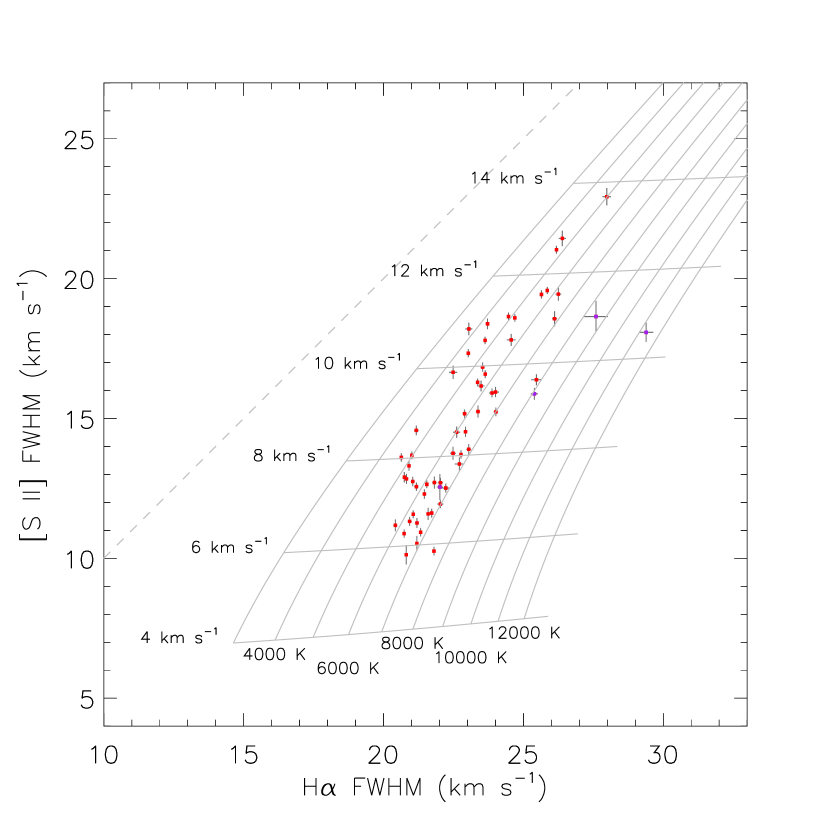
A grid of the resulting values for and is superposed onto Figure 6, a plot of the observed widths of H and [S II] along lines of sight throughout the H II region. Note that as with Figures 4 and 5, there is general correlation between the widths of the two lines, suggesting that the same underlying physical conditions drive the formation of the line profiles of each element and that the emission arrises from the same region. Although the H II region emission is the dominant component in these spectra within 4∘of Ori, a few on the edge of the region show noticeable blending with a second component. Examining the ratio of the intensities of the H II region component () to the secondary component (), we define blended directions as those having in either H or [S II]. These directions generally correspond with outliers or points with larger errorbars in Figure 6, which we highlight in purple.
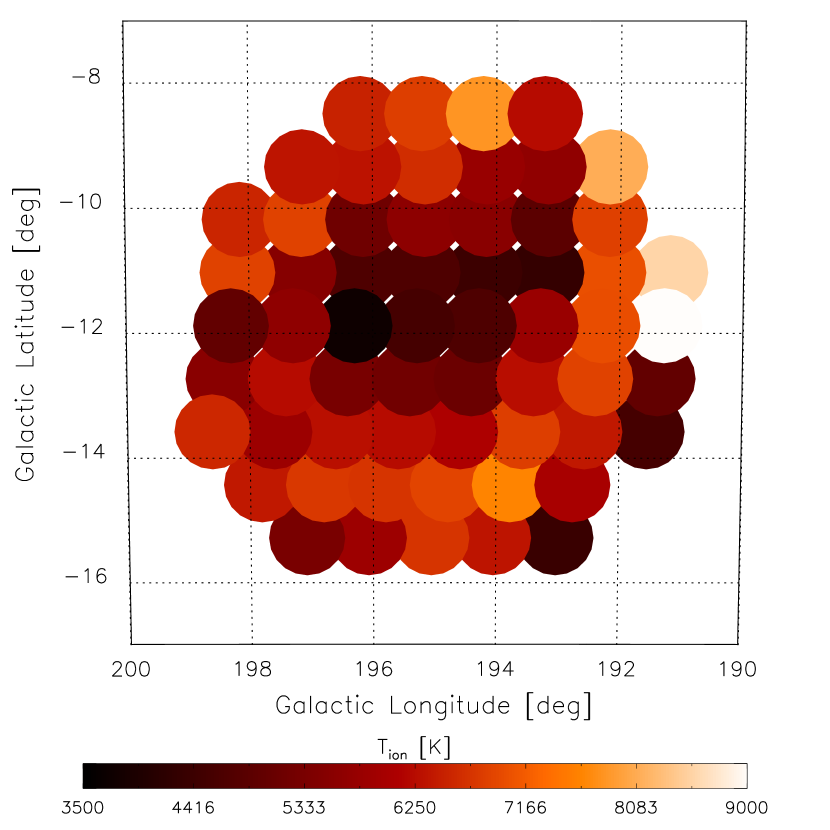
We mapped the spatial trends of these temperature and nonthermal velocity parameters (Figures 7 & 8). Using this analysis, the ion temperature throughout the nebula ranges from about 4000 K to 8000 K, with the higher values in the outer parts of the nebula. Such a trend is not unexpected close to an ionizing source. Near the source of an H II region the ionization rate is high and due to their high interaction cross-section, photons with energy closest to 13.6 eV are used up. Higher energy photons escape to the edge of the H II region and can heat the surrounding gas to higher temperatures. Heiles et al. (2000) derived similar average temperatures for H II region as a whole by comparing radio and H emission.
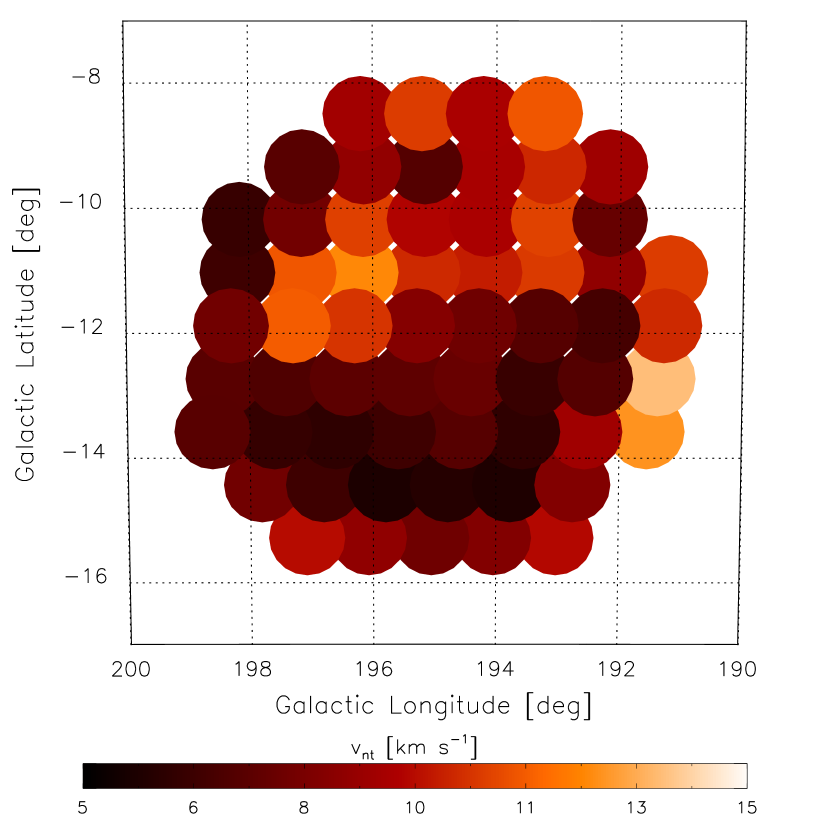
The nonthermal velocity map (Figure 8) reveals a decrease in velocity from about 10 km s-1 to 5 km s-1 from the center to the edge of the lower half of the map, perhaps revealing the expansion of the H II region. In the upper half, nonthermal velocities are noticeably higher. We note that this area of increased nonthermal component corresponds to the “trunks” of evaporating material that are more prominent in this portion of the nebula (e.g., Figure 5 of Ochsendorf et al., 2015). With WHAM’s limited spatial resolution in its survey mode, we can only speculate that ablation and flow from these active regions contributes to a more complex velocity profile. The nonthermal velocities at the edge of our studied region appear to increase. This effect could be caused by emission from the nebula diminishing to an intensity comparable to emission elsewhere along the line of sight (e.g., from the WIM or other diffuse portions of the Orion-Eridanus region). When the line profile is no longer dominated by a single component, these derived values become less valid without more complex procedures to isolate the H II region.
The [N II]/H ratio also has the potential to provide an estimate of the electron temperature throughout the nebula. Combining equations (2) and (11), we have:
| (17) |
where is electron temperature in units of 104 K and (N/H) is the gas phase abundance of nitrogen. We use the N/H gas-phase abundance of from Meyer et al. (1997). Starting with the simplest assumption that in the H II region, our equation for ratio then becomes:
| (18) |
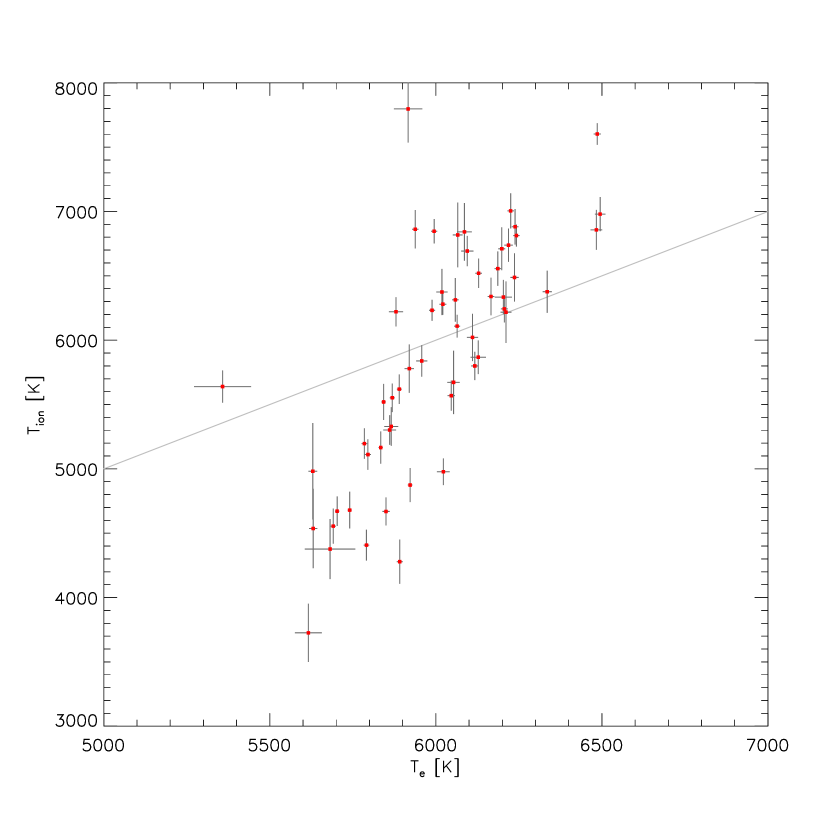
Using this equation and the [N II]/H line ratio of the H II region emission components, we can derive an electron temperature at each location. Unfortunately, cannot be determined independently using these observations alone. To provide some basic reference, we use in Figure 9 to compare the and values from these two different methods. Lowering moves points to the right in this plot as higher is then required to produce the same [N II] emission. It is clear that applying a single value of throughout the nebula will not lead to better agreement between the two methods. Although the temperatures do correlate, they span different ranges. For the slope of the data points between our methods to trend toward unity using the simplified equation (18), would need to decrease with radius. But since the trend in N ionization is important at this point, we should also return to equation 17 and remove the simple assumption . Now we see that becomes the factor that must decrease with radius for our methods to agree. This ratio is difficult to isolate with only the lines we present here. The addition of more emission lines maps, such as [O III], [He I], and H, as well as modeling, which will help us examine the changes in ionization state throughout the nebula, are in progress for a future work.
4 SUMMARY
We have presented multiwavelength observations of H, [S II], and [N II] toward the H II region surrounding Ori. From these spectra we have produced velocity-resolved maps. The line-ratio maps that compare [S II] and [N II] to that of H reveal an increasing trend that is dependent on radius. While variations in these ratios are similar to what is observed in the WIM, the ratios in the H II region have significantly lower values. Using the H intensity distribution, we have estimated , the Lyman continuum output from Ori, as well as , the average electron density of the H II region. From the widths of H and [S II], we derive the spatial structure of the ion temperature (4000 K to 8000 K) and nonthermal velocity (5 km s-1 to 10 km s-1) throughout the nebula. We also show a measure of the electron temperature from the relative intensities of [N II] and H and characterize the difference in the two methods of obtaining temperature. Values generally correlate between the two methods and reinforce general trends within the nebula. However, the differences (and trend in differences) between the temperatures determined from these methods is larger than explained by measurement error. For such diffuse, locally-ionized regions, the ionization structure changes significantly throughout the nebula that simple assumptions are insufficient to extract reliable temperatures from the intensity ratio method. Relying on observations alone, we find the widths of S and H emission profiles lead to more robust results. Observations of additional emission lines combined with more sophisticated modeling will allow these data to further constrain the ionization structure.
References
- Anders & Grevesse (1989) Anders, E., & Grevesse, N. 1989, Geochim. Cosmochim. Acta, 53, 197
- Cardelli et al. (1989) Cardelli, J. A., Clayton, G. C., & Mathis, J. S. 1989, ApJ, 345, 245
- Cruz-González et al. (1974) Cruz-González, C., Recillas-Cruz, E., Costero, R., Piembert, M., & Torres-Piembert, S. 1974, Rev. Mexicana Astron. Astrofis., 1, 211
- Dennison et al. (1998) Dennison, B., Simonetti, J. H., & Topasna, G. A. 1998, Publ. Astron. Soc. Australia, 15, 147
- Dolan & Mathieu (2001) Dolan, C. J., & Mathieu, R. D. 2001, AJ, 121, 2124
- Dolan & Mathieu (2002) Dolan, C. J., & Mathieu, R. D. 2002, AJ, 123, 387
- Domgörgen & Mathis (1994) Domgörgen, H., & Mathis, J.S. 1994, ApJ, 428, 647
- Gaustad et al. (2001) Gaustad, J. E., McCullough, P. R., Rosing, W., & Van Buren, D. 2001, PASP, 113, 1326
- Haffner et al. (1999) Haffner, L. M., Reynolds, R.J., & Tufte, S. L. 1999, ApJ, 523, 223
- Haffner (2001) Haffner, L. M. 2001, in ASP Conf. Ser. 231, Tetons 4: Galactic Structure, Stars and the Interstellar Medium, ed. C. E. Woodward,M.D. Bicay, & J. M. Shull (San Francisco: ASP), 345
- Haffner et al. (2003) Haffner, L. M., Reynolds, R. J., Tufte, S. L., Madsen, G. J., Jaehing, K. P., & Percival, J. W. 2003, ApJS, 149, 405
- Hausen et al. (2002) Hausen, N. R., Reynolds, R. J., Haffner, L. M., & Tufte, S. L. 2002, ApJ, 565, 2, 1060
- Heiles et al. (2000) Heiles, C., Haffner, L.M., Reynolds, R.J. & Tufte, S.L. 2000, ApJ, 536, 335
- Howk & Savage (1999) Howk, J. C., & Savage, B. D. 1999, ApJ, 517, 746
- Madsen et al. (2006) Madsen, G. J., Reynolds, R. J. & Haffner, L. M. 2006, ApJ, 652, 1, 401
- Maìz-Appellaniz et al. (2004) Maìz-Appellaniz, J., Walborn, N. A., Galue, H. A., & Wei, L. H. 2004, ApJ, 151, 103
- Martin (1988) Martin, P. G. 1988, ApJS, 66, 125
- Mathieu (2008) Mathieu, R. D. 2008, in Handbook of Star Forming Regions, Volume I: The Northern Sky, ed. B. Reipurth, ASP Monograph Publications, Vol. 4 (Astronomical Society of the Pacific: San Francisco), 757
- Meyer et al. (1997) Meyer, D. M., Cardelli, J. A., & Sofia, U. J. 1997, ApJ, 490, L103
- Mierkiewicz et al. (2006) Mierkiewicz, E. J., Roesler, F. L., Nossal, S. M., & Reynolds, R. J. 2006, JASTP, 68, 1520
- Nossal et al. (2006) Nossal, S. M., Mierkiewicz, E. J., Roesler, F. L., Reynolds, R. J., & Haffner, L. M. 2006, JASTP, 68, 1553
- Ochsendorf et al. (2015) Ochsendorf, B. B., Brown, A.G.A., Bally, J., & Tielens, A. G. G. M. 2015, ApJ, 808, 111
- Osterbrock (1989) Osterbrock, D.E. 1989, Astrophysics of Gaseous Nebulae and Active Galactic Nuclei (Mill Valley: Unitversity Science Books)
- Reynolds & Ogden (1982) Reynolds, R. J. & Ogden P. M. 1982, AJ, 87 , 2
- Reynolds (1985a) Reynolds, R. J. 1985a, ApJ, 294, 256
- Reynolds (1985b) Reynolds, R. J. 1985b, ApJ, 298, L27
- Reynolds (1988) Reynolds, R. J. 1988, AJ, 96, 670
- Reynolds & Tufte (1995) Reynolds, R. J. & Tufte, S. L. 1995, ApJ, 439, L17
- Reynolds et al. (1998) Reynolds, R. J., Tufte, S. L., Haffner, L. M., Jeahnig, K., & Percival J. W. 1998, Publ. Astron. soc. Aust., 15, 14
- Reynolds et al. (1999) Reynolds, R. J., Haffner, L. M., & Tufte, S. L. 1999, ApJ, 525, L21
- Reynolds et al. (2002) Reynolds, R. J., Haffner, L. M., & Madsen, G. J. 2002, Three-Dimensional Studies of the Warm Ionized Medium in the Milky Way using WHAM, in ASP Conference Proceedings 282: Galaxies: The Third Dimension, eds. M. Rosado, L. Binette, L. Arias (San Francisco: ASP), 31
- Sembach et al. (2000) Sembach, K. R, Howk, J. C., Ryans, R. S. I., & Keenan, F. P. 2000, ApJ, 528, 1, 310
- Scherb (1981) Scherb, F. 1981, ApJ, 243, 644
- Sokolowski (1994) Sokolowski, J. 1994, in ASP Conf. Series. 35, Massive Stars: Their Lives in the Interstellar Medium, eds. J. P. Cassinelli & E. B. Churchwell, 540
- Tufte (1997) Tufte, S. L. 1997, PhD thesis, University of Wisconsin-Madison
- Vacca et al. (1996) Vacca, W. D., Garmany, C. D., & Shull J. M. 1996, ApJ, 460, 914