Coupled commensurate charge density wave and lattice distortion in Na2TiO ( As, Sb) determined by X-ray diffraction and angle-resolved photoemission spectroscopy
Abstract
We report single crystal X-ray diffraction measurements on Na2TiO ( = As, Sb) which reveal a charge superstructure that appears below the density wave transitions previously observed in bulk data. From symmetry-constrained structure refinements we establish that the associated distortion mode can be described by two propagation vectors, and , with (Sb) or (As), and primarily involves in-plane displacements of the Ti atoms perpendicular to the Ti–O bonds. We also present angle resolved photoemission spectroscopy (ARPES) measurements, which show band folding and back bending consistent with a density wave with the same wave vectors and associated with fermi surface nesting, and muon-spin relaxation data, which show no indication of spin density wave order. The results provide direct evidence for phonon-assisted charge density wave order in Na2TiO and fully characterise a proximate ordered phase that could compete with superconductivity in doped BaTi2Sb2O.
I Introduction
The appearance of superconductivity in the neighbourhood of other symmetry-breaking ground states is a prominent characteristic of many unconventional superconductors.Monthoux et al. (2007) In some theoretical scenarios strong fluctuations of the proximate order parameter can contribute to the pairing interaction, so it is important to establish the identity of the competing orders and to determine the relevant broken symmetries.
The proximity of superconductivity to spin density wave (SDW) order is known in a range of different systems, and is a particularly robust feature of the iron-based superconductors. In these materials, the SDW is believed to be assisted by partial nesting of quasi-two-dimensional electron and hole Fermi surface pockets,Mazin et al. (2008); Scalapino (2012) and the strong spin fluctuations that remain after suppression of the SDW are widely thought to play a central role in mediating unconventional superconductivity.Chubukov (2012) Interplay between superconductivity and charge density wave (CDW) formation is less often encountered but is known in several transition-metal chalcogenides and oxides,Wilson et al. (1975); Morosan et al. (2006); Yokoya et al. (2005); Mattheiss and Hamann (1988) especially the layered copper oxides where CDW order is found to compete with superconductivity in several hole-doped materials near 1/8 doping. Tranquada et al. (1995); Fujita et al. (2004); Croft et al. (2014); da Silva Neto et al. (2014); Wu et al. (2011); Ghiringhelli et al. (2012); Chang et al. (2012) Theoretical work suggests that charge fluctuations near the onset of CDW order may play an important role in the superconducting pairing mechanism.Wang and Chubukov (2015)
The tetragonal layered titanium oxypnictides Lorenz et al. (2014) TiO ( Ba, Na2, (SrF)2, (SmO)2; As, Sb, Bi) share structural similarities with the layered copper oxide and Fe-based families of superconductors and display anomalies in magnetic, transport and thermal data at various temperatures up to 400 K which have been interpreted to indicate density wave (DW) transitions.Adam and Schuster (1990); Axtell et al. (1997); Ozawa et al. (2000, 2001); Liu et al. (2009, 2010); Wang et al. (2010); Yajima et al. (2012) The recent discovery of superconductivity in BaTi2Sb2O at K in the vicinity of a possible DW phase appearing at K has renewed interest in this family of materials.Yajima et al. (2012); Doan et al. (2012) Substitution of Na for Ba increases up to 5.5 K with concomitant gradual suppression of the DW transition.Doan et al. (2012) A similar anticorrelation between and has been observed with other substitutions indicating competition between the superconducting and DW phases, although there remain large regions of the phase diagrams in which they appear to coexist.Yajima et al. (2013); Zhai et al. (2013); Nakano et al. (2013); Pachmayr and Johrendt (2014); von Rohr et al. (2014)
Many attempts have been made to identify the DW phase in the titanium oxypnictides. Electronic structure models predict a highly anisotropic Fermi surface with box-like electron and hole pockets that are quite well nested and therefore susceptible to either SDW or CDW instabilities Pickett (1998); de Biani et al. (1998); Singh (2012); Wang et al. (2013); Yan and Lu (2013); Suetin and Ivanovskii (2013); Yu et al. (2014). The calculations indicate that strong electron–phonon coupling could induce a superlattice distortion and accompanying CDW.Subedi (2013); Nakano et al. (2016) The predicted Fermi surface agrees well with data from angle-resolved photoemission spectroscopy (ARPES), which also shows evidence for gap formation at the DW transitions on parts of the Fermi surface.Tan et al. (2015); Song et al. (2016) An initial neutron powder diffraction study revealed anomalies in the lattice parameters of Na2Ti2Sb2O at K.Ozawa et al. (2000) Subsequent electron and neutron diffraction studies of TiO compounds have not found any bulk magnetic or charge superstructure associated with a SDW or CDW ordering,Nozaki et al. (2013); Frandsen et al. (2014) although there is evidence for tetragonal symmetry breaking in BaTi2(As,Sb)2O from neutron diffraction Frandsen et al. (2014) and nuclear quadrupole resonance (NQR),Kitagawa et al. (2013) and in Na2Ti2As2O from Raman scattering Chen et al. (2016). Muon-spin relaxation (SR) studies of Na-doped BaTi2(As1-xSbx)2O did not detect any static magnetic moments, leading to the conclusion that the DW phase is most likely a CDW,Nozaki et al. (2013); von Rohr et al. (2013) and the NQR study concluded that only a commensurate CDW could explain the data.Kitagawa et al. (2013) The lack of any evidence for an accompanying CDW superstructure, however, has recently prompted proposals that the DW phase is either some form of intra- unit cell orbital nematic state,Frandsen et al. (2014); Nakaoka et al. (2016) or is characterized by an orbital polarization that takes place without any lowering of symmetry.Kim and Kee (2015)
In this work we studied Na2Ti2Sb2O and Na2Ti2As2O by single crystal X-ray diffraction, SR and ARPES. We identify the DW phase as a commensurate two-q CDW through the accompanying structural distortion. The distortion results in a superstructure within the Ti2O layers with transverse displacements of the Ti atoms and much smaller shifts in the Sb/As and Na positions. The results explain the observation of band folding consistent with the CDW propagation vectors in our ARPES data, and imply a strong electron–phonon coupling which could be responsible for superconductivity in doped BaTi2Sb2O.
II Experimental details
Single crystals and powder samples of Na2Ti2Sb2O and Na2Ti2As2O were prepared by the method described by Shi et al.,Shi et al. (2013) with magnetic and electrical measurements confirming that the DW phase transitions in Na2TiO occur at K and K for Sb and As, respectively.Shi et al. (2013)
SR measurements were carried out on the EMU spectrometer at the ISIS Pulsed Muon Facility using powder samples of Na2TiO ( Sb, As) packed inside 25m silver foil packets mounted on a silver backing plate and measured at temperatures above and below using a closed-cycle refrigerator.
Temperature dependent X-ray diffraction measurements were performed on single crystal samples of Na2TiO ( Sb, As) using a Mo-source Oxford Diffraction Supernova diffractometer equipped with a liquid nitrogen flow cryostat. The diffraction data presented here on Na2Ti2As2O were collected from a large single crystal of approximate dimensions mm3, while data taken on Na2Ti2Sb2O were from a much smaller sample mm3. Additionally, synchrotron X-ray diffraction patterns were recorded from a single-crystal of Na2Ti2Sb2O at high ( 300 K ) and low ( 100 K ) temperatures on the I19 beamline Nowell et al. (2012) at the Diamond Light Source. The experiment was conducted in the experimental hutch EH1 using an incident monochromatic beam at the Zr edge with a wavelength of 0.6889 Å, and a 4-circle diffractometer with a CCD detector. The Helix device installed on the beamline was used to cool the sample below its transition temperature using a flow of helium. These materials are air-sensitive and were coated with vacuum grease to prevent decomposition during diffraction measurements. Data from both compounds show some disorder along the -axis likely due to random stacking faults which may be anticipated in systems with weak inter-layer chemical bonding.
All Bragg peaks in the highest temperature datasets for both compositions could be indexed in the space group, and we shall henceforth refer Bragg reflections and reciprocal lattice coordinates to the conventional unit cell with lattice parameters Å, Å ( Sb) Ozawa et al. (2000) or Å, Å ( As) Ozawa et al. (2001) at room temperature.
ARPES measurements were performed on single crystals of Na2Ti2Sb2O at beamline PGM (Plane Grating Monochromator) of the Synchrotron Radiation Center (Wisconsin), as well as at the beamline SIS (Surface and Interface Spectroscopy) of the Swiss Light Source at Paul Scherrer Institute (PSI), both equipped with a Scienta R4000 analyzer. The energy and angular resolutions were set at 15-30 meV and 0.2∘, respectively. The crystals were cleaved in situ and measured in the 24 to 150 K temperature range in a vacuum better than Torr. The ARPES data were recorded using polarized light.
III Results and analysis
III.1 X-ray diffraction
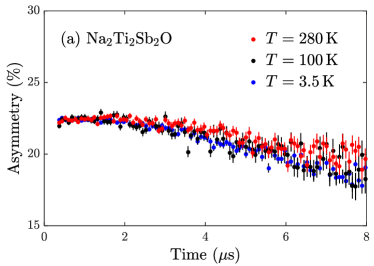
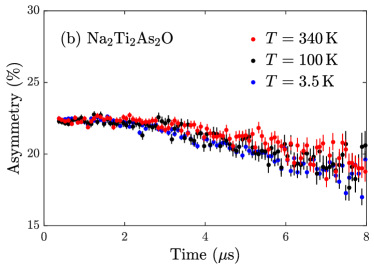
Figure 1 shows the temperature variation of the measured zero-field SR asymmetry after muon implantation. The asymmetry shows no characteristic features associated with magnetic order or magnetic fluctuations in either sample and has a very small relaxation rate which is virtually independent of temperature. Furthermore, there was no reduction in the asymmetry of the muon spin precession in a weak transverse field. This observed SR behaviour is most likely dominated by nuclear relaxation from Na and Sb/As nuclei with the very small temperature variation plausibly caused by muon diffusion at high temperatures. These results strongly indicate that the DWs in Na2TiO are most likely CDWs rather than SDWs.
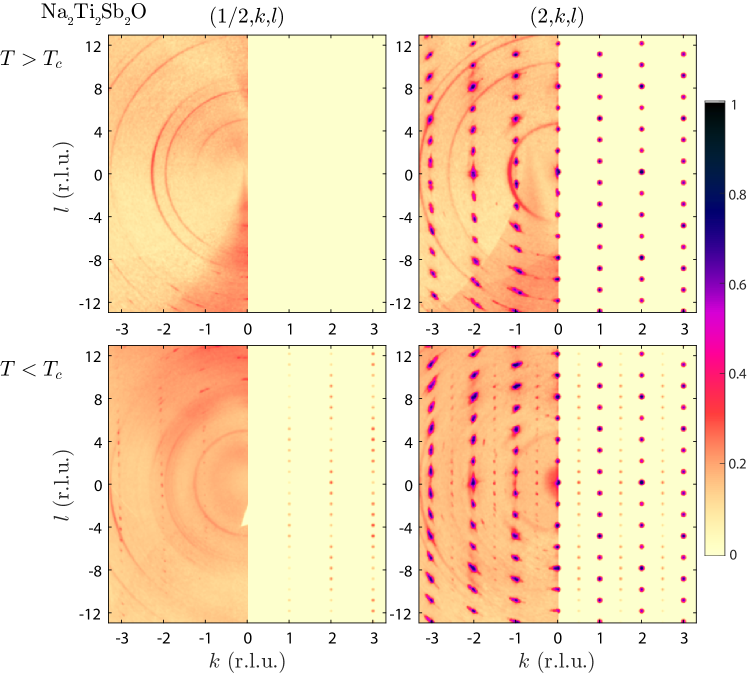
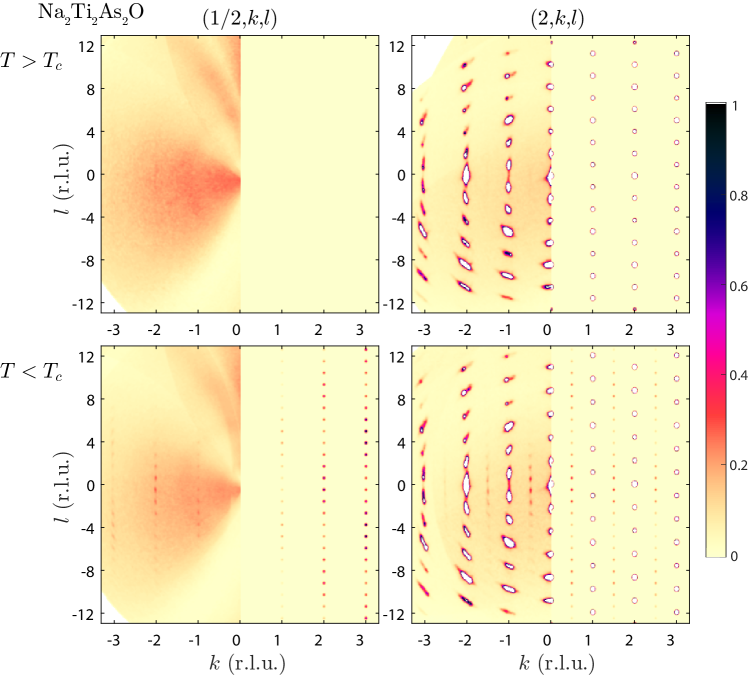
Figures 2 and 3 present X-ray diffraction intensity maps for Na2Ti2Sb2O and Na2Ti2As2O respectively in the and reciprocal space planes recorded above and below . For Sb the data reveal weak superstructure reflections at positions with indices half an odd integer, integer which vanish above , while for As a similar superstructure is observed except the peaks are shifted to half-integer positions along . This superstructure is our key experimental observation.
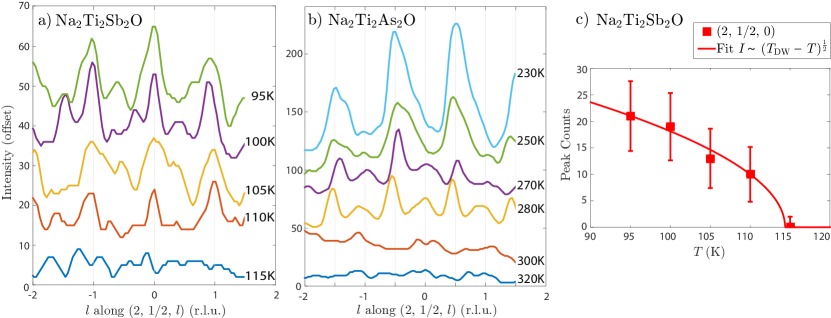
The precise positions of the superstructure and its evolution as a function of temperature close to is best seen by taking cuts through the data from the laboratory X-ray diffractometer, as shown in Fig. 4. Figure 4(a) shows the superstructure peaks in Na2Ti2Sb2O in cuts along , at several temperatures between 95 K and 115 K, Fig. 4(b) shows a similar plot for Na2Ti2As2O at temperatures between 230 K and 320 K and Fig. 4(c) follows the peak maximum intensity as a function of temperature for Na2Ti2Sb2O. The superstructure peaks were detected for temperatures below 115 K ( Sb) and 300 K ( As), consistent with the previously measured anomalies in bulk data at K ( Sb) and 320 K ( As). Mosaic broadening made it impossible to extract a reliable quantitative temperature dependence for the superstructure peaks for As.
The superstructures in both materials can be indexed (after averaging over an equal population of equivalent domains) using either a two- distortion with commensurate propagation vectors and , or a single- distortion with either of or , where and , with (Sb) or (As). Symmetry analysis for these propagation vectors yields a large number of possible distortion modes. We were able to constrain this number significantly by testing each against the qualitative features of our data shown in Figs. 2 and 3, including the periodic modulation in superstructure peak intensity along with a repeat of approximately (), preservation of absences at odd integer positions for Sb (i.e. the absences of the structure) and the fact that in the plane the modulation shifts by half a period along between odd and even positions. For each material this eliminated all except one two- mode and two single- modes. In both cases the two- mode involves Ti displacements perpendicular to the local O–Ti–O bond, whereas both single- modes involve a mixture of displacements parallel and perpendicular to O–Ti–O bonds. As transverse displacements are expected to be energetically more favourable than longitudinal ones the two- mode is the most likely distortion, so for each material we performed least-squares refinements of the two- mode against the integrated intensities of the best resolved superstructure peaks at the lowest temperatures. Further details of the symmetry analysis can be found in the Appendix.
The X-ray diffraction intensities calculated from the model are shown in Fig. 2 for Sb and in Fig. 3 for As (right half-panels), and a plot of the observed versus calculated squared structure factors in both cases is given in Fig. 5. For both materials there is reasonable agreement between the observed and calculated superstructure intensities. In particular, the intensity modulation along is well reproduced.
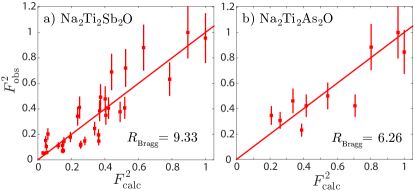
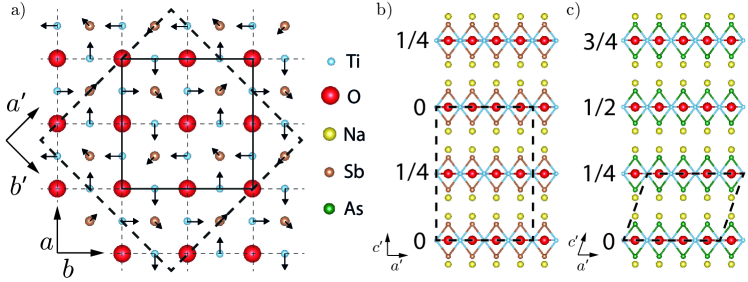
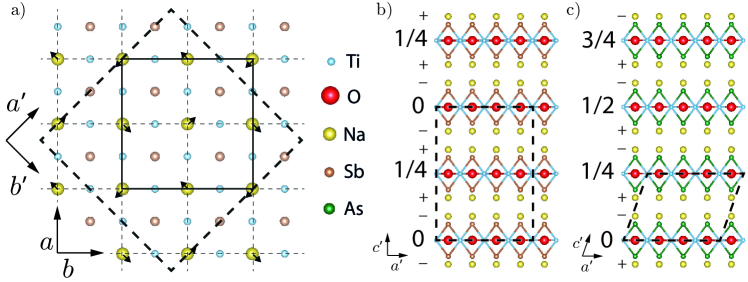
Figure 6 shows the distortion models for both materials and the relation between them. The in-plane displacement pattern of a layer of TiO units depicted in Fig. 6(a), which is the same for both compounds, is a superstructure with the most significant distortion being an in-plane shift of all the Ti atoms perpendicular to the Ti–O nearest-neighbor bonds. The magnitude of the shift is found to be about Å for Sb and Å for As. The sites immediately above and below each Ti2O plaquette undergo a smaller in-plane distortion ( Å in both cases). Best agreement with experiment for Sb is obtained when the Na layers are allowed to distort slightly (by Å) such that every Na atom moves parallel to the nearest immediately above/below it along the axis (see Appendix). We note, however, that the fit was not very sensitive to the size of the Na distortion.
In the distorted phase the isolated TiO layer has 4-fold axes through half of the O sites, which probably explains why the and lattice parameters remain virtually the same.Ozawa et al. (2000) The 4-fold axes do not coincide between layers upon stacking in the direction, so the three-dimensional superstructures do not have 4-fold symmetry. For Sb, the superstructure within one Ti2Sb2O layer displaces first by and then by , where in . The resulting structure is orthorhombic with space group and lattice vectors , and , see Figs. 6(a) and (b). In the case of As, each layer is displaced by relative to the one below resulting in a monoclinic structure with space group and lattice vectors , and , Fig. 6(c). The distortion in the As compound has period along the axis which is why the superlattice peaks appear at half-odd integer positions (half-even integer reflections are absent because the distortion of a Ti2As2O unit undergoes a phase shift of upon translation by along the axis.) The diffraction maps shown in Fig. 2 (for Sb) and in Fig. 3 (for As) are averaged over equal populations of equivalent domains.
The superstructures found here have some features in common with the distortion mode predicted from density functional theory (DFT) by Subedi Subedi (2013) for BaTi2Sb2O. Both involve transverse displacements of the Ti atoms relative to the O–Ti–O bond, and the calculated shift of Å is very close to that obtained from our model. However, the predicted distortion mode has a in-plane unit cell which has a smaller area and different propagation vectors than that obtained here and therefore cannot index some of the superstructure peaks observed in the X-ray pattern, for example the peak at (2, 1/2, 0).
III.2 Angle-resolved photoemission spectroscopy
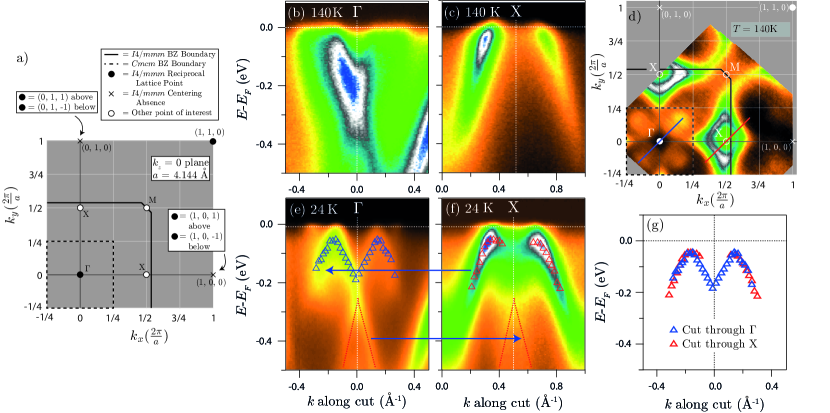
ARPES measurements were performed on Na2Ti2Sb2O in order to investigate the relationship between the lattice distortion, electronic structure and CDW. Figure 7(a) shows special points in the plane in the reciprocal space of Na2Ti2Sb2O. For the parent structure, reciprocal lattice points (all symmetry-equivalent to ) are marked with filled circles and systematic absences with crosses. At the phase transition into the distorted structure determined by x-ray diffraction all crosses ( absences) become reciprocal lattice points, as well as the X = (1/2, 0, 0) and M = (1/2, 1/2, 0) points, which are marked with empty circles. According to our model, the X and points become equivalent in the structure below , inducing a band folding from X to .
Figures 7(b), 7(c), 7(e) and 7(f) show measured band dispersions through the (b, e) and X (c, f) points above ( K) and below ( K) , and Fig. 7(d) shows the observed Fermi surface (FS) in the undistorted state at 140 K. The measured band structure at high temperature agrees with that reported in Ref. Tan et al., 2015 as well as with DFT calculations. In previous studies it has been established that there are three FS sheets, one around each of , X and M, all of which are quasi-2D and have approximately square cross-sections. The FS sheet is predicted to show a more pronounced 3D warping, although this has not yet been observed experimentally, perhaps due to limited resolution in the ARPES experiments.Tan et al. (2015) We observe all the , X and M FS pockets in our dataset, although we see only two opposite sections of the squarish FS pocket at M, which we attribute to matrix element effects. Since these three FS pockets are similar in shape at the first order, it is plausible that a CDW with wavevectors and can develop due to nesting between them as suggested by Tan et al.,Tan et al. (2015) depending on the precise 3D nature and warping of the FS sheets.
At 140 K , the band structures around and X are clearly different. While an electron band is found at , a hole band is observed at the X point, both of which cross directly (Fig. 7(b) and 7(c)). Upon cooling down to 24 K (Figs. 7(e), 7(f) and 7(g)) the and X bands fold onto each other and hybridize near , thus gapping the Fermi surface, as expected for a CDW gap formation. This band folding and the resulting back-bending can be seen in our data, particularly in Fig. 7(g) where we extract the band positions relative to the nearby high-symmetry point via Energy Distribution Curve (EDC) analysis. The folded bands coincide remarkably well, fully consistent with a CDW with the wavevectors and . This provides evidence that at least some parts of the and X FS pockets are involved in the CDW gap formation. Whether the M point FS sheet is also involved, and whether the CDW gap on each of these three FS sheets is full or only partial as a function of remain open questions that may be answered via more in-depth ARPES studies.
Our ARPES measurements cannot distinguish whether the CDW exhibits both or only one of the propagation vectors and due to the effects of domains in the single- case. However if CDWs with and do develop simultaneously (which is reasonable since and are equivalent in ) then they are expected to couple to a two- lattice distortion with the same propagation vectors and . We have detected precisely such a distortion in this work, providing a unified picture of a coupled CDW and lattice distortion appearing at K in Na2Ti2Sb2O. ARPES data have not been published for the case of As, but non-magnetic DFT calculations Yan and Lu (2013) predict a very similar Fermi surface to Sb with quasi-two-dimensional (2D) Fermi sheets around the , X and M points. Nesting vectors of the form and for some leading to associated CDWs coupled to the lattice distortion are therefore plausible in this case too.
IV Conclusion
The identification of the DW transition in the titanium oxypnictides as a lattice distortion coupled to a CDW solves the puzzle of the nature of this transition and provides a complete determination of the low temperature ordered phase including the periodicity, symmetry and lattice distortion mode. Fermi surface nesting assists the CDW to form, and the opening of a gap on nested parts of the Fermi surface explains the increase in resistivity and drop in magnetic susceptibility observed at . The observed lattice instability implies a strong electron-phonon coupling for at least this one mode, which points towards a conventional phonon-mediated mechanism for the superconducting phase found in doped BaTi2Sb2O. However, given that superconductivity appears upon suppression of the CDW transition, unconventional mechanisms involving charge fluctuations, similar to that proposed in Ref. Wang and Chubukov, 2015 for the copper oxide superconductors, cannot be ruled out. The results provide a new impetus for theoretical models of superconductivity in this system.
Acknowledgments
This research was supported by the United Kingdom EPSRC (grant nos. EP/J012912/1 and EP/J017124/1), the Diamond Light Source, National Natural Science Foundation of China (nos. 11274367, 11474330, 11474340 and 11234014), the Chinese Academy of Sciences (nos. XDB07000000 and XDB07010000), and the 973 project of the Ministry of Science and Technology of China (nos. 2011CB921701, 2011CBA00110 and 2015CB921301). RDJ acknowledges support from a Royal Society University Research Fellowship.
References
- Monthoux et al. (2007) P. Monthoux, D. Pines, and G. G. Lonzarich, Nature 450, 1177 (2007).
- Mazin et al. (2008) I. I. Mazin, D. J. Singh, M. D. Johannes, and M. H. Du, Phys. Rev. Lett. 101, 057003 (2008).
- Scalapino (2012) D. J. Scalapino, Rev. Mod. Phys. 84, 1383 (2012).
- Chubukov (2012) A. Chubukov, Annu. Rev. Condens. Matter Phys. 3, 57 (2012).
- Wilson et al. (1975) J. A. Wilson, F. J. Di Salvo, and S. Mahajan, Adv. Phys. 24, 117 (1975).
- Morosan et al. (2006) E. Morosan, H. W. Zandbergen, B. S. Dennis, J. W. G. Bos, Y. Onose, T. Klimczuk, A. P. Ramirez, N. P. Ong, and R. J. Cava, Nat. Phys. 2, 544 (2006).
- Yokoya et al. (2005) T. Yokoya, T. Kiss, A. Chainani, S. Shin, and K. Yamaya, Phys. Rev. B 71, 140504(R) (2005).
- Mattheiss and Hamann (1988) L. F. Mattheiss and D. R. Hamann, Phys. Rev. Lett. 60, 2681 (1988).
- Tranquada et al. (1995) J. M. Tranquada, B. J. Sternlieb, J. D. Axe, Y. Nakamura, and S. Uchida, Nature 375, 561 (1995).
- Fujita et al. (2004) M. Fujita, H. Goka, K. Yamada, J. M. Tranquada, and L. P. Regnault, Phys. Rev. B 70, 104517 (2004).
- Croft et al. (2014) T. P. Croft, C. Lester, M. S. Senn, A. Bombardi, and S. M. Hayden, Phys. Rev. B 89, 224513 (2014).
- da Silva Neto et al. (2014) E. H. da Silva Neto, P. Aynajian, A. Frano, R. Comin, E. Schierle, E. Weschke, A. Gyenis, J. Wen, J. Schneeloch, Z. Xu, S. Ono, G. Gu, M. Le Tacon, and A. Yazdani, Science 343, 393 (2014).
- Wu et al. (2011) T. Wu, H. Mayaffre, S. Krämer, M. Horvatić, C. Berthier, W. N. Hardy, R. Liang, D. A. Bonn, and M.-H. Julien, Nature 477, 191 (2011).
- Ghiringhelli et al. (2012) G. Ghiringhelli, M. Le Tacon, M. Minola, S. Blanco-Canosa, C. Mazzoli, N. B. Brookes, G. M. De Luca, A. Frano, D. G. Hawthorn, F. He, T. Loew, M. Moretti Sala, D. C. Peets, M. Salluzo, E. Schierle, R. Sutarto, G. A. Sawatzky, E. Weschke, B. Keimer, and L. Braicovich, Science 337, 821 (2012).
- Chang et al. (2012) J. Chang, E. Blackburn, A. T. Holmes, N. B. Christensen, J. Larsen, J. Mesot, R. Liang, D. A. Bonn, W. N. Hardy, A. Watenphul, M. v. Zimmermann, E. M. Forgan, and S. M. Hayden, Nat. Phys. 8, 871 (2012).
- Wang and Chubukov (2015) Y. Wang and A. V. Chubukov, Phys. Rev. B 92, 125108 (2015).
- Lorenz et al. (2014) B. Lorenz, A. M. Guloy, and P. C. W. Chu, Int. J. Mod. Phys. B 28, 1430011 (2014).
- Adam and Schuster (1990) A. Adam and H.-U. Schuster, Z. Anorg. Allg. Chem. 584, 150 (1990).
- Axtell et al. (1997) E. A. Axtell, III, T. Ozawa, S. M. Kauzlarich, and R. R. P. Singh, J. Solid State Chem. 134, 423 (1997).
- Ozawa et al. (2000) T. C. Ozawa, R. Pantoja, E. A. Axtell, III, S. M. Kauzlarich, J. E. Greedan, M. Bieringer, and J. W. Richardson Jr., J. Solid State Chem. 153, 275 (2000).
- Ozawa et al. (2001) T. C. Ozawa, S. M. Kauzlarich, M. Bieringer, and J. E. Greedan, Chem. Mater. 13, 1804 (2001).
- Liu et al. (2009) R. H. Liu, D. Tan, Y. A. Song, Q. J. Li, Y. J. Yan, J. J. Ying, Y. L. Xie, X. F. Wang, and X. H. Chen, Phys. Rev. B 80, 144516 (2009).
- Liu et al. (2010) R. H. Liu, Y. A. Song, Q. J. Li, J. J. Ying, Y. J. Yan, Y. He, and X. H. Chen, Chem. Mater. 22, 1503 (2010).
- Wang et al. (2010) X. F. Wang, Y. J. Yan, J. J. Ying, Q. J. Li, M. Zhang, N. Xu, and X. H. Chen, J. Phys.: Condens. Matter 22, 075702 (2010).
- Yajima et al. (2012) T. Yajima, K. Nakano, F. Takeiri, T. Ono, Y. Hosokoshi, Y. Matsushita, J. Hester, Y. Kobayashi, and H. Kageyama, J. Phys. Soc. of Jpn. 81, 103706 (2012).
- Doan et al. (2012) P. Doan, M. Gooch, Z. Tang, B. Lorenz, A. Möller, J. Tapp, P. C. W. Chu, and A. M. Guloy, J. Am. Chem. Soc. 134, 16520 (2012).
- Yajima et al. (2013) T. Yajima, K. Nakano, F. Takeiri, Y. Nozaki, Y. Kobayashi, and H. Kageyama, J. Phys. Soc. Jpn. 82, 033705 (2013).
- Zhai et al. (2013) H. F. Zhai, W. H. Jiao, Y. L. Sun, J. K. Bao, H. Jiang, X. J. Yang, Z. T. Tang, Q. Tao, X. F. Xu, Y. K. Li, C. Cao, J. H. Dai, Z. A. Xu, and G. H. Cao, Phys. Rev. B 87, 100502(R) (2013).
- Nakano et al. (2013) K. Nakano, T. Yajima, F. Takeiri, M. A. Green, J. Hester, Y. Kobayashi, and H. Kageyama, J. Phys. Soc. Jpn. 82, 074707 (2013).
- Pachmayr and Johrendt (2014) U. Pachmayr and D. Johrendt, Solid State Sci. 28, 31 (2014).
- von Rohr et al. (2014) F. von Rohr, R. Nesper, and A. Schilling, Phys. Rev. B 89, 094505 (2014).
- Pickett (1998) W. E. Pickett, Phys. Rev. B 58, 4335 (1998).
- de Biani et al. (1998) F. F. de Biani, P. Alemany, and E. Canadell, Inorg. Chem. 37, 5807 (1998).
- Singh (2012) D. J. Singh, New J. Phys. 14, 123003 (2012).
- Wang et al. (2013) G. Wang, H. Zhang, L. Zhang, and C. Liu, J. Appl. Phys. 113, 243904 (2013).
- Yan and Lu (2013) X. W. Yan and Z. Y. Lu, J. Phys.: Condens. Matter 25, 365501 (2013).
- Suetin and Ivanovskii (2013) D. V. Suetin and A. L. Ivanovskii, J. Alloys Comp. 564, 117 (2013).
- Yu et al. (2014) X. L. Yu, D. Y. Liu, Y. M. Quan, T. Jia, and H. Q. Lin, J. Appl. Phys. 115, 17A924 (2014).
- Subedi (2013) A. Subedi, Phys. Rev. B 87, 054506 (2013).
- Nakano et al. (2016) K. Nakano, K. Hongo, and R. Maezono, Scientific Reports 6, 29661 (2016).
- Tan et al. (2015) S. Y. Tan, J. Jiang, Z. R. Ye, X. H. Niu, Y. Song, C. L. Zhang, P. C. Dai, B. P. Xie, X. C. Lai, and D. L. Feng, Nat. Sci. Rep. 5, 9515 (2015).
- Song et al. (2016) Q. Song, Y. J. Yan, Z. R. Ye, M. Q. Ren, D. F. Xu, S. Y. Tan, X. H. Niu, B. P. Xie, T. Zhang, R. Peng, H. C. Xu, J. Jiang, and D. L. Feng, Phys. Rev. B 93, 024508 (2016).
- Nozaki et al. (2013) Y. Nozaki, K. Nakano, T. Yajima, H. Kageyama, B. Frandsen, L. Liu, S. Cheung, T. Goko, Y. J. Uemura, T. S. J. Munsie, T. Medina, G. M. Luke, J. Munevar, D. Nishio-Hamane, and C. M. Brown, Phys. Rev. B 88, 214506 (2013).
- Frandsen et al. (2014) B. A. Frandsen, E. S. Bozin, H. Hu, Y. Zhu, Y. Nozaki, H. Kageyama, Y. J. Uemura, W.-G. Yin, and S. J. L. Billinge, Nat. Commun. 5, 5761 (2014).
- Kitagawa et al. (2013) S. Kitagawa, K. Ishida, K. Nakano, T. Yajima, and H. Kageyama, Phys. Rev. B 87, 060510 (2013).
- Chen et al. (2016) D. Chen, T.-T. Zhang, Z.-D. Song, H. Li, W.-L. Zhang, T. Qian, J.-L. Luo, Y.-G. Shi, Z. Fang, P. Richard, and H. Ding, Phys. Rev. B 93, 140501 (2016).
- von Rohr et al. (2013) F. von Rohr, A. Schilling, R. Nesper, C. Baines, and M. Bendele, Phys. Rev. B 88, 140501(R) (2013).
- Nakaoka et al. (2016) H. Nakaoka, Y. Yamakawa, and H. Kontani, Phys. Rev. B 93, 245122 (2016).
- Kim and Kee (2015) H. S. Kim and H. Y. Kee, Phys. Rev. B 92, 235121 (2015).
- Shi et al. (2013) Y. G. Shi, H. P. Wang, X. Zhang, W. D. Wang, Y. Huang, and N. L. Wang, Phys. Rev. B 88, 144513 (2013).
- Nowell et al. (2012) H. Nowell, S. A. Barnett, K. E. Christensen, S. J. Teat, and D. R. Allan, Journal of Synchrotron Radiation 19, 435 (2012).
- Campbell et al. (2006) B. J. Campbell, H. T. Stokes, D. E. Tanner, and D. M. Hatch, J. Appl. Cryst. 39, 607 (2006).
- Miller and Love (1967) S. C. Miller and W. F. Love, Tables of Irreducible Representations of Space Groups and Co-Representations of Magnetic Space Groups (Pruett Press, 1967).
- Rodriguez-Carvajal (1993) J. Rodriguez-Carvajal, Physica B: Condensed Matter 192, 55 (1993).
Appendix
Symmetry Analysis and Fitting
| Sb | As | |||||||
|---|---|---|---|---|---|---|---|---|
| Na1 | 0 | 0.377(3) | 0.93054 | Na1 | 0.9097 | 0 | 0.6389 | |
| Na2 | 0 | 0.127(3) | 0.43054 | Na2 | 0.4097 | 0 | 0.6389 | |
| Na3 | 0.752(3) | 0.125 | 0.93054 | Na3 | 0.1597 | 0.25 | 0.6389 | |
| Ti1 | 0.3668(12) | 0.0082(12) | 0.25 | Ti1 | 0.1315(14) | 0.1185(14) | 0 | |
| Ti2 | 0.6332(12) | 0.2418(12) | 0.25 | Ti2 | 0.8815(14) | 0.3685(14) | 0 | |
| Ti3 | 0.8832(12) | -0.0082(12) | 0.25 | As1 | 0.810(1) | 0 | 0.2423 | |
| Ti4 | 0.1168(12) | 0.2582(12) | 0.25 | As2 | 0.311(1) | 0 | 0.2423 | |
| Sb1 | 0 | 0.376(1) | 0.12884 | As3 | 0.060(1) | 0 | 0.2423 | |
| Sb2 | 0 | 0.126(1) | 0.62884 | O1 | 0 | 0 | 0 | |
| Sb3 | 0.751(1) | 0.125 | 0.12884 | O2 | 0 | 0.5 | 0 | |
| O1 | 0 | 0.625 | 0.25 | O3 | 0.25 | 0.25 | 0 | |
| O2 | 0 | 0.125 | 0.25 | |||||
| O3 | 0.75 | 0.375 | 0.25 |
For Sb, all reflections from the model distorted structure were found to obey where are referred to the reciprocal space of the structure, so that the contributions to intensity at any from the two equivalent orthorhombic domains are equal. It was therefore possible to perform a quantitative refinement by using a single domain and refining an overall scale factor. For As, it was found that there is no overlap between superstructure reflections from the two equivalent domains so a quantitative fit was again possible by indexing half of the observed superstructure peaks using a single domain.
Displacive distortion modes of the Na2Ti2Sb2O parent crystal structure were calculated using Isodistort.Campbell et al. (2006) Four irreducible representations of the commensurate propagation vector were determined, labelled , , , and in Miller and Love notation,Miller and Love (1967) which support finite displacements of all atomic species present. Considering all symmetry-distinct directions of the order parameter, a total of 52 superstructures were found. As discussed in the main text, the structural distortion model was constrained to include exactly two active propagation vectors, and , reducing the total number of possible superstructures to 40. To constrain the number of models further, we considered two qualitative features of the experimental diffraction pattern. Firstly, reflections extinct by -centering in the high temperature parent phase at odd positions were observed to remain extinct in the distorted phase. The super-space group must therefore contain a symmetry element that, for all atomic positions, gives a reflection condition equivalent to that of the -centering translational symmetry of the parent. This strict constraint limits the model to one of eight superstructures. Secondly, the period-eight modulation observed in the diffraction intensity along requires displacements of both Ti and Sb ions to be orthogonal to the -axis, giving just two possible superstructures. They are both described by the space group with basis and origin shift with respect to the parent structure, and within and representations, respectively. The mode describes displacements of the titanium ions parallel to the respective O–Ti–O bond, whereas the mode describes orthogonal displacements.
Refinement of both and distortion modes against the diffraction data using the FullProf software package Rodriguez-Carvajal (1993) shows that both models are in reasonable qualitative agreement with the data, but only the model accurately reproduces the relative intensity between groups of reflections along , when measured at different or as seen in Fig. 2 in the main text.
The structural distortion model for Na2Ti2As2O was found via the same strategy.
For both materials, displacements of the Ti and Sb/As sites are required to reproduce all of the qualitative features of the experimental data. A small displacement of the Na sites is also allowed by symmetry and was found to improve the quantitative fit slightly for Sb, although the fit is not very sensitive to this. Such a displacement would also be allowed for As, although our data are not of sufficient quality to perform a quantitative refinement in that case. The relevant displacement pattern for Na layers and how the layers stack along is presented in Figure 8, while final positions for all sites in the best-fit distorted structures can be found in Table 1.