The Chemical Evolution of Galaxies: The Stellar Mass-Metallicity Relation
In a previous paper (Hartwick 2015, H15) a model to describe the chemical evolution of local dwarf galaxies was presented. Accreting gas undergoes multiple starbursts resulting in metallicity distributions which resemble those in both dwarf irregular and dwarf spheroidal galaxies. The model also predicts a stellar mass-metallicity (hereafter MZ) relation. The purpose of this note is to consider some implications of this MZ relation by comparing with the observations of star-forming galaxies
As discussed in H15, the logarithmic slope of the MZ relation depends on the assumed form of the metallicity kernel. Two kernels were considered. Here we use the Gaussian kernel which was introduced in the appendix to H15. It is the most physically motivated and the predicted slope is in better agreement with the more extensive observations discussed here and with the results of Andrews Martini (2013). Furthermore, in order to maintain the constraint on the relation which holds between the mean metallicity and the variance of the metallicity distributions established by Leaman (2012) the mean in the Gaussian kernel is assumed to be zero. The convolution integrals then become
| (1) |
where the dispersion b is expressed in terms of the effective yield i.e. and is the metallicity at the peak of the metallicity distribution. The true nuclear yield is given by p and is assumed to be constant. is a constant for a given redshift or epoch and is equal to where . is the stellar mass at for a particular redshift and is determined from the observations. The values of used here in order of increasing redshift are 8.35, 9.20, and 10.6.
The data that we will be discussing refers to the mean gas phase metallicity () which following the procedure in H15 is given as
| (2) |
while the stellar mass is given by
| (3) |
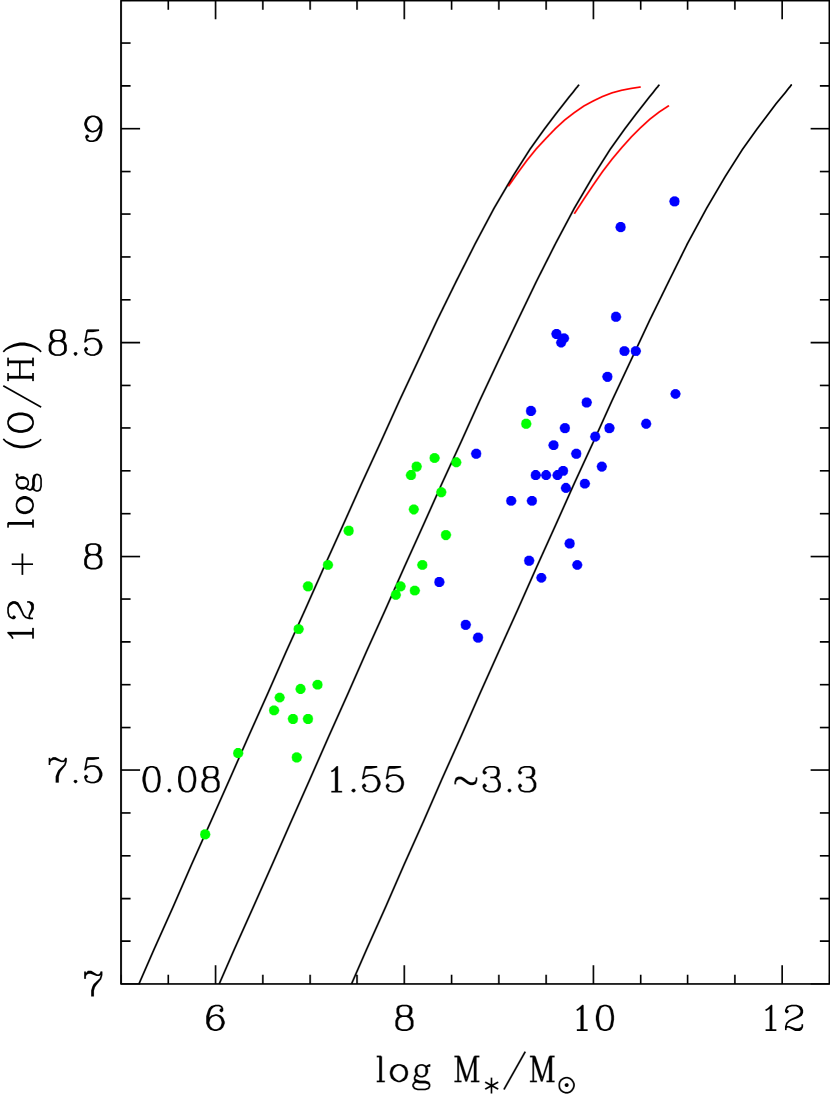
It is the relation between and which is now compared to the observations. This relation is shown in Fig. 1 for different values of the constant . Quenching of the starbursting phase at the metal rich end occurs because stars and the gas cannot be more metal rich than the true nuclear yield which in this case is assumed to be . Given the nature of our model it is appropriate to compare the results to the observations of star-forming galaxies.
Zahid et al (2014) have shown from the observations of star-forming galaxies that at a given cosmic epoch the logarithmic slope of the MZ relation approaches as the metallicity decreases. The logarithmic slope of our model equals 0.5 at lower metallicities. The two red arcs in Fig. 1 show the fits of their model to their observations of star-forming galaxies at redshifts of 0.08 and 1.55 (left to right). The constant has been adjusted to smoothly extend these relations to lower metallicities with the H15 model. The combined effect of the epoch dependence of and the quenching of our model at the metal rich end implies that downsizing (Cowie et al 1996) must occur. Note that reasonable fits to the metallicity distributions in H15 were made assuming that is a constant. This suggests that the time scale for the main star forming phase is short compared to the cosmic time scale.
The downsizing factor is the same for galaxies of all metallicities at a given epoch. This constraint may provide clues to the mechanism which drives the accretion e.g. gas rich mergers or colliding gas streams.
Also shown in Fig. 1 as blue points are the observations of Onodera et al (2016) of star-forming galaxies at redshift . The line through the data is the model with the constant shifted by from the line at redshift 1.55. The green points in Fig. 1 are the observations of Lee et al (2006) for a sample of dwarf irregular galaxies within 5 Mpc. Here, they are considered post-star-forming galaxies in the same sense as the dwarf irregular galaxies discussed in H15. Stellar ages are required in order to determine whether such observations belong on this plot. The prediction is that their major star-forming phase occured between redshifts 0.08 and 1.55 corresponding to look back times between 1.5 and 9.6 Gyr. Similarly the most massive galaxies are predicted to have undergone their main star-forming phase at redshift corresponding to a look back time of Gyr.
In summary, with the addition of one parameter () the H15 model can account for the observations of the star-forming galaxies if the observations of the galaxies are identified with the star bursting behaviour of the model. This consistency with the model holds only if galaxy downsizing is assumed to occur.
References
- (1)
- (2) Andrews, B.H., & Martini, P. 2013, ApJ, 765, 140
- (3) Cowie, Lennox L., Songaila, Antoinette Hu, Ester M., & Cohen, J. G. 1996, AJ, 112, 839
- (4) Hartwick, F. D. A. 2015, AJ, 150, 184 (H15)
- (5) Leaman, R. 2012, AJ, 144, 183
- (6) Lee, Henry, Skillman, Evan D., Cannon, John M., Jackson, Dale C., Gehrz, Robert D., Polomski, Elisha F., & Woodward, Charles E. 2006, ApJ, 647, 970
- (7) Onodera, M., Carollo, C. M., Lilly, S., Renzini, A., Arimoto, N., Capak, P., Daddi, E., Scoville, N., Tacchella, S., Tatehora, S., & Zamorani, G. 2016, arXiv160202779O
- (8) Zahid, H. Jabran, Dima, Gabriel I., Kudritzki, Rolf-Peter, Kewley, Lisa J., Geller, Margaret J., Hwang, Ho Seong, Silverman, John D., & Kashino, Daichi 2014, ApJ, 791, 130
- (9)