Collective Dipole-Dipole Interactions in an Atomic Array
Abstract
The coherent dipole-dipole interactions of atoms in an atomic array are studied. It is found that the excitation probability of an atom in an array parallel to the direction of laser propagation () will either grow or decay logarithmically along , depending on the detuning of the laser. The symmetry of the system for atomic separations of , where is an integer, causes the excitation distribution and scattered radiation to abruptly become symmetric about the center of the array. For atomic separations of , the appearance of a collection of extremely subradiant states (), disrupts the described trend. In order to interpret the results from a finite array of atoms, a band structure calculation in the limit is conducted where the decay rates and the collective Lamb shifts of the eigenmodes along the Brillouin zone are shown. Finally, the band structure of an array strongly affects its scattered radiation, allowing one to manipulate the collective Lamb shift as well as the decay rate (from superradiant to subradiant) by changing the angle of the driving laser.
pacs:
42.50.Nn, 42.50.Ct, 32.70.Jz, 37.10.JkI Introduction
The coherent nature of the coupling between a collection of radiators and the electromagnetic field Dicke (1954) has proven to be a fruitful field of study for over 60 years. Despite its history, the study of collective radiation is still providing important insights into quantum optics, leading to deeper understandings of systems such as cold atom clouds Sutherland and Robicheaux (2016); Bromley et al. (2016); de Oliveira et al. (2014); Javanainen et al. (2014); Bienaimé et al. (2012); Ido et al. (2005); Roof et al. (2016); Araújo et al. (2016), waveguides Goban et al. (2015), quantum information Yavuz (2014), and biophysics Monshouwer et al. (1997); Palacios et al. (2002). Recently, the interplay between the collective Lamb shift Meir et al. (2014); Scully (2009); Röhlsberger et al. (2010), the energy shift due to the exchange of virtual photons between radiators Gross and Haroche (1982), and its relationship to superradiance/subradiance Scully (2007); Guerin et al. (2016); Scully (2015); Wang et al. (2015) has produced a plethora of new physics. In particular, the study of the large-scale coherent build-up of forward photon emission in cold atom clouds has shown that coherent dipole-dipole interactions can cause dramatic changes to the nature of the cloud’s scattered radiation Svidzinsky et al. (2008); Rouabah et al. (2014); Sutherland and Robicheaux (2016); Bromley et al. (2016); Scully et al. (2006). Recently, it has also been noted that coherent dipole-dipole interactions can cause the excitation distribution of a cigar-shaped cloud to deviate from the results predicted by the Beer-Lambert law Sutherland and Robicheaux (2016).

Collective interactions in atomic arrays are also well-studied and have been shown to produce exciting effects, such as the appearance of superradiant and subradiant eigenmodes Porras and Cirac (2008); Mewton and Ficek (2007); Clemens et al. (2003); Ostermann et al. (2012); Zoubi (2012). However, these studies do not fully address the physics of position dependent phase correlations in the array. When an entire system is illuminated by a laser, it excites the atoms to a state where the phase of the excitation probability amplitude of each atom is proportional to the laser’s own phase (a timed-Dicke state) Scully et al. (2006). This produces coherences that dramatically change the photon scattering Svidzinsky et al. (2008); Scully (2009, 2015); Svidzinsky et al. (2010). This effect has recently been studied by considering the emission of timed-Dicke states when an array has spacings () much less than the resonance wavelength (), where only nearest neighbor interactions are considered Liao and Zubairy (2014). However, the limit is not relevant to most experimental setups. Also, in this regime the near field term in the dipole field propagator (see Eq. (2)) overshadows the physics resulting from the coherent buildup of the term over the entire array. When or larger, even though the individual dipole-dipole interactions are small, they can coherently build over a large sample and cause non-negligible effects. For example, this interaction has been shown to produce an observable shift (collective Lamb shift) in the light scattered from an array of ions when Meir et al. (2014). In this paper, we show that when both the phase correlations caused by the driving laser and the collective dipole-dipole interactions between all atoms in an array are considered, they produce novel physics that allows for the manipulation of the atoms’ scattered light and excitation probability.
Specifically, it is shown that an array’s probability distribution, when driven by a laser parallel to the array, is highly dependent on the detuning of the laser. For red (blue) detuned light, the dipole radiation in the direction of the laser causes the probability of excitation to increase (decrease) logarithmically (see Fig. 1). For atomic separations () of , where is an integer, the logarithmic excitation distribution along the direction of the laser rapidly changes so that it becomes completely symmetric about the center of the array. The results described do not hold for () due to the existence of a collection of non-radiating () eigenmodes in this regime. In the interest of understanding the eigenmodes and eigenvalues of a finite array of atoms, the limit is then implemented in order to conduct a band structure calculation. This calculation gives both the collective Lamb shift and the decay rate of the eigenmodes along the Brillouin zone. It is then shown that the appearance and disappearance of Bragg diffraction peaks causes the eigenmodes to discontinuously jump from subradiant (superradiant) to superradiant (subradiant), depending on , when plotted along the Brillioun zone. Lastly, it is demonstrated how the band structure of a long array of atoms strongly affects the light scattered from the array, allowing one to probe subradiant eigenmodes in a straightforward manner.
II Theory/Methods
For a weak laser, a collection of two-level atoms polarized in the direction can be treated as coupled damped harmonic oscillators Javanainen et al. (2014); Jenkins and Ruostekoski (2012); Svidzinsky et al. (2010); Ruostekoski and Javanainen (1997),
| (1) | |||||
where represents the polarization amplitude of the atom, d is the electric dipole matrix element, is the the laser field at atom , is the detuning, is the single atom decay rate, and is the usual dipole field propagator Jackson (1999),
| (2) |
where , and is the vector = /r. These coupled equations can be rewritten in matrix-vector form:
| (3) |
and the steady state solution () may be obtained by inverting a symmetric matrix.
For the band structure calculations of Section V, the limit is implemented in order to calculate the complex eigenvalues of . In this limit, the translational symmetry of the system may be used in order to rewrite the eigenvalue problem:
| (4) |
as
| (5) | |||||
| (6) |
so that the calculation reduces to an infinite sum that converges for most values of (see Section V). Here the decay rate and the collective Lamb shift of the eigenmode can be obtained from ’s real and imaginary parts respectively.
III Excitation Distribution
III.1 Numerical Results
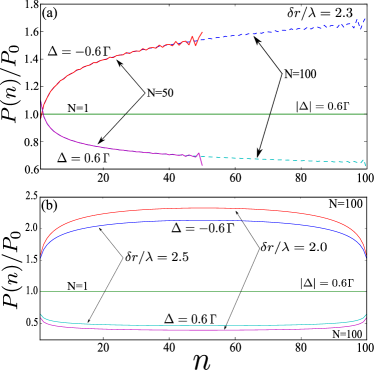
An understanding of the highly directional nature of the interactions that add coherently can be gained by noting the similarities in the phases accumulated between the driving laser and the dipole-dipole interactions Sutherland and Robicheaux (2016). Essentially, the phase a laser will accumulate when going from atom to atom is , while the phase accumulated in a photon exchanged by the two atoms is . These two phases are equivalent when is parallel to . Because of this, all of the radiation and virtual photon exchanges along add coherently, while they add incoherently along relative to atom . Therefore, the excitation probability of atom , (), depends mainly on the dipole-dipole interactions from the atoms in the direction relative to . This is shown in Fig. 2(a), where except for small oscillations caused by reflections off of the end of the array, the value of follows approximately the same curve for an array of 50 atoms as an array of 100 atoms for both red and blue detunings. Note that this mechanism of coherence in the forward direction is only true when , as will be discussed shortly.
The nature of can be intuitively understood by considering that the atom in the array will only see a significant contribution of electric field from the driving laser and the atoms located in the direction relative to it, as well as the fact that the dominant term in the dipole-dipole interaction is for the values of described here. It can now be seen that atom will feel a sum of dipole-dipole interactions, that add either constructively or destructively with the driving laser, with a magnitude:
| (7) |
which is for large values of . This is approximately the form of shown in Fig. 2(a).
The above description holds only for values of , where is an integer. However, the only terms in Eq. (1) distinguishing from , from , etc… are the phase factors . If Eq. (1) is symmetric about the center of the array. Resultantly when , becomes completely symmetric about the center of the array. Because of this symmetry, the only parameter determining the value of is the total magnitude of all the dipole-dipole interactions atom experiences. For red detunings, it has already been established that all of the dipole-dipole interactions add in phase with the laser. As seen in Fig. 2(b), this causes the atoms experiencing the strongest interactions (atoms in the center of the array) to be the most excited. For blue detunings dipole-dipole interactions add destructively, here Fig. 2(b) shows that the atoms in the center are the least excited. Because both the forward and backward dipole-dipole interactions now add coherently, the dependence described in Eq. (7) becomes:
| (8) |
The symmetry about the center of the array also causes a large increase in the coherent backscattering (see Fig. 3). Normally the phase correlations of an array of atoms parallel to only allow for Coherent Forward Scattering Rouabah et al. (2014); Scully (2009), however because of this symmetry about when light scattered in the direction also adds coherently, causing a diffraction peak. The inset in Fig. 3 shows a close up of one of the diffraction peaks. Near a given peak, the coherent backscattering has the approximate form: , where and is the zeroth spherical Bessel function. This can be shown using Eq. (11) and making the approximation that the atoms are in the timed-Dicke state () caused by a laser propagating in the direction.
The differences in the heights of the diffraction peaks shown in Fig. 3, are mainly caused by the fact that the collective Lamb shift of the eigenmode that the laser drives changes with . In Fig. 3, the intensity of successive diffraction peaks increases until , where it then begins to decrease. For different laser detunings, this pattern would follow a different form. A similar effect can be seen in in Fig. 2 where the magnitude of the the change in for a given array is larger for red detunings than blue detunings of the same magnitude, since the resonance frequency for an array of atoms parallel to is red shifted (see Sec. V).
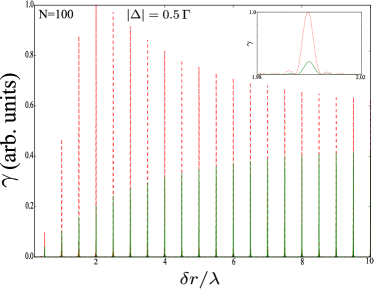
Figure 2(a) is for and detunings of , which for red detunings shows a difference between the first and last atoms. However, due to the long-range nature of the coherent build-up of dipole radiation, the logarithmic growth of does not saturate for large values of . For example, in Fig. 4(b), a growth in is seen for . In fact, until other timescales, such as retardation effects, become important there is no value of where this logarithmic growth doesn’t, in principle, happen.
The nature of described here is qualitatively valid in non-ideal circumstances. This is tested using Monte Carlo routines where the filling factor and the randomness of the position of each atom is varied. The magnitude of the overall growth for non-integer wavelengths is approximately proportional to the filling factor of the sample. For example, if an experiment would have produced an array where the first and last atoms have an excitation probability that differs by 50%, a filling factor of 0.5 causes the overall effect to reduce to . It is also found that for when each atom’s values are allowed to randomly vary, the noise of a given array’s increases while the average value of does not change until the randomness of the atoms’ positions are allowed to vary distances comparable to , not . For example if , the sample is significantly more resilient to random positions than if . However, it is found that the described symmetry for is more sensitive to non-ideal scenarios. Unlike the logarithmic buildup, the robustness of the symmetry about the center of the array does not seem to depend on the value of . It is found that for all spacings, letting the atom positions randomly vary more than , causes the symmetric distribution to begin to approach the logarithmic function seen for . Note that the probability distributions described here only occur when is parallel to the array.
III.2 Analytic Derivation of Excitation Distribution
In this section, the approximation that dipole-dipole interactions adding incoherently (occuring in the direction) are negligible, is implemented in order to derive an equation for analytically. Note that this is only valid when . Neglecting all incoherent interactions allows us to replace in Eq. (3) with a lower triangular matrix. When the limit is taken, solving for is reduced to solving the system of equations:
| (9) | |||||
| , |
where is the component of . This can be solved for , which can be plugged into the equation for etc… The approximation indicated in Eq. (III.2) remains quantitatively accurate when . This can be seen in Fig. 4(a) where, except for small oscillations due to reflections off the end of the array, the curve produced by solving Eq. (III.2) remains nearly identical to the full numerical result. Assuming Eq. (III.2), and keeping only the first order terms of allows one to obtain a closed form solution for :
| (10) |
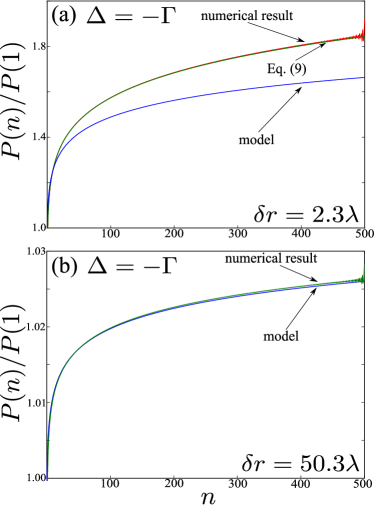
This equation holds in the limit , and causes to grow for red detunings and diminish for blue detunings. As seen in Fig. 4, for smaller spacings the simple model used to derive Eq. (10) becomes only qualitative. This is because in this regime, higher order terms matter. As becomes smaller than , individual dipole-dipole interactions grow and despite the fact that they add incoherently, the contributions of a couple of large interactions in the direction begin to become significant, causing Eq. (III.2) to break down.
IV Behavior
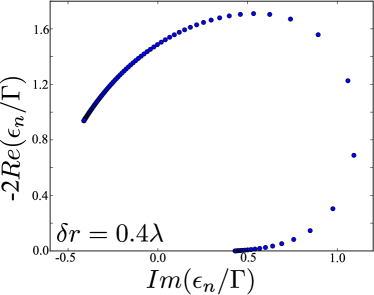
The excitation distribution described above breaks down for values of . This may be understood by considering the distribution of the eigenvalues () of . Since is complex symmetric rather than Hermitian, the values of are complex. Here, is the eigenmode’s decay rate, while is its collective Lamb shift. When , there exists a collection of non-radiating () eigenmodes of within a relatively small energy range (see Fig. 6). This effect is well-known, and has been used in systems such as arrays of metallic nanospheres Burin et al. (2004); Chui et al. (2015); Halir et al. (2015), where it has been shown that these eigenmodes may be used for their optical transport properties. The same physics strongly affects the excitation distribution of an array driven by a laser. In Fig. 5, the excitation distribution for an array of 100 atoms, where , is shown for various values of . In Fig. 5(a), it may be seen that the values of that lie within the energy range of the collection of subradiant states () produce very different excitation distributions than the logarithmic ones described in the previous sections. However, Fig. 5(b) shows that once the laser is off resonance with the collection of subradiant states, the distribution becomes logarithmic again.
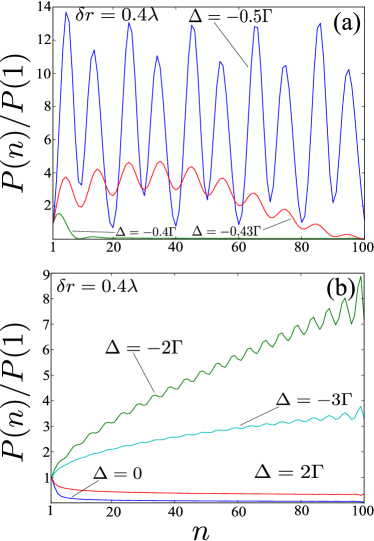
Figure 6 shows the decay rates () and collective Lamb shifts () for the eigenmodes of an array where , , and . Here it can be seen that the collection of eigenmodes whose eigenvalues () occur near the axis are within a very narrow range of energies. It should be noted that for Fig. 6, a positive value of corresponds to an eigenvalue that would be on resonance with a red detuned laser. This is because the value of is present on all of the diagonals of and would resultantly shift all of the imaginary parts of the eigenvalues towards , i.e. resonance. Even though populating an individual subradiant state can be difficult due to the narrowness in energy of its photon scattering cross section, the fact that they all occur in a very small energy range causes them to be the dominant feature of the steady state solution for values of within their energy band. The presence of decay modes will be explained in Section V.
V Band Structure
In order to understand the eigenmodes and eigenvalues of this system, we examine its band structure in the limit. Since in Eq. (1) there is only one oscillator per atom, there is only one band of eigenvalues. For a given eigenvalue (), again the real part corresponds to the decay rate of the eigenmode divided by two (), while the imaginary part corresponds to the collective Lamb shift of the eigenmode (). Since occurs in every diagonal element of , its value will only produce a uniform shift to the imaginary part of every , thus it is taken to be zero. Note that values of that are positive correspond to redshifts in the resonance line of that eigenmode.
In Fig. 7, the values of and are plotted for the positive half of the Brillouin zone (). The negative values of may be omitted since the calculation is symmetric and yields the same results. In Fig. 7(a), a discontinuity is seen at , when the value of drops to 0, changing the eigenmode from superradiant to non-radiant. At the same time in Fig. 7(b), when the value of shows a discontinuity from a subradiant mode to a superradiant mode. The same pattern occurs for larger array spacings. In Fig. 7(c), when the eigenmodes shift from superradiant to subradiant, while in Fig. 7(d), when the eigenmodes jump from subradiant to superradiant. While the magnitude of each discontinuous jump of decreases with , approaching when , the described band structure pattern repeats for every integer increase in . This can be understood in terms of the appearance and disappearance of Bragg diffraction peaks. This phenomena was somewhat addressed in Porras and Cirac (2008), but the effect of different phase correlations (values of ) on the decay rate was not.
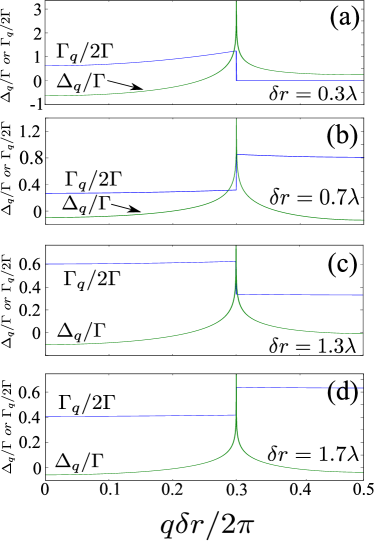
Figure 7 can be understood by examining the photon emission rate per unit solid angle for a line of two level atoms polarized in the direction:
| (11) |
where is the photon scattering rate. For a periodic array of atoms parallel to the direction this becomes:
| (12) |
where is a magnitude determined by the detuning and the Rabi frequency, while is the quasi-momentum of the eigenmode. All of the phases in Eq. (12) will add coherently, resulting in a Bragg diffraction peak when:
| (13) |
which means there will be a peak at the angle:
| (14) |
If every atom has the same phase (), then for values of there will be values of where Eq. (14) can be satisfied and photons may be scattered. Thus when , the photon scattering of the array produces the well-known behavior of a diffraction grating. However, this is not the case when . For example when and , there are no solutions to Eq. (14). The result of this is that states with values of and do not decay. This is seen in Fig. 7(a), when jumps discontinuously to 0. The opposite effect happens when . Here for small values of , there is only one angle where the array can emit radiation coherently. However, when the value of is increased to the point where there is suddenly another value of corresponding to a diffraction peak, resulting in a discontinuous increase in the value of (see Fig. 7). This pattern continues for larger values of as well. If (), where , then when is increased to the point where there is one less diffraction peak where photons may escape. This makes the eigenmode’s decay rate smaller. However if , when there is one more allowed peak, making the decay rate of the eigenmode larger. For spatially disordered systems such as cold atom gases, this discontinuity does not occur. However when the atoms in a gas are excited to a timed-Dicke state, a similar peak still occurs in the forward direction Scully et al. (2006) which also results in an increase in the decay rate Sutherland and Robicheaux (2016); Scully (2007, 2009).
Another surprising feature of Fig. 7 is the divergence of the collective Lamb shift at the same values of where the discontinuities of occur. This happens because at this point the phase in the sum given by Eq. (5) becomes a multiple of , making the value of the imaginary part of dependent on a logarithmically diverging infinite sum over . The decay rate does not diverge however. This is because when the phase in Eq. (5) becomes a multiple of the real part of the term disappears, leaving only the convergent sum for the value of the decay rate.

The band structure of an array has a strong effect on the scattered radiation versus the angle of the driving laser. This is because if one changes the angle of the laser, to first order they are also changing the relative phase correlations of the radiating atoms with respect to one other. For an array aligned along , the phase of the laser that the atom sees is . When is changed, the effective value of of the eigenmode that the laser is driving also changes. For example if the laser is perpendicular to the atomic array, the eigenmode corresponding to is being driven. If the laser is situated at some arbitrary angle , the value of of the eigenmode being driven is equal to . Figure 8(a) shows how the photon scattering rate changes with respect to . Here large changes in the scattering rate occur when the laser changes from driving a subradiant (superradiant) band to a superradiant (subradiant) band. Figure 8(a) also shows that the scattering rate dramatically drops at the point where this change happens, due to the large collective Lamb shift for this value of . It should be noted that increases in of correspond to the same phase correlations. For example, Fig. 8(b) shows that for an array with spacings , and give the exact same lineshape.
For values of , the photon scattering lineshapes versus laser detuning fit a Lorentzian profile almost perfectly, with decay rates and collective Lamb shifts corresponding to their band structure values. As seen in Fig. 8(b) for an array of 1000 atoms and , when or , and . The large shift in resonant energy occurs because of the logarithmically diverging collective Lamb shift discussed above, while because the value of occurring at the discontinuous jump between subradiant and superradiant modes is driven, giving a value in the middle of the two. When or , the superradiant band is driven, resulting in a broadened lineshape with and , while when the subradiant band is driven, giving and . This indicates that one may easily access subradiant eigenmodes by changing the angle of the laser.
VI Conclusion
The effects caused by a coherently radiating atomic array being driven by a laser have been studied. It was shown numerically that the excitation distribution for a given array is highly dependent on whether the driving laser is red or blue detuned, where the probability of excitation either grows or diminishes along respectively. It was also shown that the probability distribution and photon scattering become symmetric about the center of the array for spacings of , where is an integer. It was then shown analytically that at large distances, the probability of excitation either grows or diminishes logarithmically no matter how large the value of is. These results break down when due to the presence of a collection of extremely subradiant states ().
In order to interpret the eigenmodes of the system, a bandstructure calculation for an infinitely long array of atoms was conducted. These calculations showed the eigenmodes have both a collective Lamb shift that diverges logarithmically, as well as a discontinuous decay rate when plotted along the Brillouin zone. The sudden jump in decay rate can be understood by the appearance and disappearance of Bragg diffraction peaks of the scattered radiation. Finally, it was shown that these divergences and discontinuities in the bandstructure of an array may be exploited in order to manipulate the photon scattering rate by changing the angle of the driving laser, allowing one to manipulate the collective Lamb shift as well as access subradiant eigenmodes.
It has been suggested that coherently radiating systems should be thought of in terms of Bragg scattering Porras and Cirac (2008); Araújo et al. (2016); Hilliard et al. (2008), where the radiators have certain spatially dependent phase correlations. Here, this picture is necessary. This is because the symmetries in an atomic array cause number of diffraction peaks to change. Since photons are mainly emitted from these diffraction peaks Porras and Cirac (2008), the photon scattering rate changes drastically with their appearance and disappearance. In systems such as cold atom gases, where the spatial distribution of atoms is highly disordered, the spatially dependent phases caused by the driving laser still cause a diffraction peak in the forward direction. This phenomenon is, of course, the well known Coherent Forward Scattering Scully (2007); Rouabah et al. (2014). A large part of understanding the nature of radiators, in the low excitation regime essentially consists of determining the spatially dependent phase relationship between atoms followed by determining their resulting scattered emission. Recently interesting new physics has resulted from approximating this relationship as the one caused by the initial driving laser, i.e. the timed Dicke state Scully (2007, 2009); Bromley et al. (2016); Sutherland and Robicheaux (2016). Understanding the nature of how these phase relationships develop, and how they may be manipulated in order to explore new physical systems will surely provide novel insights into the relationship between light and matter in the future.
The authors would like to thank Prof. C.-L. Hung for enlightening conversations, as well as Jesús Pérez-Ríos for his valuable insights into graphic design. This material is based upon work supported by the National Science Foundation under Grant No. 1404419-PHY.
References
- Dicke (1954) R. H. Dicke, Phys. Rev. 93, 99 (1954).
- Sutherland and Robicheaux (2016) R. T. Sutherland and F. Robicheaux, Phys. Rev. A 93, 023407 (2016).
- Bromley et al. (2016) S. Bromley, B. Zhu, M. Bishof, X. Zhang, T. Bothwell, Schachenmayer, N. J.T.L., R. Kaiser, S. F. Yelin, M. Lukin, A. Rey, and J. Ye, Nat. Commun. 7 (2016).
- de Oliveira et al. (2014) R. A. de Oliveira, M. S. Mendes, W. S. Martins, P. L. Saldanha, J. W. Tabosa, and D. Felinto, Physical Review A 90, 023848 (2014).
- Javanainen et al. (2014) J. Javanainen, J. Ruostekoski, Y. Li, and S.-M. Yoo, Phys. Rev. Lett. 112, 113603 (2014).
- Bienaimé et al. (2012) T. Bienaimé, N. Piovella, and R. Kaiser, Phys. Rev. Lett. 108, 123602 (2012).
- Ido et al. (2005) T. Ido, T. H. Loftus, M. M. Boyd, A. D. Ludlow, K. W. Holman, and J. Ye, Phys. Rev. Lett. 94, 153001 (2005).
- Roof et al. (2016) S. J. Roof, K. J. Kemp, M. D. Havey, and I. M. Sokolov, ArXiv e-prints (2016), arXiv:1603.07268 .
- Araújo et al. (2016) M. O. Araújo, I. Kresic, R. Kaiser, and W. Guerin, ArXiv e-prints (2016), arXiv:1603.07204 [physics.atom-ph] .
- Goban et al. (2015) A. Goban, C.-L. Hung, J. Hood, S.-P. Yu, J. Muniz, O. Painter, and H. Kimble, Phys. Rev. Lett. 115, 063601 (2015).
- Yavuz (2014) D. D. Yavuz, J. Opt. Soc. Am. B 31, 2665 (2014).
- Monshouwer et al. (1997) R. Monshouwer, M. Abrahamsson, F. van Mourik, and R. van Grondelle, The Journal of Physical Chemistry B 101, 7241 (1997).
- Palacios et al. (2002) M. A. Palacios, F. L. de Weerd, J. A. Ihalainen, R. van Grondelle, and H. van Amerongen, The Journal of Physical Chemistry B 106, 5782 (2002).
- Meir et al. (2014) Z. Meir, O. Schwartz, E. Shahmoon, D. Oron, and R. Ozeri, Phys. Rev. Lett. 113, 193002 (2014).
- Scully (2009) M. O. Scully, Phys. Rev. Lett. 102, 143601 (2009).
- Röhlsberger et al. (2010) R. Röhlsberger, K. Schlage, B. Sahoo, S. Couet, and R. Rüffer, Science 328, 1248 (2010).
- Gross and Haroche (1982) M. Gross and S. Haroche, Physics Reports 93, 301 (1982).
- Scully (2007) M. Scully, Laser Phys. 17, 635 (2007).
- Guerin et al. (2016) W. Guerin, M. O. Araújo, and R. Kaiser, Phys. Rev. Lett. 116, 083601 (2016).
- Scully (2015) M. O. Scully, Phys. Rev. Lett. 115, 243602 (2015).
- Wang et al. (2015) D.-W. Wang, R.-B. Liu, S.-Y. Zhu, and M. O. Scully, Phys. Rev. Lett. 114, 043602 (2015).
- Svidzinsky et al. (2008) A. A. Svidzinsky, J.-T. Chang, and M. O. Scully, Phys. Rev. Lett. 100, 160504 (2008).
- Rouabah et al. (2014) M.-T. Rouabah, M. Samoylova, R. Bachelard, P. W. Courteille, R. Kaiser, and N. Piovella, J. Opt. Soc. Am. A 31, 1031 (2014).
- Scully et al. (2006) M. O. Scully, E. S. Fry, C. H. R. Ooi, and K. Wódkiewicz, Phys. Rev. Lett. 96, 010501 (2006).
- Porras and Cirac (2008) D. Porras and J. I. Cirac, Phys. Rev. A 78, 053816 (2008).
- Mewton and Ficek (2007) C. Mewton and Z. Ficek, Journal of Physics B: Atomic, Molecular and Optical Physics 40, S181 (2007).
- Clemens et al. (2003) J. Clemens, L. Horvath, B. Sanders, and H. Carmichael, Phys. Rev. A 68, 023809 (2003).
- Ostermann et al. (2012) L. Ostermann, H. Zoubi, and H. Ritsch, Optics express 20, 29634 (2012).
- Zoubi (2012) H. Zoubi, EPL (Euro. Lett.) 100, 24002 (2012).
- Svidzinsky et al. (2010) A. A. Svidzinsky, J.-T. Chang, and M. O. Scully, Phys. Rev. A 81, 053821 (2010).
- Liao and Zubairy (2014) Z. Liao and M. S. Zubairy, Phys. Rev. A 90, 053805 (2014).
- Jenkins and Ruostekoski (2012) S. D. Jenkins and J. Ruostekoski, Phys. Rev. A 86, 031602 (2012).
- Ruostekoski and Javanainen (1997) J. Ruostekoski and J. Javanainen, Phys. Rev. A 55, 513 (1997).
- Jackson (1999) J. D. Jackson, Classical electrodynamics, Vol. 3 (Wiley New York etc., 1999).
- Burin et al. (2004) A. Burin, H. Cao, G. Schatz, and M. Ratner, JOSA B 21, 121 (2004).
- Chui et al. (2015) S.-T. Chui, S. Du, and G.-B. Jo, Physical Review A 92, 053826 (2015).
- Halir et al. (2015) R. Halir, P. J. Bock, P. Cheben, A. Ortega-Moñux, C. Alonso-Ramos, J. H. Schmid, J. Lapointe, D.-X. Xu, J. G. Wangüemert-Pérez, Í. Molina-Fernández, et al., Laser & Photonics Reviews 9, 25 (2015).
- Hilliard et al. (2008) A. Hilliard, F. Kaminski, R. Le Targat, C. Olausson, E. S. Polzik, and J. H. Müller, Phys. Rev. A 78, 051403 (2008).