Multiple metamagnetic quantum criticality in Sr3Ru2O7
Abstract
Bilayer strontium ruthenate Sr3Ru2O7 displays pronounced non-Fermi liquid behavior at magnetic fields around 8 T, applied perpendicular to the ruthenate planes, which previously has been associated with an itinerant metamagnetic quantum critical end point (QCEP). We focus on the magnetic Grüneisen parameter , which is the most direct probe to characterize field-induced quantum criticality. We confirm quantum critical scaling due to a putative two-dimensional QCEP near 7.845(5) T, which is masked by two ordered phases A and B, identified previously by neutron scattering. In addition we find evidence for a QCEP at 7.53(2) T and determine the quantum critical regimes of both instabilities and the effect of their superposition.
Quantum criticality denotes critical behavior that is associated with continuous transformations of matter at zero temperature. Due to the absence of thermal fluctuations at it is qualitatively different from classical criticality Sachdev (1999). In metals the unconventional excitation spectrum near a quantum critical point (QCP) causes the breakdown of Fermi liquid (FL) behavior and its intimate relation to exotic states, such as unconventional superconductivity, adds even more importance to this topic. To date, the influence of quantum critical magnetic excitations on electrons in a metal is far from being understood. For instance the applicability of the itinerant Hertz-Millis-Moriya theory on -electron based Kondo lattice systems has been disproved by several experiments Gegenwart et al. (2008) and alternative descriptions are not fully established yet. Quantum criticality related to itinerant metamagnetism is exceptional in the sense, that electronic degrees of freedom are irrelevant, and a quantitative application to experimental results should be possible Millis et al. (2002).
The generic metamagnetic quantum critical end point (QCEP) arises from the suppression to of the end point of a line of first-order metamagnetic transitions in temperature-field phase space by tuning e.g. composition, pressure or the magnetic field orientation Millis et al. (2002). Metamagnetic QCEPs have been realized in the -electron based compounds CeRu2Si2 Daou et al. (2006); Weickert et al. (2010) and UCoAl Aoki et al. (2011), as well as -electron Sr3Ru2O7 Grigera et al. (2003); Rost et al. (2009).
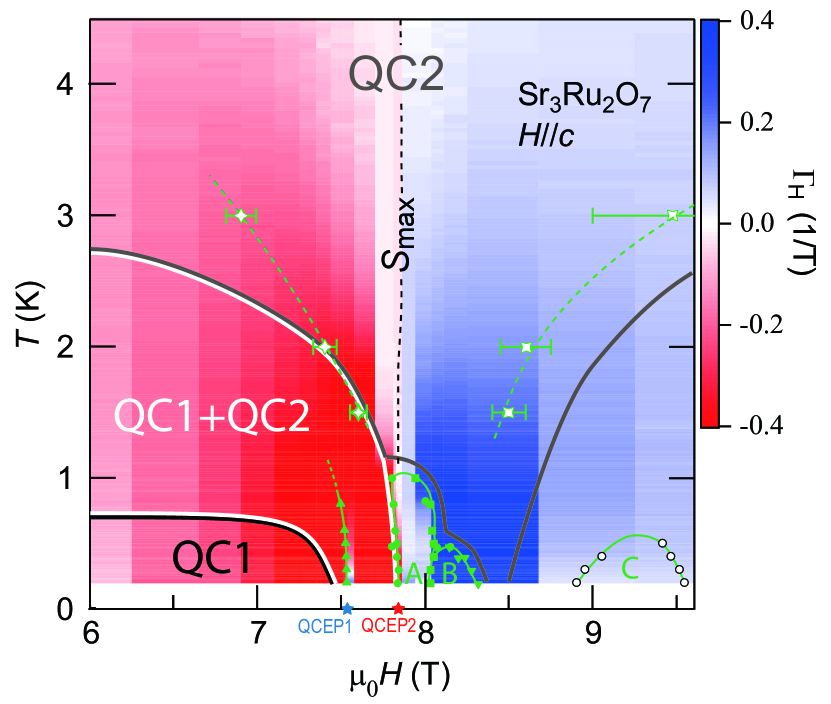
We focus on bilayer strontium ruthenate Sr3Ru2O7. Magnetization of this compound along the tetragonal -axis at low temperature exhibits three successive super-linear, i.e. metamagnetic, rises at =7.5 T, =7.85 T and =8.1 T Perry et al. (2004). The first one is a metamagnetic cross-over (M1). The second and third ones are first order metamagnetic transitions (M2 and M3), ending at critical temperatures of about 1 and 0.5 K, respectively Grigera et al. (2004). A line of second-order thermal phase transitions, connecting the critical end points of M2 and M3, has been discovered in electrical resistivity and thermodynamic experiments Grigera et al. (2004); Gegenwart et al. (2006), which recently by neutron scattering has been identified as phase boundary of a spin-density-wave (SDW) ”phase A” Lester et al. (2015); Borzi et al. (2007) (see Fig. 1.). The lower and upper critical fields of SDW-A correspond respectively to and . Additionally, another SDW ”phase B” has been observed in between and 8.3 T Lester et al. (2015); Stingl et al. (2013). The observed incommensurate ordering vectors in both SDW phases have been related to Fermi surface nesting Lester et al. (2015). Magnetic susceptibility and magnetostriction have revealed the strongest peak at the M2 metamagnetic transition and weaker maxima at M1 and M3 Grigera et al. (2004). The critical field has been extrapolated to T Gegenwart et al. (2006), which is indeed very close to . Non Fermi liquid (NFL) behavior at elevated temperatures was previously associated to a critical field close to Perry et al. (2004). Outside the SDW phases A and B and not to close to the M1 crossover, thermal expansion obeys quantum critical scaling in accordance with the expectations for a two-dimensional (2D) metamagnetic QCEP near 7.845 T Gegenwart et al. (2006). This includes both the predicted divergence upon cooling within the quantum critical regime as well as the magnetic field dependence within the low-temperature FL regime upon tuning the field from both sides towards M2. However, the previous description of the specific heat coefficient by a strong divergence Rost et al. (2009, 2010) is in clear contradiction to the theoretical prediction Millis et al. (2002).
We solve this discrepancy by proving that Sr3Ru2O7 displays two QCEPs at T and T, respectively. We determine regimes in phase space where either of the two QCEPs leads to scaling of the magnetic Grüneisen parameter. We also show where scaling fails due to the superposition of criticality from both instabilities. Multiple quantum criticality as origin for behavior that is incompatible with the generic predictions of QCPs can be of relevance for various material classes.
The magnetic Grüneisen parameter, measures the relative temperature change with magnetic field under adiabatic conditions, called adiabatic magnetocaloric effect. Due to the entropy accumulation near field-driven quantum criticality, generically this property is expected to obey (i) a sign change when tuning the field across the critical value, (ii) a divergence upon cooling (at constant field) within the quantum critical regime Zhu et al. (2003); Garst and Rosch (2005) and (iii) universal scaling within both the FL and quantum critical regime. The adiabatic magnetocaloric effect can be accurately determined with the aid of the alternating-field method Tokiwa and Gegenwart (2011). Using this technique several field-induced quantum critical points have been characterized Tokiwa et al. (2009, 2013a, 2013b). The magnetic Grüneisen parameter provides direct access to the critical exponents which characterize quantum criticality. Below, we report a thorough study of , determined by the alternating field technique Tokiwa and Gegenwart (2011), as well as heat capacity measurements performed with the quasi-adiabatic heat pulse technique, on a high-quality single crystal of Sr3Ru2O7, grown by the floating zone technique Perry and Maeno (2004), for fields applied along the -axis.
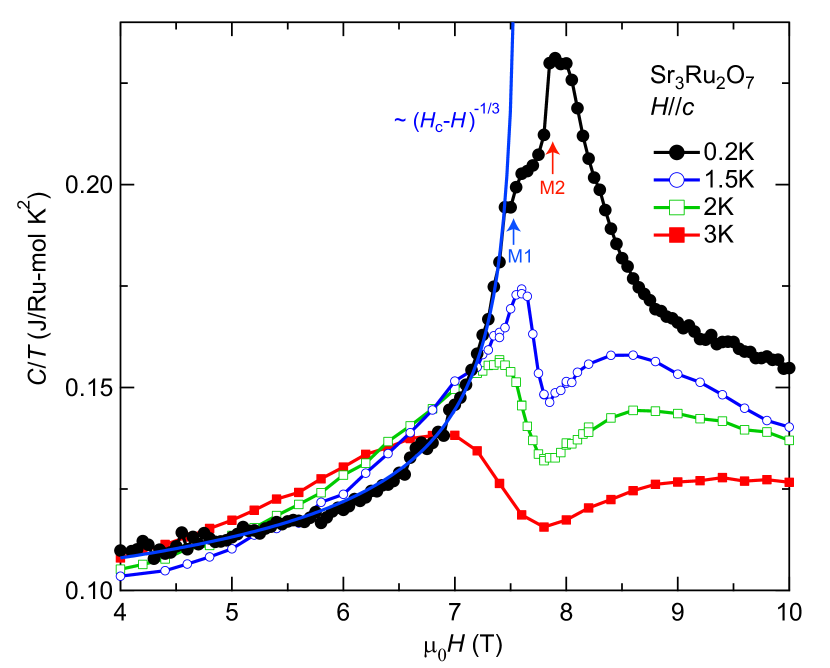
Figure 2 displays the magnetic field dependence of the specific heat coefficient at various low temperatures. Data at 0.2 K display a single peak at 7.85 T. At larger temperatures, this peak is split into two peaks and the respective separation increases with increasing temperature. Qualitatively, such behaviour is characteristic to itinerant metamagnetism and has also been found for CeRu2Si2 Aoki et al. (2001). For a generic QCEP with a critical free energy (where ), symmetric peaks for the heat capacity are expected. Our measurements, however, display more broadened peaks on the high-field compared to the low-field sides. As discussed later, this may be related to a slight increase of the effective dimensionality of the critical fluctuations at large fields.
The magnetic field dependence of the 0.2 K data is in perfect agreement with previous data Rost et al. (2009, 2010), see SM Tokiwa et al. . As shown by the blue solid line in Fig. 2, the data are well described by , predicted for a 2D QCEP Millis et al. (2002); Zacharias and Garst (2013) with critical field close to but significantly smaller than . This indicates that the previously anticipated scenario with a single field-tuned QCEP near Rost et al. (2009) is insufficient.
The existence of two separate 2D metamagnetic QCEPs is evident from the analysis of the magnetic Grüneisen parameter given below. In contrast to the specific heat coefficient, which has a substantial non-critical background, is more sensitive to quantum criticality because of a negligibly small non-critical contribution.
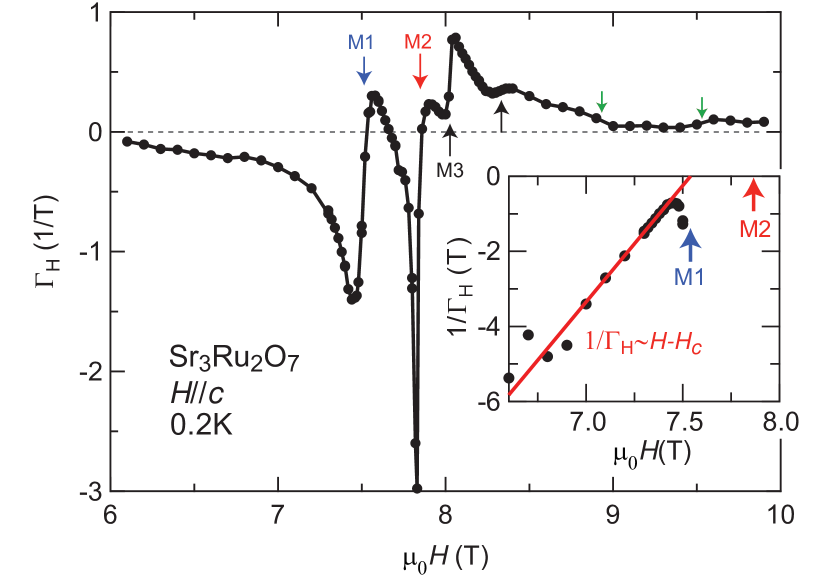
Figure 3 shows an isothermal scan of the magnetic Grüneisen parameter at 0.2 K. increases by more than a factor 10 in between 6 to 7.5 T. For any field-tuned QCP, the magnetic Grüneisen parameter displays a generic divergence Zhu et al. (2003). Thus, the inverse of the Grüneisen parameter versus field must follow a linear dependence and crosses zero at the critical field. As shown in the inset of Fig. 3, this universal dependence is indeed observed, yielding a critical field very close to , which confirms our heat capacity analysis.
At fields beyond a cascade of further sign changes and anomalies is found in . They are associated with metamagnetic transitions M2 and M3 and respcetively the SDW phases A and B Stingl et al. (2013); Lester et al. (2015), as well as (see the green arrows) an anomaly labeled ”C” in the phase diagram of Fig. 1, whose magnetic Grüneisen parameter signature is discussed in SM Tokiwa et al. .
Each zero-crossing of from negative to positive with increasing field indicates an entropy accumulation which arises either above a QCP or at the boundary of an ordered phase. Although the behavior is very complex, it is qualitatively similar to the field dependence of the low-temperature thermal expansion coefficient Gegenwart et al. (2006). A simpler field dependence with only one sign change of related to M2, is found at elevated temperatures above 1 K Tokiwa et al. . There, the thermodynamic properties are mostly influenced by QCEP2 (cf. Fig. 1).
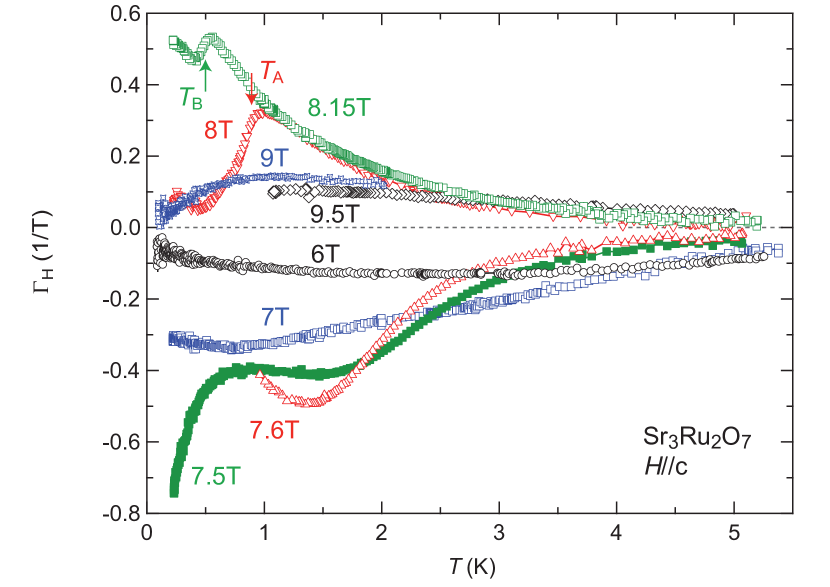
In addition to isothermal measurements, we also study the temperature dependence of at various fields, cf. Figure 4. At K, all curves below show a negative , while it is positive for . Since , where the heat capacity , this reflects the change of sign in the temperature dependence of the magnetization associated with metamagnetism (ordinary paramagnetic behavior below and field polarized behavior above ). The overall symmetric behavior of with respect to the critical field of QCEP2, is reflecting the Ising symmetry of critical metamagnetic fluctuations Zacharias and Garst (2013). Upon cooling, increases within the critical regime of QCEP2 and passes a maximum upon entering the low-temperature FL state, as seen e.g. for the 9 T data in Fig. 4. Transitions to phases A and B lead to distinct anomalies indicated by arrows. Particularly interesting behavior is found at 7.5 T where upon cooling passes the minimum at 1.5 K, due to the FL crossover of QCEP2, but subsequently displays a negative divergence as , related to the nearby QCEP1 (cf. Fig. 1).
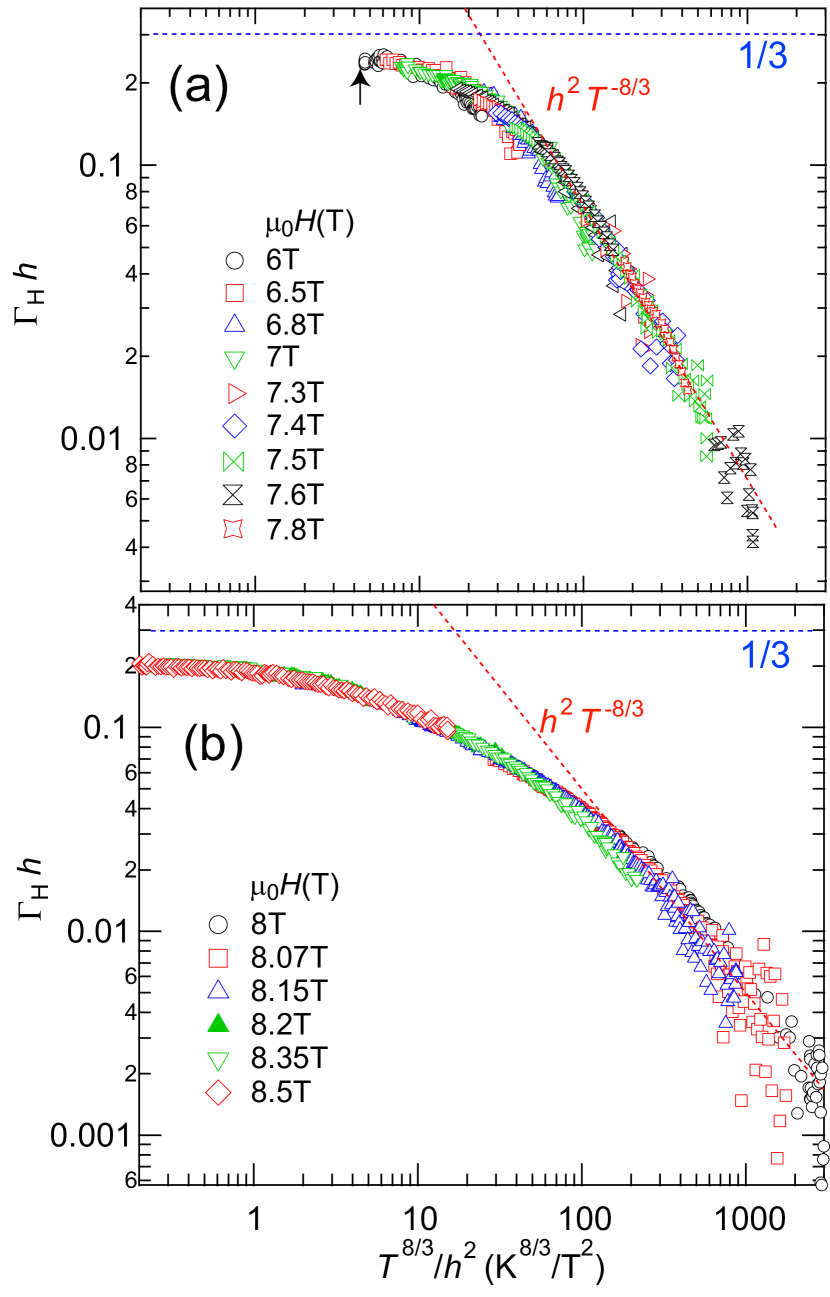
We now turn to a quantitative comparison of our data with the theory of metamagnetic quantum criticality Millis et al. (2002); Zacharias and Garst (2013). The latter predicts in the quantum critical and in FL regime, where denotes the dimensionality and . This leads to universal scaling in a plot of vs , where for . Respective scaling behavior of our data is shown in Figure 5. Here we fixed the critical field to 7.845 T Gegenwart et al. (2006), which is the position of QCEP2. The data collapse over several orders of magnitude, similar as previously found for thermal expansion Gegenwart et al. (2006), proves quantum critical behavior and indicates the applicability of the itinerant theory. However, a close inspection provides further information Tokiwa et al. . First, for fields below , scaling is cut-off near the crossover to the FL regime. This could be associated to the influence of QCEP1, as discussed above. Second, for fields the data within the FL regime approach a saturation of , which is smaller than the value 1/3 predicted for a QCEP with dimensionality Zacharias and Garst (2013) and may indicate that the effective dimensionality slightly increases at large fields. The value of 0.2 would correspond to . Metamagnetism in Sr3Ru2O7 is supposed to arise from van Hove singularities near the Fermi level Tamai et al. (2008). A change of the de Haas-van Alphen frequencies near 8 T has been ascribed to magnetic breakdown Mercure et al. (2010). This could explain the increase of the effective dimensionality of critical fluctuations, deduced from our scaling analysis.
The different regimes where the magnetic Grüneisen parameter displays scaling with respect to QCEP 1 and QCEP2 are indicated in Fig. 1. In between both regimes neither scaling works, because criticality from both instabilities is adding up (see SM Tokiwa et al. ). Next, we discuss the influence of the ordered phases A and B. In the approach of these phase transitions, data deviate from the expected quantum critical scaling. This could be naturally explained by additional contributions to the free energy arising from classical critical behavior. Furthermore, there is an anomalous depression of at 9 T below 1 K (cf. Fig. 4), which could not be accounted for by the scaling due to QCEP2. The magnetic field dependence of (Fig. 3, see also SM Tokiwa et al. ) indicates low-temperature anomalies in this field regime, labeled ”C” in the phase diagram (Fig. 1). Since heat capacity does not show an anomaly these are rather weak thermodynamic signatures for phase formation. The fields where these anomalies are observed are temperature dependent. Thus, it is unlikely, that these anomalies originate from low frequency quantum oscillations Rost et al. (2009).
Our measurements of the magnetic Grüneisen parameter and specific heat coefficient establish the existence of two itinerant metamagnetic QCEPs in bilayer strontium ruthenate Sr3Ru2O7 for magnetic fields applied parallel to the -direction. QCEP1 appears at a metamagnetic crossover near 7.5 T while QCEP2, which has already previously been established, is located at 7.845 T. The phase diagram shown in Fig. 1 indicates the scaling regimes ”QC1” and ”QC2” determined from the magnetic Grüneisen parameter behavior (see also SM Tokiwa et al. ). While ”QC2” is largely extended at elevated temperatures, ”QC1” is confined to a narrow regimes close to QCEP1. In between these scaling regimes, there exist a range in phase space, in which scaling fails due to the superposition of criticality from both instabilities. The phase diagram is even richer and contains also two SDW phases A and B Lester et al. (2015) and some anomalous yet unidentified regime labeled ”C”. Likely, the observed complexity is related to the complicated electronic structure of this material Tamai et al. (2008). The Fermi surface contains several pockets that could give rise to nesting and sheets near a van Hove singularity. From a general perspective, multiple quantum criticality may be of origin of anomalous behaviors in different material classes, including heavy-fermions and high- superconductors. The Grüneisen parameter is ideally suited to disentangle multiple quantum criticality.
Stimulating discussions with M. Brando, M. Garst and C. Stingl are gratefully acknowledged.
References
- Sachdev (1999) S. Sachdev, Quantum Phase Transitions (Cambridge University Press, Cambridge, UK, 1999).
- Gegenwart et al. (2008) P. Gegenwart, Q. Si, and F. Steglich, Nat. Phys. 4, 186 (2008).
- Millis et al. (2002) A. J. Millis, A. J. Schofield, G. G. Lonzarich, and S. A. Grigera, Phys. Rev. Lett. 88, 217204 (2002).
- Daou et al. (2006) R. Daou, C. Bergemann, and S. R. Julian, Phys. Rev. Lett. 96, 026401 (2006).
- Weickert et al. (2010) F. Weickert, M. Brando, F. Steglich, P. Gegenwart, and M. Garst, Phys. Rev. B 81, 134438 (2010).
- Aoki et al. (2011) D. Aoki, T. Combier, V. Taufour, T. D. Matsuda, G. Knebel, H. Kotegawa, and J. Flouquet, J. Phys. Soc. Jpn. 80, 094711 (2011).
- Grigera et al. (2003) S. A. Grigera, R. A. Borzi, A. P. Mackenzie, S. R. Julian, R. S. Perry, and Y. Maeno, Phys. Rev. B 67, 214427 (2003).
- Rost et al. (2009) A. W. Rost, R. S. Perry, J.-F. Mercure, A. P. Mackenzie, and S. A. Grigera, Science 325, 1360 (2009).
- Perry et al. (2004) R. S. Perry, K. Kitagawa, S. A. Grigera, R. A. Borzi, A. P. Mackenzie, K. Ishida, and Y. Maeno, Phys. Rev. Lett. 92, 166602 (2004).
- Grigera et al. (2004) S. A. Grigera, P. Gegenwart, R. A. Borzi, F. Weickert, A. J. Schofield, R. S. Perry, T. Tayama, T. Sakakibara, Y. Maeno, A. G. Green, and A. P. Mackenzie, Science 306, 1154 (2004).
- Gegenwart et al. (2006) P. Gegenwart, F. Weickert, M. Garst, R. S. Perry, and Y. Maeno, Phys. Rev. Lett. 96, 136402 (2006).
- Lester et al. (2015) C. Lester, S. Ramos, R. S. Perry, T. P. Croft, R. I. Bewley, T. Guidi, P. Manuel, D. D. Khalyavin, E. M. Forgan, and S. M. Hayden, Nat. Mater.. 14, 373 (2015).
- Borzi et al. (2007) R. A. Borzi, S. A. Grigera, J. Farrell, R. S. Perry, S. J. S. Lister, S. L. Lee, D. A. Tennant, Y. Maeno, and A. P. Mackenzie, Science 315, 214 (2007).
- Stingl et al. (2013) C. Stingl, R. S. Perry, Y. Maeno, and P. Gegenwart, Phys. Stat. Sol. (b) 250, 450 (2013).
- Rost et al. (2010) A. W. Rost, A. M. Berridge, R. S. Perry, J.-F. Mercure, S. A. Grigera, and A. P. Mackenzie, Phys. Status Solidi (b) 247, 513 (2010).
- (16) Y. Tokiwa, M. Machalwat, R. S. Perry, and P. Gegenwart, See Supplemental Material.
- Zhu et al. (2003) L. Zhu, M. Garst, A. Rosch, and Q. Si, Phys. Rev. Lett. 91, 066404 (2003).
- Garst and Rosch (2005) M. Garst and A. Rosch, Phys. Rev. B 72, 205129 (2005).
- Tokiwa and Gegenwart (2011) Y. Tokiwa and P. Gegenwart, Rev. Sci. Inst. 82, 013905 (2011).
- Tokiwa et al. (2009) Y. Tokiwa, T. Radu, C. Geibel, F. Steglich, and P. Gegenwart, Phys. Rev. Lett. 102, 066401 (2009).
- Tokiwa et al. (2013a) Y. Tokiwa, E. D. Bauer, and P. Gegenwart, Phys. Rev. Lett. 111, 107003 (2013a).
- Tokiwa et al. (2013b) Y. Tokiwa, M. Garst, P. Gegenwart, S. L. Bud’ko, and P. C. Canfield, Phys. Rev. Lett. 111, 116401 (2013b).
- Perry and Maeno (2004) R. S. Perry and Y. Maeno, J. Crystal Growth 271, 134 (2004).
- Zacharias and Garst (2013) M. Zacharias and M. Garst, Phys. Rev. B 87, 075119 (2013).
- Aoki et al. (2001) H. Aoki, M. Takashita, N. Kimura, T. Terashima, S. Uji, T. Matsumoto, and Y. Ōnuki, J. Phys. Soc. Jpn. 70, 774 (2001).
- Tamai et al. (2008) A. Tamai, M. P. Allan, J. F. Mercure, W. Meevasana, R. Dunkel, D. H. Lu, R. S. Perry, A. P. Mackenzie, D. J. Singh, Z.-X. Shen, and F. Baumberger, Phys. Rev. Lett. 101, 026407 (2008).
- Mercure et al. (2010) J.-F. Mercure, A. W. Rost, E. C. T. O’Farrell, S. K. Goh, R. S. Perry, M. L. Sutherland, S. A. Grigera, R. A. Borzi, P. Gegenwart, A. S. Gibbs, and A. P. Mackenzie, Phys. Rev. B 81, 235103 (2010).
SUPPLEMENTAL MATERIAL
I Field dependence of the specific heat
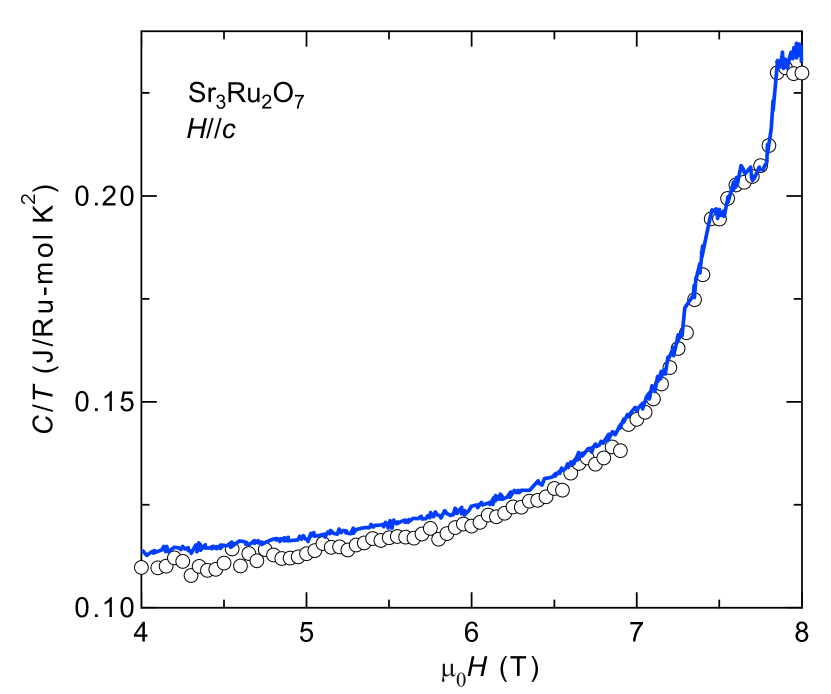
In the main text, we are discussing the field dependence of our heat capacity data below 7.5 T. It shows a power-law divergence towards with exponent 1/3 in accordance with the itinerant theory for a two-dimensional QCEP. However, previous data of the field dependence of the entropy increment, obtained by non-adiabatic magnetocaloric effect measurements in A.W. Rost et al., Science 325, 1360 (2009), as well as continuous field sweep a.c. heat capacity data at 0.25 K, see A.W. Rost et al., Phys. Stat Sol. B 247, 513 (2010), had been described differently (see main text). Rost et al. have used the function (note the different exponent and different critical field) that would be highly incompatible with the prediction from the itinerant theory. It is therefore interesting to directly compare their data with ours. As shown in Figure 6 both data sets for (note that in the Fermi liquid regime is temperature independent) differ by less than 4 mJ/Ru-mol K2 equivalent to 2%. This nicely indicates the reproducibility of the thermodynamic results on Sr3Ru2O7. Based on our magnetic Grüneisen analysis (cf. inset of Fig. 3 main text), the description of by in contrast to is appropriate.
II Field dependence of the magnetic Grüneisen ratio
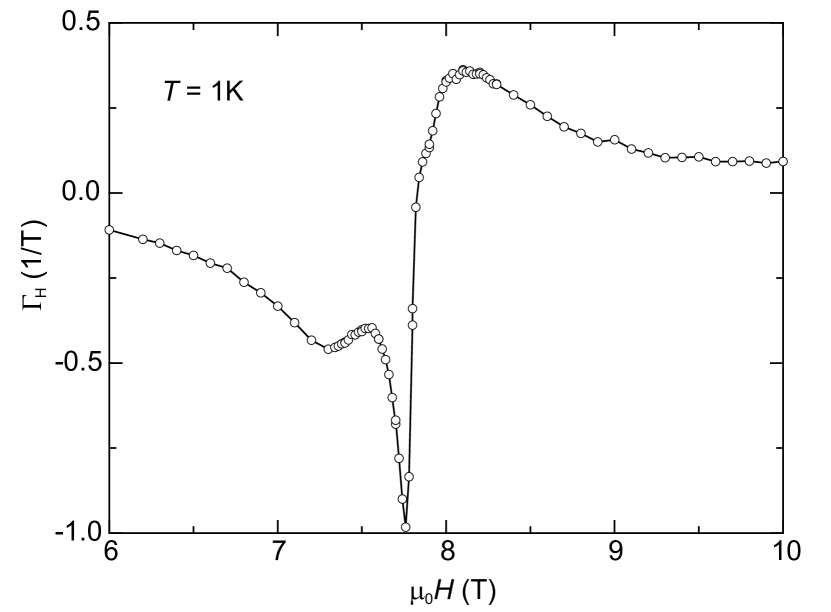
As shown in Fig. 3 in the main text, at 0.2 K the magnetic Grüneisen ratio displays very complicated behavior with several extrema and sign changes. Figure 7 displays respective data taken at 1 K. Upon increasing magnetic field from 6 T, the Grüneisen parameter is negative and increases in absolute value. Near it passes a local minimum and maximum and continues to diverge until a sharp minimum and sign change is reached very close to , beyond which is positive and decreases with increasing . Since the zero crossing of the magnetic Grüneisen ratio, which occurs along a line above the QCEP2 (shown in Fig. 1 of the main text), indicates an accumulation of entropy. This is a generic signature of quantum criticality (cf. M. Garst and A. Roch, Phys. Rev. B 72, 205129 (2005)). At lower temperatures, the interplay of QCEP1 and QCEP2 results in a more complicated behavior of displayed in Fig. 3 of the main text.
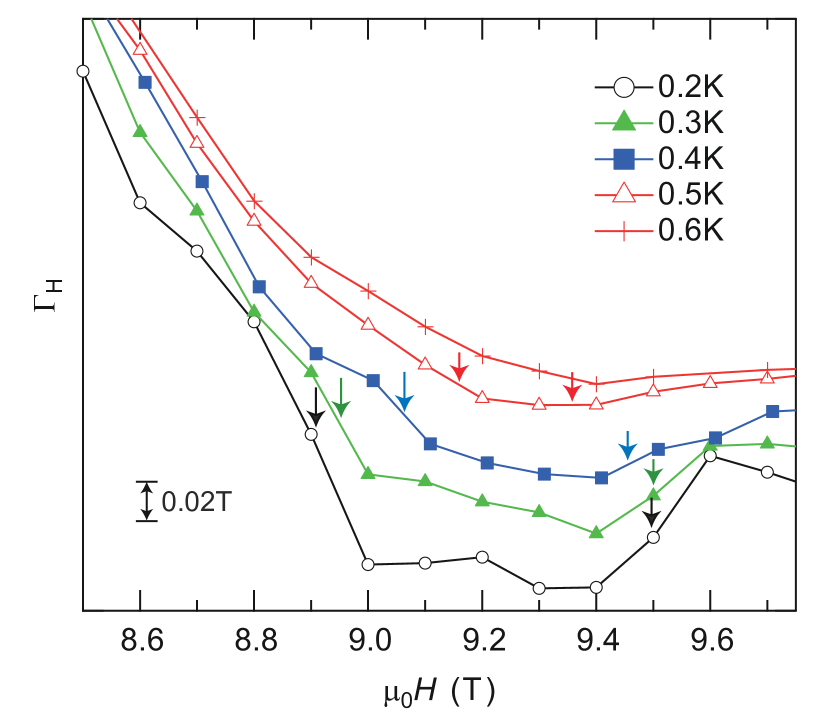
Next we focus on isothermal field data of for large fields between 8.5 and 10 T shown in Figure 8. The colored arrows indicate anomalous behavior, leading to inflection points in the field dependence. The respective fields are temperature dependent, cf. regime ”C” in the phase diagram Fig. 1 of the main text. This excludes quantum oscillations as origin. We note, that no clear signature in heat capacity has been found in this regime of phase space.
III Scaling analysis for QCEP1
The phase diagram displayed in Fig. 1, main text, illustrates the range in - parameter space where quantum critical scaling in the magnetic Grüneisen parameter with respect to the first (QC1) and second (QC2) quantum critical end point holds, respectively. It also shows a regime ”QC1+QC2” where scaling fails because of the superposition of criticality from both instabilities. Furthermore scaling fails near the spin-density-wave states A and B and the yet unidentified regime C. In this section we focus on the scaling and its failure of due to QCEP1, while in the subsequent section respective analysis for QCEP2 is detailed.
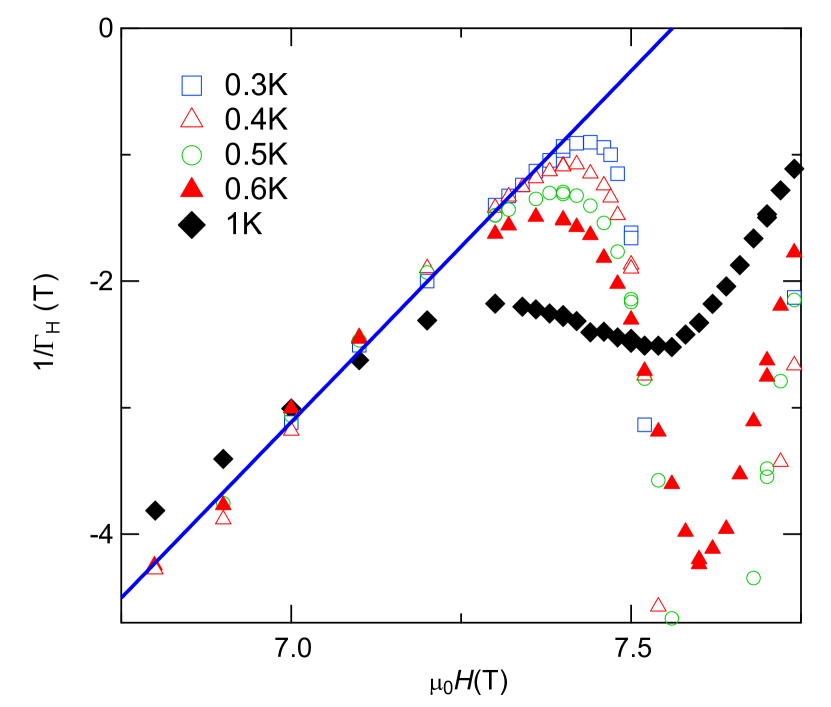
As illustrated in Figs. 2 and 3 (inset) of the main text, at 0.2 K, specific heat and follow the field dependences in accordance with the scaling predictions for QCEP1. Here we analyze up to which temperature this scaling holds. For this purpose, Figure 9 shows a plot of 1/ vs at several elevated temperatures. Since for field tuned instabilities with universal (temperature independent) pre-factor, such plot is best suited to determine the upper bound in temperature of the scaling regime. It is found, that all curves up to 0.6 K follow a universal dependence indicated by the blue line, while the data at 1 K follow a clearly different slope (incompatible with the expected universality). In addition they would extrapolate to a very different critical field, but the critical field should be temperature independent. Thus, scaling with respect to QCEP1 breaks down in between 0.6 and 1 K.
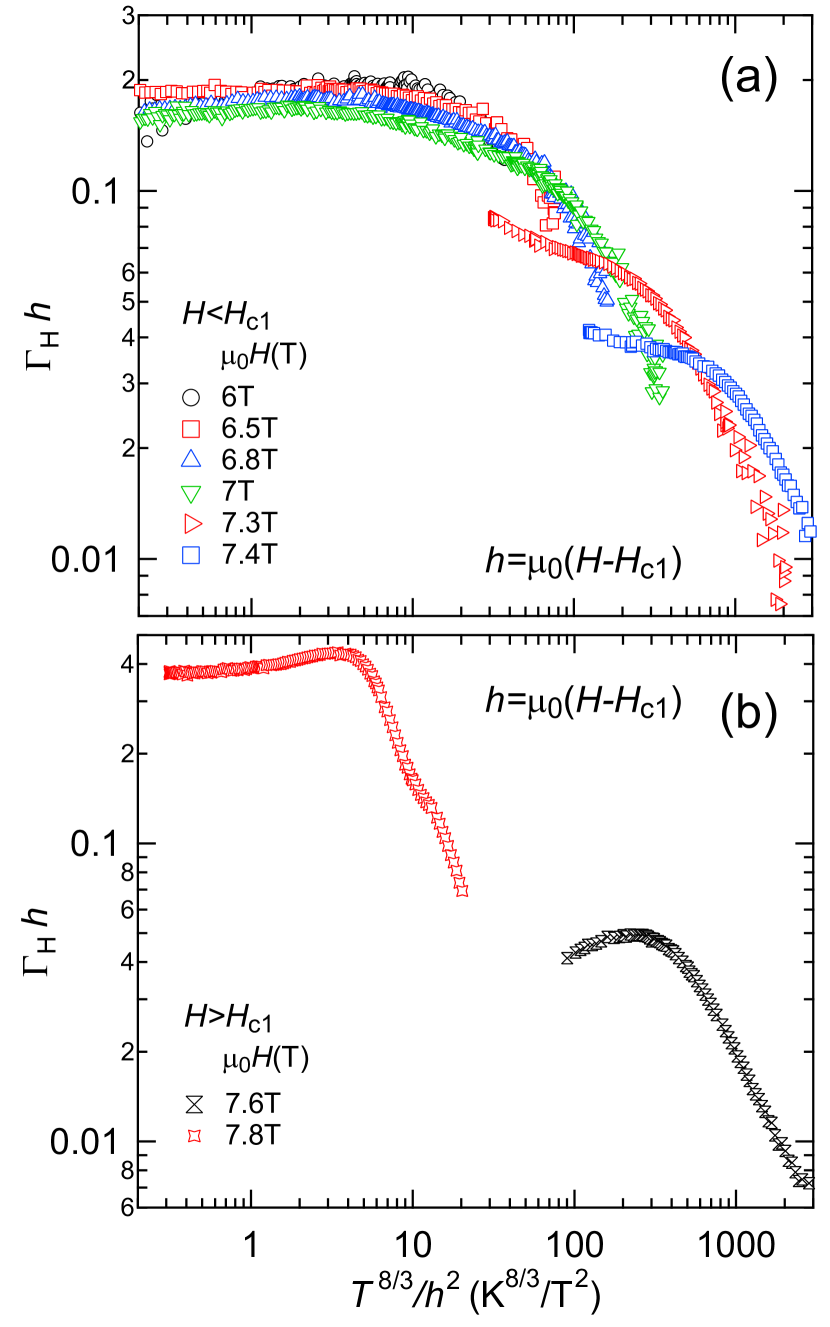
Next, we show scaling plots, similar to those of Fig. 5 in the main text, but now for the critical field of QCEP1, T. Figure. 10 (a) shows the scaling analysis using for fields below the critical field, while part (b) displays data for . The latter case is restricted to a very narrow field interval, because in the approach of T the magnetic Grüneisen parameter changes sign due to the influence of QCEP2. Apparently, the data do not collapse at all for , which is attributed to the influence of QCEP2. In addition for a data collapse is only found at low temperatures, consistent with the above observation of a breakdown of scaling at K.
IV Scaling analysis for QCEP2
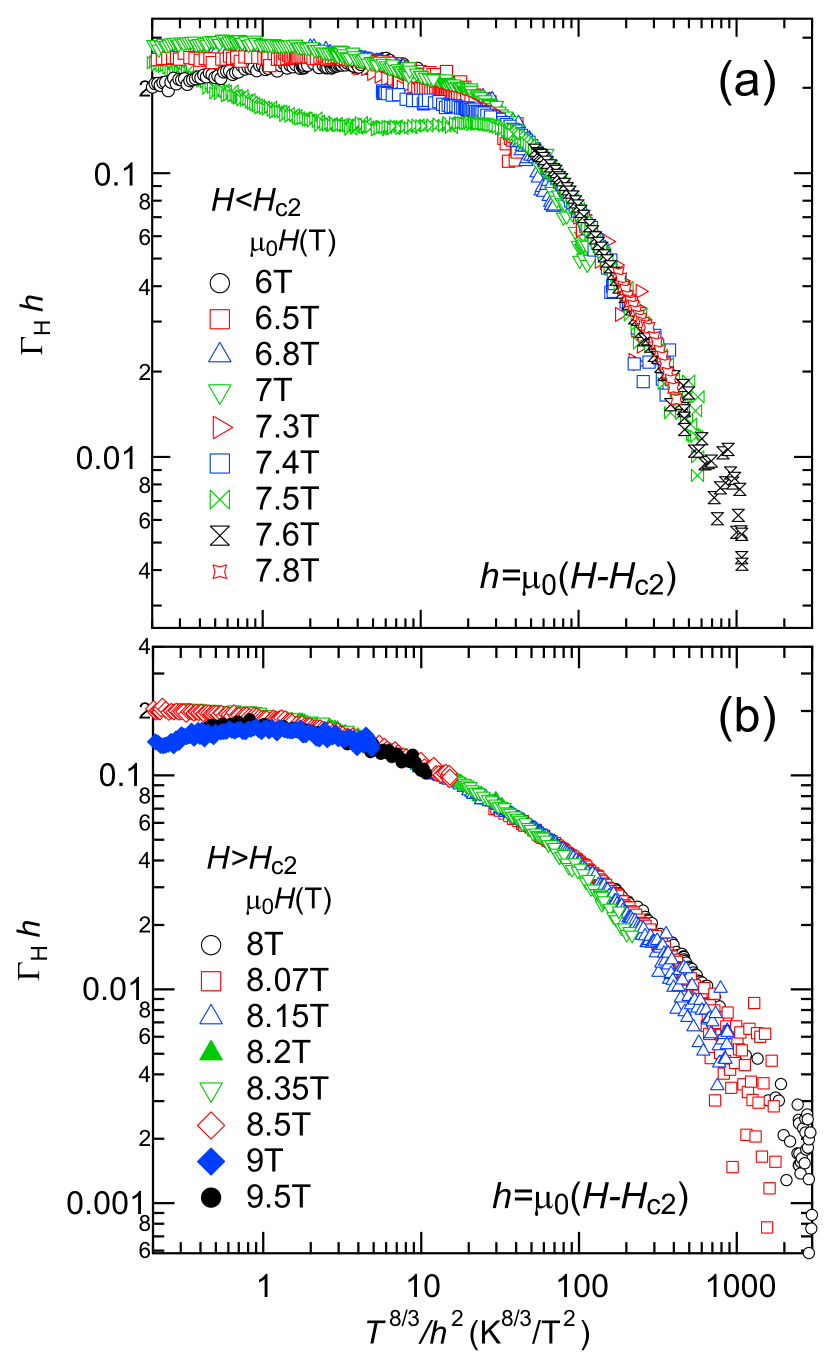
We now turn to the determination of the range in - parameter space where scaling with respect to QCEP2 works (cf. regime ”QC2” in Fig. 1 main text). For this purpose, we re-plot Fig. 5 of the main text, but now include all data to discuss where scaling fails.
In Figure 11 (a) deviation from scaling arises due to the presence of QCEP1 at fields below 7.5 T for temperatures below about 1 K. The very good data collapse at large temperatures indicates, that QCEP1 is clearly dominant at elevated temperatures for all fields .
Figure 11 (b) indicates that for fields between 9 and 9.5 T deviation from scaling is found at low temperatures, which could be associated with the regime ”C”.
To summarize, the magnetic Grüneisen ratio indicates multiple quantum criticality with a QCEP1 near T and a QCEP2 near T. Using scaling analysis with respect to both and , we determined the regimes ”QC1” and ”QC2” in the phase diagram of Fig. 1, main text, as well as the regime labeled ”QC1+QC2” in which latter scaling fails because of the superposition of critical behavior from both instabilities.