C. P. Shen
Beihang University, Beijing 100191
C. Z. Yuan
Institute of High Energy Physics, Chinese Academy of Sciences, Beijing 100049
Y. Ban
Peking University, Beijing 100871
H. Aihara
Department of Physics, University of Tokyo, Tokyo 113-0033
D. M. Asner
Pacific Northwest National Laboratory, Richland, Washington 99352
I. Badhrees
Department of Physics, Faculty of Science, University of Tabuk, Tabuk 71451
King Abdulaziz City for Science and Technology, Riyadh 11442
A. M. Bakich
School of Physics, University of Sydney, New South Wales 2006
E. Barberio
School of Physics, University of Melbourne, Victoria 3010
P. Behera
Indian Institute of Technology Madras, Chennai 600036
V. Bhardwaj
Indian Institute of Science Education and Research Mohali, SAS Nagar, 140306
B. Bhuyan
Indian Institute of Technology Guwahati, Assam 781039
J. Biswal
J. Stefan Institute, 1000 Ljubljana
A. Bondar
Budker Institute of Nuclear Physics SB RAS, Novosibirsk 630090
Novosibirsk State University, Novosibirsk 630090
G. Bonvicini
Wayne State University, Detroit, Michigan 48202
A. Bozek
H. Niewodniczanski Institute of Nuclear Physics, Krakow 31-342
M. Bračko
University of Maribor, 2000 Maribor
J. Stefan Institute, 1000 Ljubljana
T. E. Browder
University of Hawaii, Honolulu, Hawaii 96822
D. Červenkov
Faculty of Mathematics and Physics, Charles University, 121 16 Prague
V. Chekelian
Max-Planck-Institut für Physik, 80805 München
A. Chen
National Central University, Chung-li 32054
K. Chilikin
P.N. Lebedev Physical Institute of the Russian Academy of Sciences, Moscow 119991
Moscow Physical Engineering Institute, Moscow 115409
R. Chistov
P.N. Lebedev Physical Institute of the Russian Academy of Sciences, Moscow 119991
Moscow Physical Engineering Institute, Moscow 115409
K. Cho
Korea Institute of Science and Technology Information, Daejeon 305-806
V. Chobanova
Max-Planck-Institut für Physik, 80805 München
S.-K. Choi
Gyeongsang National University, Chinju 660-701
Y. Choi
Sungkyunkwan University, Suwon 440-746
D. Cinabro
Wayne State University, Detroit, Michigan 48202
J. Dalseno
Max-Planck-Institut für Physik, 80805 München
Excellence Cluster Universe, Technische Universität München, 85748 Garching
M. Danilov
Moscow Physical Engineering Institute, Moscow 115409
P.N. Lebedev Physical Institute of the Russian Academy of Sciences, Moscow 119991
N. Dash
Indian Institute of Technology Bhubaneswar, Satya Nagar 751007
S. Di Carlo
Wayne State University, Detroit, Michigan 48202
Z. Doležal
Faculty of Mathematics and Physics, Charles University, 121 16 Prague
Z. Drásal
Faculty of Mathematics and Physics, Charles University, 121 16 Prague
D. Dutta
Tata Institute of Fundamental Research, Mumbai 400005
S. Eidelman
Budker Institute of Nuclear Physics SB RAS, Novosibirsk 630090
Novosibirsk State University, Novosibirsk 630090
H. Farhat
Wayne State University, Detroit, Michigan 48202
J. E. Fast
Pacific Northwest National Laboratory, Richland, Washington 99352
T. Ferber
Deutsches Elektronen–Synchrotron, 22607 Hamburg
B. G. Fulsom
Pacific Northwest National Laboratory, Richland, Washington 99352
V. Gaur
Tata Institute of Fundamental Research, Mumbai 400005
N. Gabyshev
Budker Institute of Nuclear Physics SB RAS, Novosibirsk 630090
Novosibirsk State University, Novosibirsk 630090
A. Garmash
Budker Institute of Nuclear Physics SB RAS, Novosibirsk 630090
Novosibirsk State University, Novosibirsk 630090
P. Goldenzweig
Institut für Experimentelle Kernphysik, Karlsruher Institut für Technologie, 76131 Karlsruhe
J. Haba
High Energy Accelerator Research Organization (KEK), Tsukuba 305-0801
SOKENDAI (The Graduate University for Advanced Studies), Hayama 240-0193
K. Hayasaka
Niigata University, Niigata 950-2181
H. Hayashii
Nara Women’s University, Nara 630-8506
W.-S. Hou
Department of Physics, National Taiwan University, Taipei 10617
T. Iijima
Kobayashi-Maskawa Institute, Nagoya University, Nagoya 464-8602
Graduate School of Science, Nagoya University, Nagoya 464-8602
G. Inguglia
Deutsches Elektronen–Synchrotron, 22607 Hamburg
A. Ishikawa
Department of Physics, Tohoku University, Sendai 980-8578
R. Itoh
High Energy Accelerator Research Organization (KEK), Tsukuba 305-0801
SOKENDAI (The Graduate University for Advanced Studies), Hayama 240-0193
W. W. Jacobs
Indiana University, Bloomington, Indiana 47408
H. B. Jeon
Kyungpook National University, Daegu 702-701
K. K. Joo
Chonnam National University, Kwangju 660-701
T. Julius
School of Physics, University of Melbourne, Victoria 3010
K. H. Kang
Kyungpook National University, Daegu 702-701
D. Y. Kim
Soongsil University, Seoul 156-743
J. B. Kim
Korea University, Seoul 136-713
K. T. Kim
Korea University, Seoul 136-713
S. H. Kim
Hanyang University, Seoul 133-791
Y. J. Kim
Korea Institute of Science and Technology Information, Daejeon 305-806
K. Kinoshita
University of Cincinnati, Cincinnati, Ohio 45221
P. Kodyš
Faculty of Mathematics and Physics, Charles University, 121 16 Prague
S. Korpar
University of Maribor, 2000 Maribor
J. Stefan Institute, 1000 Ljubljana
D. Kotchetkov
University of Hawaii, Honolulu, Hawaii 96822
P. Križan
Faculty of Mathematics and Physics, University of Ljubljana, 1000 Ljubljana
J. Stefan Institute, 1000 Ljubljana
P. Krokovny
Budker Institute of Nuclear Physics SB RAS, Novosibirsk 630090
Novosibirsk State University, Novosibirsk 630090
T. Kuhr
Ludwig Maximilians University, 80539 Munich
A. Kuzmin
Budker Institute of Nuclear Physics SB RAS, Novosibirsk 630090
Novosibirsk State University, Novosibirsk 630090
Y.-J. Kwon
Yonsei University, Seoul 120-749
J. S. Lange
Justus-Liebig-Universität Gießen, 35392 Gießen
C. H. Li
School of Physics, University of Melbourne, Victoria 3010
H. Li
Indiana University, Bloomington, Indiana 47408
L. Li
University of Science and Technology of China, Hefei 230026
Y. Li
Virginia Polytechnic Institute and State University, Blacksburg, Virginia 24061
L. Li Gioi
Max-Planck-Institut für Physik, 80805 München
J. Libby
Indian Institute of Technology Madras, Chennai 600036
D. Liventsev
Virginia Polytechnic Institute and State University, Blacksburg, Virginia 24061
High Energy Accelerator Research Organization (KEK), Tsukuba 305-0801
T. Luo
University of Pittsburgh, Pittsburgh, Pennsylvania 15260
M. Masuda
Earthquake Research Institute, University of Tokyo, Tokyo 113-0032
T. Matsuda
University of Miyazaki, Miyazaki 889-2192
D. Matvienko
Budker Institute of Nuclear Physics SB RAS, Novosibirsk 630090
Novosibirsk State University, Novosibirsk 630090
A. Moll
Max-Planck-Institut für Physik, 80805 München
Excellence Cluster Universe, Technische Universität München, 85748 Garching
H. K. Moon
Korea University, Seoul 136-713
R. Mussa
INFN - Sezione di Torino, 10125 Torino
M. Nakao
High Energy Accelerator Research Organization (KEK), Tsukuba 305-0801
SOKENDAI (The Graduate University for Advanced Studies), Hayama 240-0193
T. Nanut
J. Stefan Institute, 1000 Ljubljana
K. J. Nath
Indian Institute of Technology Guwahati, Assam 781039
Z. Natkaniec
H. Niewodniczanski Institute of Nuclear Physics, Krakow 31-342
M. Nayak
Wayne State University, Detroit, Michigan 48202
K. Negishi
Department of Physics, Tohoku University, Sendai 980-8578
S. Nishida
High Energy Accelerator Research Organization (KEK), Tsukuba 305-0801
SOKENDAI (The Graduate University for Advanced Studies), Hayama 240-0193
S. Ogawa
Toho University, Funabashi 274-8510
S. Okuno
Kanagawa University, Yokohama 221-8686
S. L. Olsen
Seoul National University, Seoul 151-742
P. Pakhlov
P.N. Lebedev Physical Institute of the Russian Academy of Sciences, Moscow 119991
Moscow Physical Engineering Institute, Moscow 115409
G. Pakhlova
P.N. Lebedev Physical Institute of the Russian Academy of Sciences, Moscow 119991
Moscow Institute of Physics and Technology, Moscow Region 141700
B. Pal
University of Cincinnati, Cincinnati, Ohio 45221
R. Pestotnik
J. Stefan Institute, 1000 Ljubljana
M. Petrič
J. Stefan Institute, 1000 Ljubljana
L. E. Piilonen
Virginia Polytechnic Institute and State University, Blacksburg, Virginia 24061
C. Pulvermacher
Institut für Experimentelle Kernphysik, Karlsruher Institut für Technologie, 76131 Karlsruhe
M. Ritter
Ludwig Maximilians University, 80539 Munich
A. Rostomyan
Deutsches Elektronen–Synchrotron, 22607 Hamburg
Y. Sakai
High Energy Accelerator Research Organization (KEK), Tsukuba 305-0801
SOKENDAI (The Graduate University for Advanced Studies), Hayama 240-0193
S. Sandilya
University of Cincinnati, Cincinnati, Ohio 45221
L. Santelj
High Energy Accelerator Research Organization (KEK), Tsukuba 305-0801
T. Sanuki
Department of Physics, Tohoku University, Sendai 980-8578
V. Savinov
University of Pittsburgh, Pittsburgh, Pennsylvania 15260
T. Schlüter
Ludwig Maximilians University, 80539 Munich
O. Schneider
École Polytechnique Fédérale de Lausanne (EPFL), Lausanne 1015
G. Schnell
University of the Basque Country UPV/EHU, 48080 Bilbao
IKERBASQUE, Basque Foundation for Science, 48013 Bilbao
C. Schwanda
Institute of High Energy Physics, Vienna 1050
Y. Seino
Niigata University, Niigata 950-2181
K. Senyo
Yamagata University, Yamagata 990-8560
O. Seon
Graduate School of Science, Nagoya University, Nagoya 464-8602
I. S. Seong
University of Hawaii, Honolulu, Hawaii 96822
M. E. Sevior
School of Physics, University of Melbourne, Victoria 3010
T.-A. Shibata
Tokyo Institute of Technology, Tokyo 152-8550
J.-G. Shiu
Department of Physics, National Taiwan University, Taipei 10617
F. Simon
Max-Planck-Institut für Physik, 80805 München
Excellence Cluster Universe, Technische Universität München, 85748 Garching
A. Sokolov
Institute for High Energy Physics, Protvino 142281
E. Solovieva
P.N. Lebedev Physical Institute of the Russian Academy of Sciences, Moscow 119991
Moscow Institute of Physics and Technology, Moscow Region 141700
M. Starič
J. Stefan Institute, 1000 Ljubljana
T. Sumiyoshi
Tokyo Metropolitan University, Tokyo 192-0397
M. Takizawa
Showa Pharmaceutical University, Tokyo 194-8543
K. Tanida
Seoul National University, Seoul 151-742
F. Tenchini
School of Physics, University of Melbourne, Victoria 3010
K. Trabelsi
High Energy Accelerator Research Organization (KEK), Tsukuba 305-0801
SOKENDAI (The Graduate University for Advanced Studies), Hayama 240-0193
M. Uchida
Tokyo Institute of Technology, Tokyo 152-8550
T. Uglov
P.N. Lebedev Physical Institute of the Russian Academy of Sciences, Moscow 119991
Moscow Institute of Physics and Technology, Moscow Region 141700
Y. Unno
Hanyang University, Seoul 133-791
S. Uno
High Energy Accelerator Research Organization (KEK), Tsukuba 305-0801
SOKENDAI (The Graduate University for Advanced Studies), Hayama 240-0193
G. Varner
University of Hawaii, Honolulu, Hawaii 96822
A. Vinokurova
Budker Institute of Nuclear Physics SB RAS, Novosibirsk 630090
Novosibirsk State University, Novosibirsk 630090
V. Vorobyev
Budker Institute of Nuclear Physics SB RAS, Novosibirsk 630090
Novosibirsk State University, Novosibirsk 630090
C. H. Wang
National United University, Miao Li 36003
M.-Z. Wang
Department of Physics, National Taiwan University, Taipei 10617
P. Wang
Institute of High Energy Physics, Chinese Academy of Sciences, Beijing 100049
X. L. Wang
Virginia Polytechnic Institute and State University, Blacksburg, Virginia 24061
M. Watanabe
Niigata University, Niigata 950-2181
Y. Watanabe
Kanagawa University, Yokohama 221-8686
K. M. Williams
Virginia Polytechnic Institute and State University, Blacksburg, Virginia 24061
E. Won
Korea University, Seoul 136-713
J. Yamaoka
Pacific Northwest National Laboratory, Richland, Washington 99352
S. D. Yang
Peking University, Beijing 100871
S. Yashchenko
Deutsches Elektronen–Synchrotron, 22607 Hamburg
Y. Yook
Yonsei University, Seoul 120-749
Y. Yusa
Niigata University, Niigata 950-2181
Z. P. Zhang
University of Science and Technology of China, Hefei 230026
V. Zhilich
Budker Institute of Nuclear Physics SB RAS, Novosibirsk 630090
Novosibirsk State University, Novosibirsk 630090
V. Zhukova
Moscow Physical Engineering Institute, Moscow 115409
V. Zhulanov
Budker Institute of Nuclear Physics SB RAS, Novosibirsk 630090
Novosibirsk State University, Novosibirsk 630090
A. Zupanc
Faculty of Mathematics and Physics, University of Ljubljana, 1000 Ljubljana
J. Stefan Institute, 1000 Ljubljana
Abstract
The branching fractions of the inclusive decays
into final states with a or a are measured
with improved precision to be and .
The first search for decays into states that decay
into a or a plus one or two charged tracks
yields no significant signals for states in any of the
examined decay modes, and upper limits on their production rates
in inclusive decays are determined.
pacs:
13.25.Gv, 14.40.Pq, 14.40.Rt
††preprint: Intended for Phys. Rev. D
During the past twelve years many charmoniumlike states, the
so-called “” particles, have been
reported EPJC.71.1534 . Most cannot be described
well by quarkonium potential
models ARNRS.58.51 ; EPJC.71.1534 ; EPJC.74.2981 . Their unusual
properties have stimulated considerable theoretical interest and
various interpretations have been proposed, including tetraquarks,
molecules, hybrids, or hadrocharmonia EPJC.71.1534 ; EPJC.74.2981 ; IJMPA.29.1430046 .
To distinguish among these explanations, more experimental information is
needed, such as additional production processes and/or more decay
modes for these states. States with can be studied
with initial state radiation in Belle’s and BaBar’s large
data samples or via direct production in
collisions at BESIII. There is very little available
information on production in the decays of narrow
states apart from the searches for charge-parity-even
charmoniumlike states in PhysRevD.82.051504
and PhysRevD.87.071107 radiative decays.
A common feature of these
states is that they decay into a charmonium state such as
or and light hadrons.
Inclusive decays of into and
are observed with large branching
fractions of PhysRevD.70.072001 ; PhysLettB224.445 and PhysRevD.70.072001 , respectively, in which some of
the states might have been produced before decaying into or
.
The analysis utilizes a fb-1 data sample collected at
the peak of the resonance, containing decays, and a fb-1 data sample
collected off-resonance at that is
used to determine the levels of possible irreducible continuum
contributions. The data were collected with the Belle
detector Abashian2002117 ; PTEP201204D001 operated at the
KEKB asymmetric-energy
collider Kurokawa20031 ; PTEP201303A001 . Large
Monte Carlo (MC) event samples of each of the investigated
modes are generated with EVTGEN Lange2001152 to determine
signal line-shapes and efficiencies.
Both meson production in
inclusive decays and their decays into exclusive final states
containing a and light hadrons are generated
uniformly in phase space.
Inclusive production is generated in the same models and
subsequently decay according to their known branching
fractions ChinPhysC38.090001 ; unknown decay modes are
generated using the Lund fragmentation model in
PYTHIA JHEP2006.026 .
The Belle detector is a large solid angle magnetic spectrometer
that consists of a silicon vertex detector, a 50-layer
central drift chamber (CDC), an array of aerogel threshold
Cherenkov counters (ACC), a barrel-like arrangement of
time-of-flight scintillation counters (TOF), and an
electromagnetic calorimeter comprised of CsI(Tl) crystals (ECL) located
inside a superconducting solenoid coil that provides a
magnetic field. An iron flux-return yoke located outside the coil is
instrumented to detect mesons and to identify muons.
A detailed description of the Belle detector
can be found in Refs. Abashian2002117 ; PTEP201204D001 .
Charged tracks from the primary vertex with and
are selected, where and are the
impact parameters perpendicular to and along the beam direction, respectively,
with respect to the interaction point. In addition,
the transverse momentum of every charged track in the laboratory
frame is restricted to be larger than . Backgrounds from QED processes are significantly suppressed
by the requirement that the charged multiplicity () in
each event satisfies PhysRevD.70.071102 .
For charged tracks, information from different detector
subsystems including specific ionization in the
CDC, time measurements in the TOF and the response of the ACC
is combined to form the likelihood for particle species , where
, or like . Charged tracks with
are treated as kaons, while those with are considered to
be pions. With these conditions, the kaon (pion) identification
efficiency is () and the pion (kaon)
misidentification rate is about ().
Candidate lepton tracks from are required to have a muon
likelihood ratio
Abashian49169
or an electron likelihood ratio
Hanagaki485490 .
Furthermore, we require that a charged pion not be
identified as a muon or an electron with and .
To reduce the effect of bremsstrahlung and final-state radiation,
photons detected in the ECL within a cone of
the original electron or positron direction are included in the
calculation of the four-momentum. The
lepton-identification efficiencies for and are
about and , respectively.
Since a final-state or is common to all of the
studies reported here, we first select either a via its
( or ) decay mode or a
decaying into or .
For , a mass-constrained fit is applied
to the candidate.
After all the event selection requirements,
significant ,
, and
signals are seen in the
data sample, as shown in
Fig. 1.
The shaded histograms in this figure are the normalized continuum backgrounds that are determined
from the continuum data sample and
extrapolated down to the resonance energy. The
scale factor used for this extrapolation is
,
where ,
, and
are the ratios
of the integrated luminosities, cross sections, and efficiencies,
respectively, for the and continuum samples. The
MC-determined efficiencies for the and continuum
data samples are found to be nearly the same for all the decay
modes, and the dependence of the cross sections on is
assumed to be proportional to
PhysRevD.69.094027 ; PhysRevD.56.321 ; hep-hp13108597 .
The resulting scale factor is 0.098.
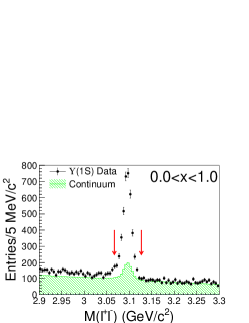
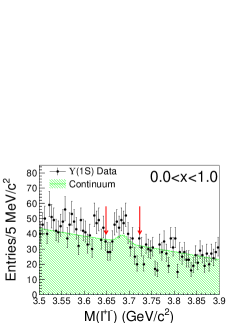
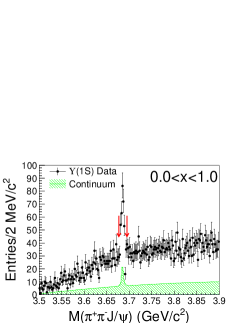
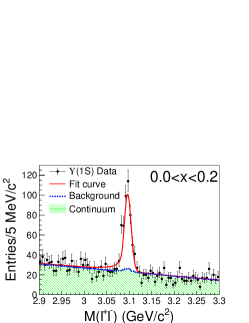
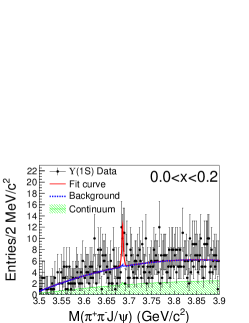
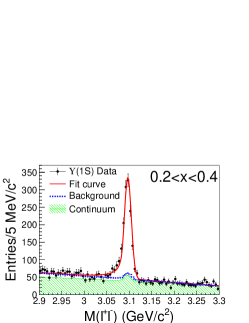
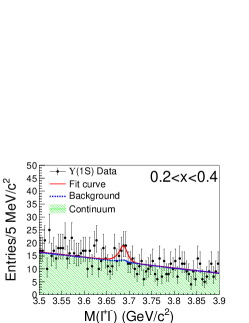
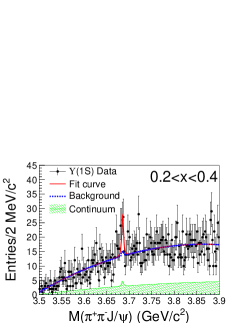
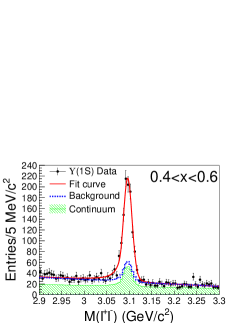
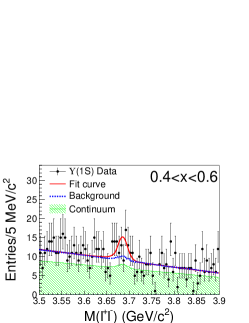
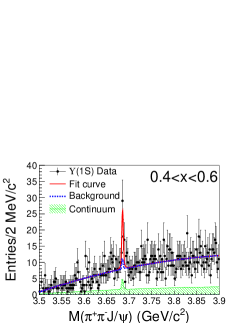
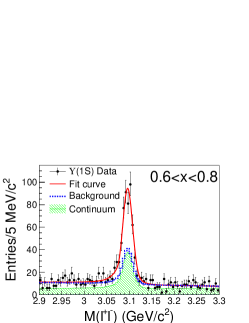
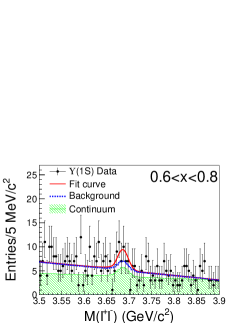
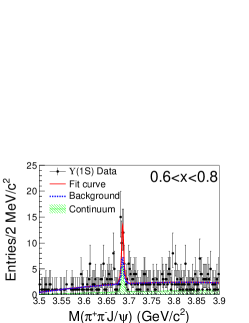
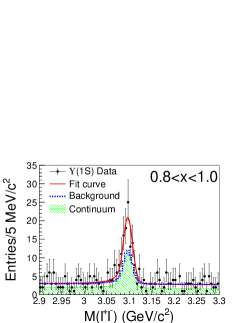
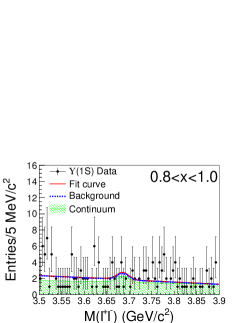
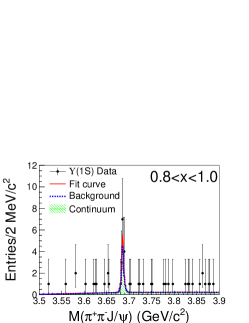
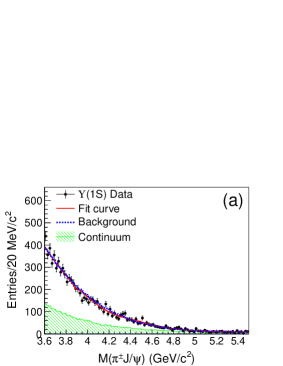
Figure 1: Invariant mass distributions of the (left column),
(middle column), and (right column) candidates in
the entire region (top row) and for bins of size (remaining rows).
The points with error bars are for the data sample;
the shaded histograms are the continuum contributions scaled from the data sample.
The solid lines are the best fit with the total fitted background components represented by the dashed lines.
The and signal regions used for the searches are indicated by the arrows in the top-row plots.
Considering the slight differences in the MC-determined
reconstruction efficiencies for different
momenta, we partition the data samples
according to the scaled momentum
PhysRevD.70.072001 ,
where the subscript represents (),
is the momentum of the candidate in the
center-of-mass system, and is the
mass ChinPhysC38.090001 . The value of
is the value of
for the case where the candidate recoils
against a massless particle. The use of removes the
beam-energy dependence in comparing the continuum
data to that taken at the resonance.
An unbinned extended simultaneous likelihood fit is applied to the
-dependent spectra to extract the signal
yields in the and continuum data samples. Due to
the slight dependence on momentum, the
signal shape is directly obtained from the MC simulation in each
bin convolved with a Gaussian function with a free width
in the fit to account for possible discrepancy between data and MC simulation.
In the fit to the candidates,
a Chebyshev polynomial background shape is used for the
decay backgrounds in addition to the normalized continuum contribution.
Particularly for the
to inclusive decays, the
and
decay modes are treated together
to obtain the total signal yield; that is to say, we
apply an additional simultaneous fit to the candidates
in the two decay modes with the fixed ratios of MC-determined
efficiencies between them
with all of the branching fractions of the intermediate states included.
The invariant mass
distributions for the and candidates for the entire region
and bins are shown in
Fig. 1
with the results of the fits to the spectra of the and
candidates in inclusive decays.
The fitted signal yields () in each bin are
tabulated in Table 1, together with the
reconstruction efficiencies () [including all intermediate-state
branching fractions], the total systematic
uncertainties (), and the
corresponding branching fractions ().
The total systematic uncertainties
are the sum of the common systematic errors (described
below) and fit errors estimated in each bin or
the full range in . The total numbers of events, i.e., the sums of the
signal yields in all of the bins, the sums of the
-dependent efficiencies weighted by the signal fraction in that
bin, and the measured branching fraction values are
also itemized in Table 1. Our measurements are consistent with the
PDG averages of previous results from
CLEO-c, but with
smaller central values and better precision.
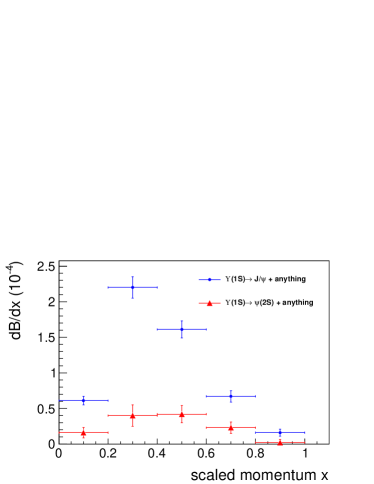
In addition, Fig. 2 shows the differential branching fractions of
inclusive decays into the
and .
Table 1: Summary of the branching fraction measurements of
inclusive decays into the ,
where is the number of fitted signal events,
is the reconstruction efficiency with all intermediate-state
branching fractions included,
is the total systematic error on the branching fraction measurement,
and is the measured branching fraction. For the channel, is the sum of the reconstruction efficiencies
in the and decay modes
with the branching fractions of the intermediate states included.
Sum
Figure 2: Differential branching fractions for inclusive decays into the
and versus the scaled momentum defined in the text. For each point,
the error is the sum of the statistical and systematic errors.
We search for signals for certain states by combining
the with one or two light charged hadrons
(). MC simulations indicate that the
mass resolutions of the candidates have a weak
dependence on the production mode, so common signal and sideband
regions are defined. In the mode, the
candidates are reconstructed in the final state. For
, and candidates in their decay
channels, the selected signal regions and the corresponding
sidebands are summarized in Table 2. All sidebands
are defined to be twice as wide as the corresponding signal
region. No peaking backgrounds or evident structures are found in these
sideband events in any of the invariant mass distributions discussed below.
To improve the mass resolutions of
candidates, vertex and mass-constrained fits are applied to the
candidates; an unconstrained-mass vertex fit is done for the candidates since
their natural width is larger than the mass resolution.
An unbinned extended simultaneous maximum likelihood fit to the mass distributions
of the candidates is performed to extract the signal and background yields in the
and continuum data samples. The signal shapes of the examined states used
in the fits are obtained directly from MC simulations that use world
average values for their masses and
widths ChinPhysC38.090001 .
In the fit to the data sample, a Chebyshev
polynomial function is used for the
decay backgrounds in addition to the normalized continuum contribution.
Table 2: The definitions of the signal regions and the corresponding sidebands
for (a) , (b) ,
(c) , and (d) .
The sidebands are selected to be twice as wide as the corresponding signal region.
Channel
Signal Region
Sidebands (GeV/)
(a)
[3.067, 3.127]
[2.970, 3.030] or [3.170, 3.230]
(b)
[3.6485, 3.7235]
[3.535, 3.610] or [3.760, 3.835]
(c)
[3.677, 3.695]
[3.652, 3.670] or [3.700, 3.718]
(d)
[1.012, 1.027]
[0.989, 1.004] or [1.036, 1.051]
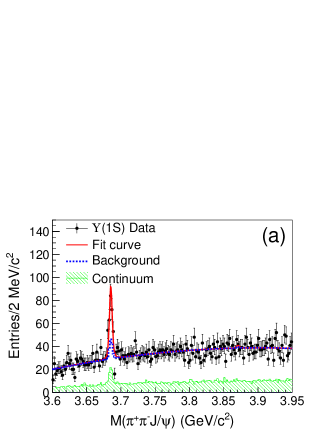
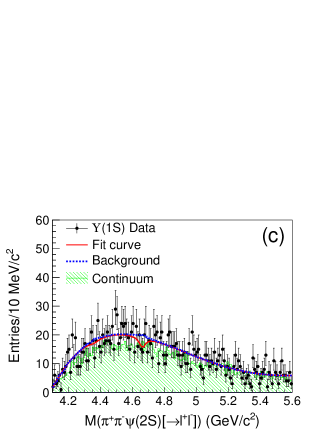
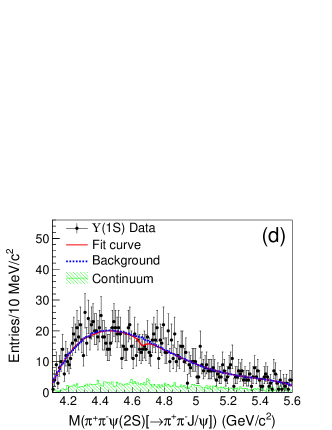
Figure 3 shows the invariant
mass distributions, relevant for the and searches,
and those for , relevant for the , and .
There are no evident signals for any of these states; the solid lines indicate
the best fit results from a simultaneous fit to the
and continuum data samples. The dashed curves are the total
background estimates.
The same representations of the curves and histograms are used for the
and mass distributions shown in
Figs. 4(a) and 5(a), respectively, and for
the charged and modes
in Figs. 6 and 7(a),
respectively.
Figure 3: The invariant mass distributions for the (a) lower- and (b)
higher-mass regions; the (c) and
(d) invariant
mass distributions.
The points with error bars are the events
and the shaded histograms are the scaled continuum contributions
determined from the data sample collected at .
The solid lines are the best fits with the total background components
represented by the dashed lines.
Because of the large difference between the and
widths ChinPhysC38.090001 , the fit range for the
spectrum is separated into low and high
mass regions with different bin widths as shown in
Figs. 3(a) and (b). The sharp peak at the
nominal mass, as seen in Fig. 3(a),
is from .
In contrast, no signal is observed.
Using the MC-determined
signal shape, the fit
yields signal events.
With the MC-determined reconstruction efficiency
(), the resulting branching fraction of
the inclusive decay into is
.
The measurement is in agreement with that listed in
Table 1, where the candidates are
reconstructed via and . In
addition, there is no evidence for signal in the
mass spectrum shown in
Fig. 3(b). We also search for the
state in the mass spectra shown in
Figs. 3(c) and 3(d) for the
and
decay modes, respectively, of the candidates, as well as the and
states. No enhancements near the nominal masses of these states are
evident.
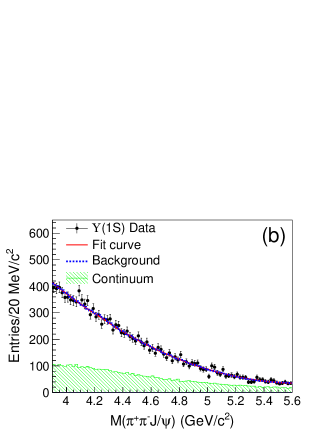
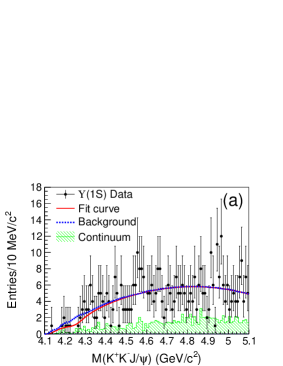
The has been seen in the channel by
CLEO-c Coan:2006rv . Figure 4(a) shows the
invariant mass distributions for the candidate
inclusive decays. The fit to the spectrum of
is performed above , which
is somewhat above the mass threshold of
.
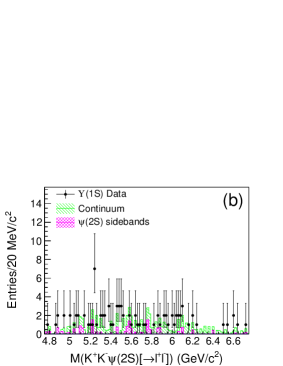
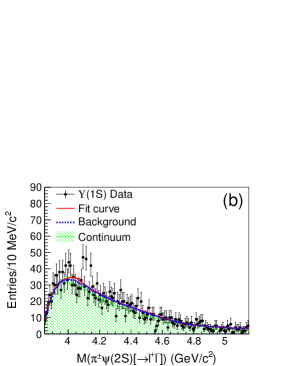
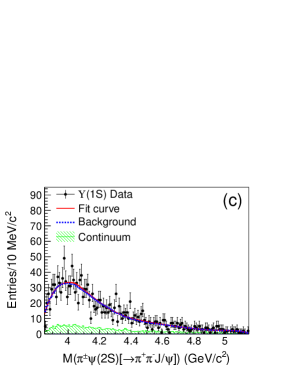
The invariant mass distributions of the
candidates in inclusive decays are
shown in Figs. 4(b) and
4(c) for and
, respectively. The slant-shaded histograms (the
scaled continuum backgrounds) overlie the cross-shaded ones that
represent the normalized mass sideband. No
evidence is found for new structures or any of the known
states. The and states have been reported in
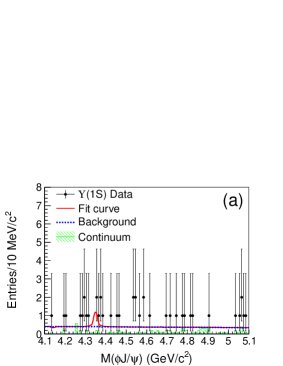
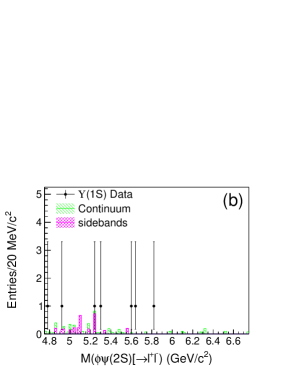
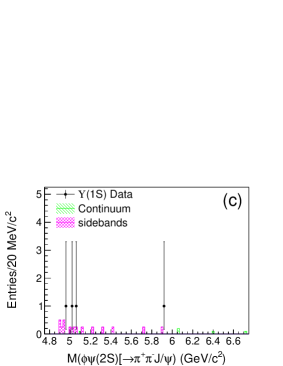
the decay channel by CDF Aaltonen:2009tz and Belle PhysRevLett.104.112004 . Figure 5 shows
the and invariant mass
distributions, where the few events that survive do not appear to
have any statistically significant clustering near 4140 MeV/,
4350 MeV/ nor any other mass. The results of a fit to
in Fig. 5(a) are shown as a solid curve.
Figures 5(b) and 5(c) show the
invariant mass distributions; there are only
and events that survive in the and
decay modes, respectively. No structures are identified.
Figure 4:
Invariant mass distributions of the (a) ,
(b) , and (c) candidates
in inclusive decays.
The points with error bars are the events
and the slant-shaded histograms are the scaled continuum
contributions with the data sample collected at
which overlie the normalized mass sideband backgrounds
(the cross-shaded histograms) for the two decay modes.
The solid line in panel (a) is the best fit with the fitted total background component represented as
a dashed line.
Figure 5: Invariant mass distributions of the (a) ,
(b) , and (c) candidates in
inclusive decays.
The points with error bars are events observed at the peak,
and the slant-shaded histograms are the scaled continuum contributions from
the continuum data sample
which overlie the normalized mass sideband backgrounds
(the cross-shaded histograms) for the two decay modes.
The solid line in panel (a) is the best fit for the mass spectrum
and the dashed line is the total fitted background.
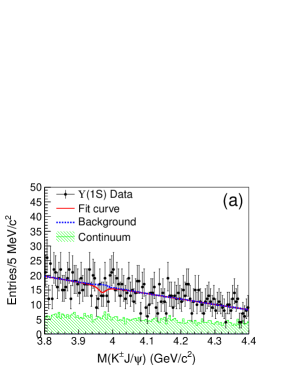
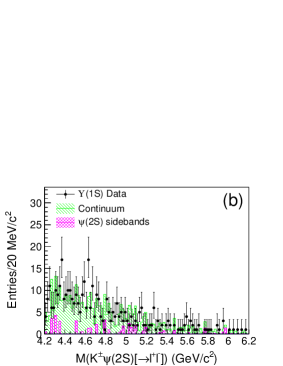
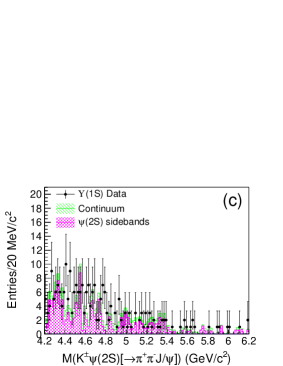
We search for various charged states decaying into . Figure 6 shows
the , ,
and invariant mass
distributions for the peak data as well as the fit
ranges and results.
For all three channels, the background events represent the
data well, indicating insignificant production of any states.
We do not observe any , or
signals in the mode nor any or signals in the mode.
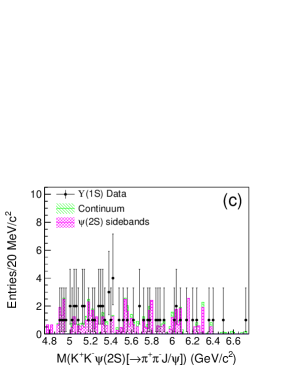
We search for the predicted
state
—the strange partner of JKPS55.424 ; PhysRevD.88.096014 —
with mass
and width
in inclusive
decays. The invariant mass distribution of the candidates is
presented in Fig. 7(a). No evidence for such a
structure is seen near the predicted mass.
The signal significance from the fit is less than
2. A fit with a Breit-Wigner that
interferes with a smooth background function
yields a signal significance of only 1.2. In the
mode, no exotic states have been seen nor predicted. For completeness, we present
the invariant mass distributions of the candidates with the
decays into the and
final states in Figs. 7(b) and
7(c), respectively. The sum of the normalized
continuum and sideband backgrounds agrees well with the
data.
Figure 6: Invariant mass distributions of the (a) ,
(b) , and (c) candidates
in inclusive decays.
The points with error bars are the events
and the shaded histograms are the scaled continuum contributions with the data sample collected at .
The solid lines are the best fits with the fitted total background components represented by the dashed lines.
Figure 7: The (a) , (b) , and
(c) mass distributions for candidate events
in the peak decay sample.
The points with error bars are the events
and the slant-shaded histograms are the scaled continuum contributions
determined from the data collected at . The
normalized mass-sideband events are shown as the cross-shaded
histograms. The solid line in panel (a) is the best fit with the fitted total background component represented
by the dashed line.
The fitted signal yields () of the states that
are considered in this analysis are presented in
Table 3. Since the statistical
significance in each case is less than , upper limits on the number of
signal events, , are determined at the
credibility level (C.L.) by solving the equation cl ,
where is the number of fitted signal events and
is the likelihood function in the fit to data.
To take into account systematic uncertainties (discussed below),
the above likelihood is convolved with a Gaussian function whose
width equals the total systematic uncertainty. The calculated
upper limits on the number of signal events () and the
branching fraction () for each state are listed in
Table 3, together with the reconstruction
efficiencies (), the systematic uncertainties
(), and the signal significances ();
the latter are calculated using
, where
and are the likelihoods of
the fits without and with a signal component, respectively.
Table 3: Summary of the upper limits on the
inclusive decays into the exotic charmoniumlike states ,
where is the number of fitted signal events,
is the upper limit on the number of signal events taking into account systematic errors,
is the reconstruction efficiency,
is the total systematic uncertainty,
is the signal significance with systematic errors included,
and is the
measured product branching fraction at the 90% C.L.
State
31.
4
.
.
.
.
.
.
.
.
.
.
.
.
.
Several sources of systematic errors are taken into account in the
branching fraction measurements. Tracking efficiency uncertainty
is estimated to be per track with high momentum and is
additive. Based on the measurements of the identification
efficiencies of lepton pairs from events and pions from a low-background sample of
events, MC simulation yields uncertainties of
for each lepton, for each pion, and for
each kaon. The trigger efficiency evaluated from
simulation is greater than with an uncertainty that is
negligibly small. The difference in the signal yields when the mass
and width of each state are varied by is used as
an estimate of the systematic error associated with mass and
width uncertainties ChinPhysC38.090001 . In the simulation
of generic decays, the unknown decay channels
are produced by the Lund fragmentation model in
PYTHIA JHEP2006.026 . By generating different sets of MC
samples with different relative probabilities to produce the
various possible () pairs in the
decays, the largest difference in the
efficiencies is found to be less than and is neglected.
The errors on the branching fractions of the intermediate states
are taken from the Particle Data Group
tables ChinPhysC38.090001 ; these are , ,
, and for , , , and , respectively; the weighted average for the two
decay modes is . By varying the background
shapes, the order of the Chebyshev polynomial and the fitting
range, the deviations of the fitted signal yields for
productions are estimated for each bin.
The upper limits on the signal yields
vary by less than 49.4%, depending
on the decay mode. The MC statistical errors are estimated using
the reconstruction efficiencies and the number of generated
events; these are or less. The error on the total number
of events is . Assuming that all sources
are independent, their uncertainties are summed in quadrature. The total
systematic errors () for each channel are
listed in Table 3.
In summary, using the events
collected with the Belle detector, distinct and
signals are observed in the inclusive
decays. The corresponding branching fractions are measured to be
and
with substantially improved precision compared to previous results of
PhysRevD.70.072001 ; PhysLettB224.445
and PhysRevD.70.072001 for and , respectively.
Several theoretical papers have suggested the study of production
in decays as an example of charmonium production
mechanisms in gluon-rich environments. Some
color-octet octet and color-singlet signlet models
predict ) of and
, respectively.
Our measured value is of the same order as the theoretical estimations.
We also search for a variety
of states in inclusive decays for the first
time, where the candidates of interest are reconstructed
from their final states that contain a and up
to two charged light hadrons (). No evident signal
is found for any of them and C.L. upper limits are set on
the product branching fractions and listed in
Table 3. There is no striking evidence for
previously unseen structures in and
invariant mass distributions.
We thank the KEKB group for the excellent operation of the
accelerator; the KEK cryogenics group for the efficient
operation of the solenoid; and the KEK computer group,
the National Institute of Informatics, and the
PNNL/EMSL computing group for valuable computing
and SINET4 network support. We acknowledge support from
the Ministry of Education, Culture, Sports, Science, and
Technology (MEXT) of Japan, the Japan Society for the
Promotion of Science (JSPS), and the Tau-Lepton Physics
Research Center of Nagoya University;
the Australian Research Council;
Austrian Science Fund under Grant No. P 22742-N16 and P 26794-N20;
the National Natural Science Foundation of China under Contracts
No. 10575109, No. 10775142, No. 10875115, No. 11175187, No. 11475187
and No. 11575017;
the Chinese Academy of Science Center for Excellence in Particle Physics;
the Ministry of Education, Youth and Sports of the Czech
Republic under Contract No. LG14034;
the Carl Zeiss Foundation, the Deutsche Forschungsgemeinschaft, the
Excellence Cluster Universe, and the VolkswagenStiftung;
the Department of Science and Technology of India;
the Istituto Nazionale di Fisica Nucleare of Italy;
the WCU program of the Ministry of Education, National Research Foundation (NRF)
of Korea Grants No. 2011-0029457, No. 2012-0008143,
No. 2012R1A1A2008330, No. 2013R1A1A3007772, No. 2014R1A2A2A01005286,
No. 2014R1A2A2A01002734, No. 2015R1A2A2A01003280 , No. 2015H1A2A1033649;
the Basic Research Lab program under NRF Grant No. KRF-2011-0020333,
Center for Korean J-PARC Users, No. NRF-2013K1A3A7A06056592;
the Brain Korea 21-Plus program and Radiation Science Research Institute;
the Polish Ministry of Science and Higher Education and
the National Science Center;
the Ministry of Education and Science of the Russian Federation and
the Russian Foundation for Basic Research;
the Slovenian Research Agency;
Ikerbasque, Basque Foundation for Science and
the Euskal Herriko Unibertsitatea (UPV/EHU) under program UFI 11/55 (Spain);
the Swiss National Science Foundation;
the Ministry of Education and the Ministry of Science and Technology of Taiwan;
and the U.S. Department of Energy and the National Science Foundation.
This work is supported by a Grant-in-Aid from MEXT for
Science Research in a Priority Area (“New Development of
Flavor Physics”) and from JSPS for Creative Scientific
Research (“Evolution of Tau-lepton Physics”).
References
(1) N. Brambilla et al., Eur. Phys. J. C 71, 1534 (2011).
(2) S. Godfrey and S. L. Olsen, Annu. Rev. Nucl. Part. Sci. 58, 51 (2008).
(3) N. Brambilla et al., Eur. Phys. J. C 74, 2981 (2014).
(4) C. Z. Yuan, Int. J. Mod. Phys. A 29, 1430046 (2014).
(5) C. P. Shen et al. (Belle Collaboration), Phys. Rev. D 82, 051504(R) (2010).
(6) X. L. Wang et al. (Belle Collaboration), Phys. Rev. D 87, 071107(R) (2011).
(7) R. A. Briere et al. (CLEO Collaboration), Phys. Rev. D 70, 072001 (2004).
(8) R. Fulton et al. (CLEO Collaboration), Phys. Lett. B 224, 445 (1989).
(9) S. K. Choi et al. (Belle Collaboration), Phys. Rev. Lett. 91, 262001 (2003).
(10) B. Aubert et al. (BABAR Collaboration), Phys. Rev. Lett. 95, 142001 (2005).
(11) X. L. Wang et al. (Belle Collaboration), Phys. Rev. D 91, 112007 (2015).
(12) B. Aubert et al. (BABAR Collaboration), Phys. Rev. Lett. 98, 212001 (2007).
(13) X. L. Wang et al. (Belle Collaboration), Phys. Rev. Lett. 99, 142002 (2007).
(14) T. E. Coan et al. (CLEO Collaboration), Phys. Rev. Lett. 96, 162003 (2006).
(15) T. Aaltonen et al. (CDF Collaboration), Phys. Rev. Lett. 102, 242002 (2009).
(16) C. P. Shen et al. (Belle Collaboration), Phys. Rev. Lett. 104, 112004 (2010).
(17) M. Ablikim et al. (BESIII Collaboration), Phys. Rev. Lett. 110, 252001 (2013).
(18) Z. Q. Liu et al. (Belle Collaboration), Phys. Rev. Lett. 110, 252002 (2013).
(19) K. Chilikin et al. (Belle Collaboration), Phys. Rev. D 90, 112009 (2014).
(20) S. K. Choi et al. (Belle Collaboration), Phys. Rev. Lett. 100, 142001 (2008).
(21) S. H. Lee, M. Nielsen and U. Wiedner, J. Korean Phys. Soc. 55, 424 (2009).
(22) J. M. Dias, X. Liu and M. Nielsen, Phys. Rev. D 88, 096014 (2013).
(23) A. Abashian et al. (Belle Collaboration),
Nucl. Instr. and Methods Phys. Res. Sect. A 479, 117 (2002).
(24) J. Brodzicka et al., Prog. Theor. Exp. Phys. (2012) 04D001.
(25) S. Kurokawa and E. Kikutani, Nucl. Instr. and Methods Phys. Res. Sect. A 499, 1 (2003), and other papers
included in this volume.
(26) T. Abe et al., Prog. Theor. Exp. Phys. (2013) 03A001
and following articles up to 03A011.
(27) D. J. Lange, Nucl. Instr. and Methods Phys. Res. Sect. A 462, 152 (2001).
(28) K. A. Olive et al., Chin. Phys. C 38, 090001 (2014).
(29) T. Sjostrand, S. Mrenna and P. Skands, J. High Energy Phys. 05, 026 (2006).
(30) K. Abe et al. (Belle Collaboration), Phys. Rev. D 70, 071102 (2004).
(31) E. Nakano, Nucl. Instr. and Methods Phys. Res. Sect. A 494, 402 (2002).
(32) A. Abashian et al., Nucl. Instr. and Methods Phys. Res. Sect. A 491, 69 (2002).
(33) K. Hanagaki et al., Nucl. Instr. and Methods Phys. Res. Sect. A 485, 490 (2002).
(34) K. Y. Liu, Z. G. He and K. T. Chao, Phys. Rev. D 69, 094027 (2004).
(35) F. Yuan, C. F. Qiao and K. T. Chao, Phys. Rev. D 56, 321 (1997).
(36) K. T. Chao, Z. G. He, D. Li and C. Meng, arXiv:hep-hp/1310.8597; C. Meng (private communication).
(37) In common high energy physics usage, this
Bayesian interval has been reported as “confidence interval,” which
is a frequentist-statistics term.
(38) M. Napsuciale, Phys. Rev. D 57, 5711 (1998).
(39) S. Y. Li, Q. B. Xie and Q. Wang, Phys. Lett. B 482, 65 (2000).