Measurement of the Black Hole Mass in NGC 1332 from
ALMA
Observations at 0.044 Arcsecond Resolution
Abstract
We present Atacama Large Millimeter/submillimeter Array (ALMA) Cycle 3 observations of CO(2–1) emission from the circumnuclear disk in the E/S0 galaxy NGC 1332 at 0044 resolution. The disk exhibits regular rotational kinematics and central high-velocity emission ( km s-1) consistent with the presence of a compact central mass. We construct models for a thin, dynamically cold disk in the gravitational potential of the host galaxy and black hole, and fit the beam-smeared model line profiles directly to the ALMA data cube. Model fits successfully reproduce the disk kinematics out to pc. Fitting models just to spatial pixels within projected pc of the nucleus (two times larger than the black hole’s gravitational radius of influence), we find . This observation demonstrates ALMA’s powerful capability to determine the masses of supermassive black holes by resolving gas kinematics on small angular scales in galaxy nuclei.
Subject headings:
galaxies: nuclei — galaxies: bulges — galaxies: individual (NGC 1332) — galaxies: kinematics and dynamics1. Introduction
The Atacama Large Millimeter/submillimeter Array (ALMA) has a revolutionary capability to resolve cold molecular gas kinematics on angular scales well below 1″. This opens the possibility of using cold molecular gas disks as dynamical tracers to measure the masses of supermassive black holes (BHs) in galaxy centers (Davis et al., 2013b; Onishi et al., 2015). Accurate measurement of a BH mass () generally requires observations that resolve kinematics within the BH’s gravitational radius of influence , the radius within which the BH dominates the gravitational potential, and ALMA is the first mm/sub-mm interferometer having the capability to resolve in large numbers of galaxies.
NGC 1332 is a nearby S0 or E galaxy that contains a highly inclined circumnuclear dust disk. Its BH mass has been measured previously via stellar dynamics (Rusli et al., 2011) and by modeling the hydrostatic equilibrium of its X-ray emitting halo (Humphrey et al., 2009), making it an excellent laboratory for direct comparison of independent measurement techniques. In Paper I (Barth et al., 2016), we described 03-resolution Cycle 2 ALMA observations designed to test for the presence of CO emission from within . The data showed very clean disklike rotation with a slight warp, and central emission extending to km s-1. Our simplest dynamical model fits converged on , but beam smearing in the highly inclined disk caused a severe degeneracy between rotation and turbulent motion at small radii, precluding the derivation of stringent confidence limits on . Here, we present new ALMA Cycle 3 observations at 0044 resolution and dynamical modeling of the data. We adopt a distance of 22.3 Mpc to NGC 1332 for consistency with Paper I and with Rusli et al. (2011); at this distance, 1″ corresponds to 108.6 pc.
2. Observations
NGC 1332 was observed in ALMA Band 6 as part of project 2015.1.00896.S. Three separate observations on 2015 September 16 and 23 were carried out, for a total on-source integration time of 101 min. The observations were obtained in a frequency band centered at 229.354 GHz, corresponding to the redshifted 12CO(2–1) line in NGC 1332. We processed the data using the Common Astronomy Software Applications (CASA; McMullin et al., 2007) package to produce an emission-line data cube with pixels, a field of view of , and 75 frequency channels with a channel spacing of 15.4 MHz, corresponding to a velocity width of 20.1 km s-1 per channel for the CO(2–1) line. The synthesized beam has major and minor axis FWHM sizes of 0052 and 0037 with major axis position angle (PA) 64°, giving a geometric mean resolution of 0044.
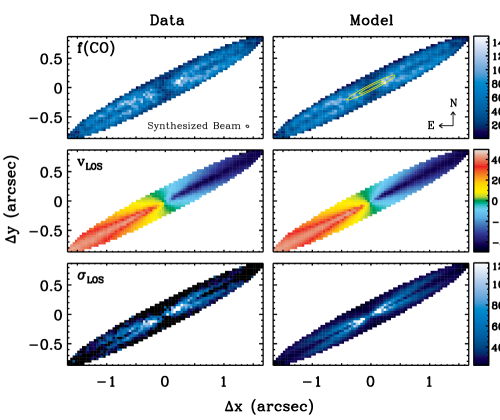
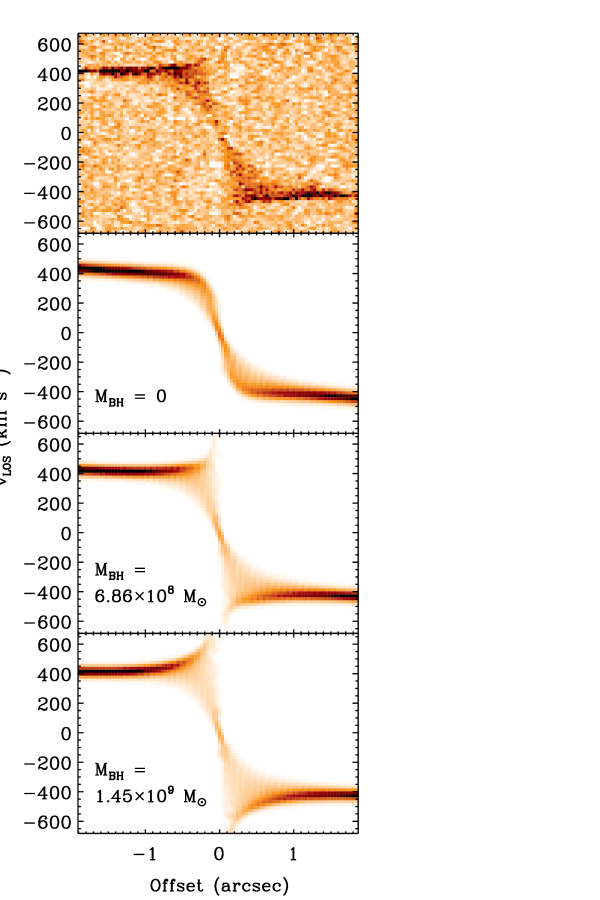
We created kinematic maps by fitting Gaussian line profiles to the data. In order to increase the S/N of the profile fits, we first binned the data cube spatially by block averaging in pixel blocks, producing 004 pixels. The CO intensity, line-of-sight mean velocity (), and width () are shown in Figure 1. The disk kinematics are illustrated over an elliptical region with major and minor axes of 37 and 05, corresponding to the largest region over which we were able to obtain successful profile fits at each binned pixel. At the 004 binned pixel scale, the rms noise level is 0.142 mJy beam -1 per channel, and the the median S/N per 004 spatial pixel is 7.2 over this elliptical region. The map illustrates remarkably regular disklike rotation, with subtle signs of the mild kinematic twist or warp we found in the Cycle 2 data. In the map, the “X” shaped feature is characteristic of rotational broadening in an inclined disk. The major axis position-velocity diagram (PVD) exhibits a central velocity upturn to km s-1 (Figure 2), similar to that seen in the Cycle 2 data.
3. Dynamical Modeling
Our dynamical modeling follows the methods described in Paper I. We model a thin disk in circular rotation in a gravitational potential containing a central point mass and an extended mass distribution from stars. The enclosed stellar mass is based on a deprojected luminosity profile multiplied by a mass-to-light ratio . We neglect the contributions of dark matter and of molecular gas, both of which are within pc; in contrast, (Paper I). Models are computed on a spatial grid with 001 pixels. At each grid element, we determine the line-of-sight component of the disk’s rotation velocity (relative to the systemic velocity ), observed at inclination and major axis position angle . The emission line at each grid point is assumed to have a Gaussian velocity profile, with turbulent velocity dispersion .
This procedure produces a simulated cube with the same velocity channel spacing as the data cube. The total line flux at each spatial element is scaled to match a CO surface brightness map measured from the ALMA data. Then, each velocity channel image in the model is convolved with the ALMA synthesized beam, and the model is rebinned to match the 004 spatial scale of the binned ALMA data cube. The goodness of fit (quantified by ) is computed by direct comparison of the model cube with the binned ALMA data. Calculating at a spatial scale of approximately one pixel per synthesized beam substantially mitigates the problem of spatially correlated noise in the data, which would be a significant issue if were computed for 001 pixels (see Paper I). Free parameters include , , , , , , the dynamical center position , and an overall normalization factor applied to the CO surface brightness model. We assume a uniform value of over the disk surface and discuss this assumption in §4.3. We optimize the model fits using the amoeba downhill simplex method in IDL.
To model , we use the deprojected stellar luminosity profile from Rusli et al. (2011), based on a combination of -band VLT adaptive-optics data at small radii () and -band imaging at larger radii. Their best-fitting stellar-dynamical model implies an -band mass-to-light ratio of (J. Thomas, private communication). Rusli et al. (2011) give full details of the measurement, and Paper I presents a plot of .
4. Modeling Results
4.1. Fits to the full disk
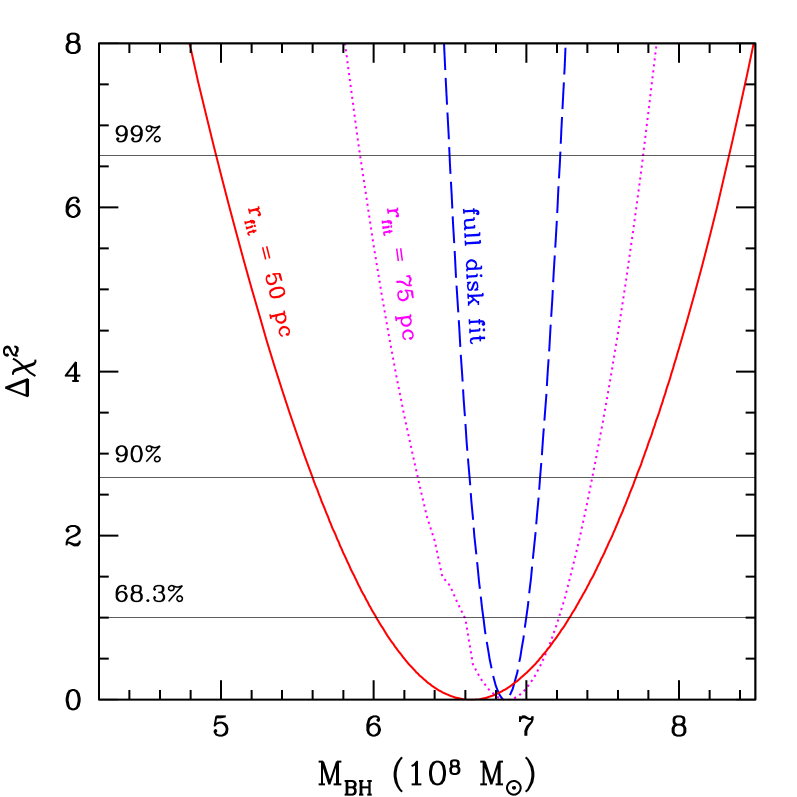
We first describe models fitted to the entire disk, over the elliptical region illustrated in Figure 1. This region contains 840 binned (004) spatial pixels. We compute over 56 frequency channels, for a total of 47040 data points. With all model parameters free, the best fit is found at , with or . Other parameters for the best-fitting model are , , , and km s-1; these are similar to the best-fitting values found in Paper I. Figure 3 shows as a function of . The 68.3% confidence region (corresponding to ) is . Kinematic maps measured from the best-fitting model (Figure 1) match the structure in the data closely. While the model is generally successful at reproducing the disk kinematics, a result of for 47032 degrees of freedom is formally unacceptable. We attribute this to systematic inadequacies of the model, such as neglect of the disk’s slight warp, the assumption of a spatially constant value of , and noise in the CO surface brightness model.
The apparently high precision of this result is typical of gas-dynamical models fitted to a large number of pixels (Gould, 2013). However, the model-fitting (statistical) uncertainties only represent a portion of the true error budget for the full-disk fits. In this case, the major source of systematic uncertainty is likely to be the stellar mass profile. Pixels at in the ALMA data dominate the full-disk fit, leading to very tight constraints on and consequently on as well. If the assumed stellar mass profile shape is systematically wrong, model fits will force to an incorrect (but ostensibly precise) value.
4.2. Fits to smaller regions
The stellar mass profile can be incorporated into the error budget on if the uncertainty in its shape can be parameterized, with addition of one or more free parameters to the model. Potential sources of error in the mass profile shape include errors due to dust extinction, errors in deprojection from two to three dimensions, and gradients due to stellar population age and/or metallicity variations (McConnell et al., 2013). Properly accounting for this range of uncertainties over the entire radial range of the disk would be challenging.
The alternative and simpler approach is to fit models over only spatial pixels close to and within , so that the BH accounts for a larger fraction of the total enclosed mass. This makes the model-fitting results less susceptible to errors due to the shape of the stellar mass profile, and will appropriately broaden the confidence range on since will be less tightly constrained. Fits to smaller regions can also mitigate systematic mismatch of flat-disk models to the disk’s slightly warped structure. Our goal is to fit models over the smallest possible spatial region that permits successful fits with well-defined confidence limits on (manifested by a smooth and regular curve of vs. ).
We fit models to progressively smaller regions centered on the nucleus and bounded by ellipses with semimajor and semiminor axis lengths of and , for varying values of (where the full disk corresponds to pc). The curve of vs. begins to show asymmetric structure for pc (Figure 3), becoming increasingly irregular and jagged for pc due to the small number of pixels and relatively low S/N in the fitting region. The irregular structure in the curve is primarily the result of small fluctuations in the best-fitting values of , , and for different fixed values of . From the best-fitting model with pc, we take the values of these three parameters and hold them fixed, calculating a grid of models with pc for a range of values of with the remaining five parameters free.
These constrained fits for pc (containing 45 spatial pixels) have 2515 degrees of freedom, and the best-fitting model has and . The expected range on for 2515 degrees of freedom is , so this result suggests that there is still a mild degree of systematic model-data mismatch within pc. The 68.3% and 99% confidence ranges on are and , respectively. Other parameters of the best-fitting model are (giving within pc), , , and km s-1; the fixed value of is 1562.2 km s-1. The error budget does not incorporate uncertainty in the distance to NGC 1332; the derived scales linearly with the assumed distance. The fits rule out at confidence ( relative to the best-fitting ). We interpret the systematic changes in and for smaller fitting regions as indications of the disk’s warp; these angles vary by only from pc down to pc or smaller regions. This model implies pc or 023, determined as the radius within which . Along the disk’s minor axis, this projects to .
For pc, the curve again becomes irregular and asymmetric, even with , , and held fixed. Achieving stable fits for pc is possible if the values of , , , and/or are fixed, but we choose pc for our final results since it is the smallest region over which we can obtain successful fits with all of these parameters free, and because increases slightly for values of smaller than 50 pc.
4.3. Turbulent velocity dispersion
In Paper I, we carried out fits using a spatially uniform , and also ran models allowing for a central rise in . The models allowing more flexibility in strongly preferred the presence of a steep increase in at small radius, reaching high (and likely unphysical) values of up to 270 km s-1 while driving to zero. The fundamental problem was that the extreme beam smearing due to the disk’s high inclination produced very broad line profiles near the disk center, and the model fits were unable to distinguish between rapid rotation and turbulent broadening at small radii.
The Cycle 3 data are much less susceptible to this particular degeneracy, but with the minor-axis kinematics are still unresolved by a factor of two, leading to significant beam smearing of line profiles at small . This blurring is evident in the PVD as the “fan” of emission across a broad velocity range at small radii (Figure 2), and as the “X”-shaped rise in the map (Figure 1). This velocity structure is well matched by our models with uniform (and low) values of ; a high central is not required in order to match the central increase in the observed .
In our best-fit model with pc, for which km s-1, the maximum value of is 0.073, small enough to justify our treatment of the disk as dynamically cold and geometrically thin. The pc model suggests a modest central increase in relative to the outer disk, where our full-disk fit found km s-1. We carried out trial fits to smaller regions of or 30 pc and found that never exceeded 40 km s-1 for best-fitting models over any fitting region. This demonstrates that the Cycle 3 data do not require or prefer a high central .
5. Discussion and Conclusions
This work presents the first BH mass derived from ALMA observations that resolve the BH’s gravitational radius of influence, demonstrating ALMA’s powerful capability to improve our understanding of local BH demographics. The primary challenges for gas-dynamical measurements of BH masses are identifying disks that exhibit suitably clean rotation, and obtaining observations of sufficient angular resolution and S/N to map the kinematics on the required scales. While a great deal of effort has been invested in measurement of ionized gas kinematics, primarily with Hubble Space Telescope spectroscopic observations, the cold molecular gas in circumnuclear disks is known to be less turbulent than the ionized component, making molecular kinematics a more accurate tracer of a galaxy’s gravitational potential than optical emission-line kinematics (Young et al., 2008; Davis et al., 2013a). Resolving in CO observations of nearby galaxies was at the limiting edge of the capabilities of earlier mm-wave interferometers (Davis et al., 2013b), but ALMA will be able to carry out such observations for a large number of galaxies.
In Paper I we stressed the importance of resolving angular scales corresponding to (the BH radius of influence projected along the disk’s minor axis) in order to fully resolve disk kinematics within the BH’s sphere of influence. This Cycle 3 observation of NGC 1332 fully resolves , but is unresolved by a factor of two. Thus, the observed kinematics are still blurred by beam smearing in the minor-axis direction, as seen in the map and the PVD, but this effect is far less severe than in our Cycle 2 observation. Higher resolution observations would be required in order to determine the disk’s central profile accurately and reduce the remaining degeneracy between rotation and turbulence in the inner disk. This would permit even tighter constraints on and provide unique information on the physical properties of molecular gas deep within the gravitational potential well of a supermassive BH.
The ideal situation for a gas-dynamical BH mass measurement is achieved when observations have sufficiently high S/N and angular resolution that can be well constrained by models fitted only to points within , so that stellar mass represents a small contribution to the total enclosed mass and systematic uncertainties in the stellar mass profile have a negligible impact on the measurement. This has previously been accomplished for a few objects using ionized gas kinematics (e.g, M87; Macchetto et al., 1997; Walsh et al., 2013) as well as for H2O maser disk galaxies such as NGC 4258 (Miyoshi et al., 1995; Kuo et al., 2011). ALMA is certainly capable of achieving this goal for observations of CO or other molecular tracers. With an optimal combination of high angular resolution and S/N, ALMA observations of other targets could in principle provide BH mass precision at the level of a few percent in future measurements. All else being equal, the most precise BH masses will be determined from observations of disks at intermediate inclination angles satisfying the competing requirements that is resolved and is large enough to permit accurate kinematic mapping. NGC 1332 is a challenging target in that the high disk inclination requires observations at very high angular resolution. At high resolution the S/N per spatial pixel is low, and for this measurement, S/N is the primary limiting factor for determining . Significant improvement in S/N would require a very large investment of ALMA time, however, far more than the hours (including calibrations and overhead time) used for this observation.
The CO kinematics are highly inconsistent with a central mass as high as , the value found by Rusli et al. (2011) based on stellar-dynamical modeling of VLT adaptive-optics spectroscopic data. For our constrained fits with pc, we find at , and for . This disagreement is particularly stark in that we are using the same stellar luminosity profile measured by Rusli et al. (2011) in our dynamical models, and our fits find a stellar mass-to-light ratio very similar to their best-fit value. It would be worthwhile to revisit the stellar-dynamical models for NGC 1332 to determine whether this disagreement can be resolved.
Our best-fitting BH mass is consistent with the value (90% confidence) found by Humphrey et al. (2009) from modeling the hydrostatic equilibrium of the diffuse X-ray emitting hot gas halo of NGC 1332. This agreement provides new motivation to explore the hydrostatic equilibrium method as a promising approach for measurement of the central mass profiles in elliptical galaxies and to carry out additional direct comparisons with other mass measurement techniques.
The scatter in the correlation at low redshift provides a fossil record of the cosmic history of BH evolution through accretion and mergers (Robertson et al., 2006; Peng, 2007). Determination of this scatter requires a large sample of measurements with reliable measurement uncertainties. The factor of two disagreement between our gas-dynamical value and the stellar-dynamical result from Rusli et al. (2011) serves as an important cautionary note regarding the measurement and interpretation of the scatter in the relation, which is primarily determined from stellar-dynamical measurements (Gültekin et al., 2009; McConnell & Ma, 2013; Kormendy & Ho, 2013). Our results suggest that much more effort will be required in order to arrive at a definitive empirical understanding of the scatter in the local BH-bulge correlations. ALMA is poised to make a major contribution to our understanding of local BH demographics, if significant numbers of cleanly rotating molecular disks similar to the NGC 1332 disk can be identified.
References
- Barth et al. (2016) Barth, A. J., Darling, J., Baker, A. J., Boizelle, B. D., Buote, D. A., Ho, L. C., & Walsh, J. L. 2016, ApJ, in press (arXiv:1603.04523).
- Davis et al. (2013a) Davis, T. A., Alatalo, K., Bureau, M., et al. 2013a, MNRAS, 429, 534
- Davis et al. (2013b) Davis, T. A., Bureau, M., Cappellari, M., Sarzi, M., & Blitz, L. 2013b, Nature, 494, 328
- Gould (2013) Gould, A. 2013, arXiv:1303.0834
- Gültekin et al. (2009) Gültekin, K., Richstone, D. O., Gebhardt, K., et al. 2009, ApJ, 698, 198
- Humphrey et al. (2009) Humphrey, P. J., Buote, D. A., Brighenti, F., Gebhardt, K., & Mathews, W. G. 2009, ApJ, 703, 1257
- Kormendy & Ho (2013) Kormendy, J., & Ho, L. C. 2013, ARA&A, 51, 511
- Kuo et al. (2011) Kuo, C. Y., Braatz, J. A., Condon, J. J., et al. 2011, ApJ, 727, 20
- Macchetto et al. (1997) Macchetto, F., Marconi, A., Axon, D. J., et al. 1997, ApJ, 489, 579
- McConnell et al. (2013) McConnell, N. J., Chen, S.-F. S., Ma, C.-P., et al. 2013, ApJ, 768, L21
- McConnell & Ma (2013) McConnell, N. J., & Ma, C.-P. 2013, ApJ, 764, 184
- McMullin et al. (2007) McMullin, J. P., Waters, B., Schiebel, D., Young, W., & Golap, K. 2007, Astronomical Data Analysis Software and Systems XVI, 376, 127
- Miyoshi et al. (1995) Miyoshi, M., Moran, J., Herrnstein, J., et al. 1995, Nature, 373, 127
- Onishi et al. (2015) Onishi, K., Iguchi, S., Sheth, K., & Kohno, K. 2015, ApJ, 806, 39
- Peng (2007) Peng, C. Y. 2007, ApJ, 671, 1098
- Robertson et al. (2006) Robertson, B., Hernquist, L., Cox, T. J., et al. 2006, ApJ, 641, 90
- Rusli et al. (2011) Rusli, S. P., Thomas, J., Erwin, P., et al. 2011, MNRAS, 410, 1223
- Walsh et al. (2013) Walsh, J. L., Barth, A. J., Ho, L. C., & Sarzi, M. 2013, ApJ, 770, 86
- Young et al. (2008) Young, L. M., Bureau, M., & Cappellari, M. 2008, ApJ, 676, 317-334