Fermi Reveals New Light on Novae in Gamma rays
Abstract:
Novae are now firmly established as a high-energy (100 MeV) -ray source class by the Fermi Large Area Telescope (LAT). In symbiotic binary systems such as V407 Cyg 2010, there is a firm theoretical framework for the production of shock-accelerated particles in the nova ejecta from interactions with the dense wind of the red giant companion. Yet, the high-energy -ray emission detected in classical novae involving less evolved stellar companions cannot be explained in the same way and could instead be produced in internal shocks in the ejecta. We summarize the Fermi-LAT -ray observations of novae, highlighting the main properties that will guide further studies. Additionally, we report on the soft -ray ( MeV) continuum detection of the oxygen-neon type classical nova V382 Vel 1999 with the OSSE detector aboard the Compton Gamma Ray Observatory in light of its Fermi-era analog, V959 Mon 2012.
1 Fermi LAT Gamma-ray Novae Discoveries
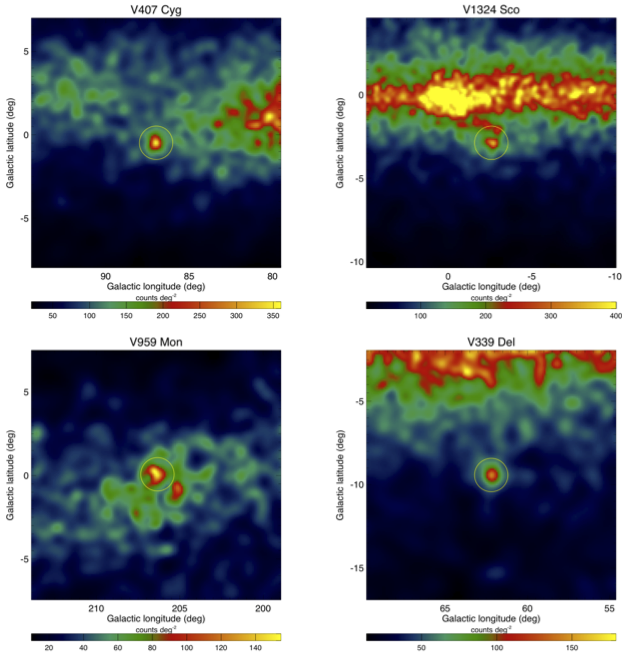
Novae were not among the wide array of high-energy -ray (100 MeV) source types considered prior to the launch of the Fermi Large Area Telescope (LAT) [3]. That changed when the symbiotic-like recurrent nova V407 Cyg 2010 explosion was discovered optically and identified with an independently detected Fermi-LAT transient source [28, 1, 6]. In retrospect, the idea that such symbiotic systems can be high-energy -ray emitters could have been anticipated as a product of shock-accelerated particles in the nova ejecta through interactions with the dense wind of the red giant companion as considered for RS Oph [39]. However, the later LAT detections of three classical novae (CNe) were truly unexpected [2] (see Figure 1) because they were produced in compact binary systems composed of a white dwarf and main sequence companion. The detected CNe also had different optical/ultraviolet properties, with V959 Mon identified as an explosion from an oxygen-neon (ONe) nova, and V1324 Sco and V339 Del appear to be carbon-oxygen (CO) novae.
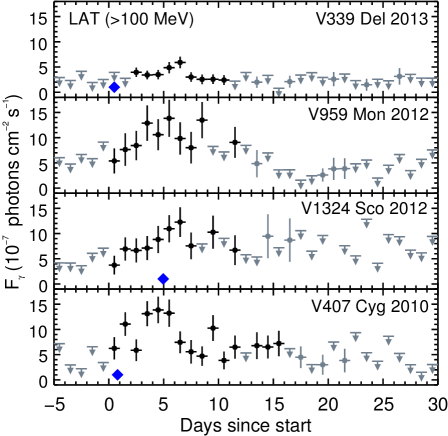
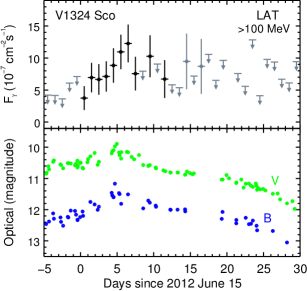
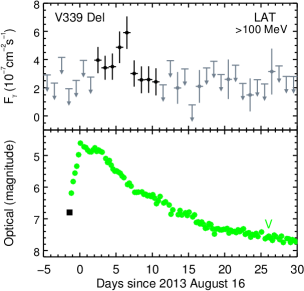
Despite the compositional differences, the -ray light curves for the ensemble four systems appear similar, being brighter initially with most of the emission observed within weeks, and total detected durations of days (Figure 2) [2]. Because V959 Mon was discovered first by Fermi-LAT as a -ray transient in the Galactic plane [8], then identified as a nova months later following its optical discovery [18, 9, 7], a comparison of the optical and -ray light curves is not possible. For the other three systems (Figure 3; see [1] for V407 Cyg), the -ray peaks lagged the optical peaks (by up to 6 days in the case of V339 Del), with the first significant LAT detection occurring before (V1324 Sco), after (V339 Del111But note a detection on the day of the optical peak in a LAT 0.5 day binned light curve [2].) and on the same day (V407 Cyg) of the observed optical peak. V1324 Sco was unusual in that its optical activity began about 1-month prior to its first LAT detection on 15 June, having displayed an increase of 6 mag between June after an initial discovery of an enhanced optical flux in mid-May [40, 27].
The observed 100 MeV spectra of the four novae are also similar, with broad spectral peaks that cutoff at energies GeV and emission observed up to GeV (the highest energy extension was observed in V1324 Sco). Spectral fits with hadronic and leptonic models were indistinguishable (e.g., Figure 4 [left]). The available distance estimates to the novae of kpc indicate they are nearby, and the resultant range of 100 MeV luminosities and total emitted energies spanned a small range of ergs s-1 and ergs, respectively, with larger values for V1324 Sco. The V339 Del distance of 4.2 kpc in [2] was confirmed [32] and the 2.7 kpc distance for V407 Cyg is unchanged. For V959 Mon (distance of 3.6 kpc; [36]), adopting smaller inferred distances of to 2.2 kpc [26, 24] would translate to a -ray luminosity to smaller. As cautioned for V1324 Sco (see SOM of [2]), the adopted 4.5 kpc distance [20] could be underestimated due to dust and has a likely range of kpc, consistent with independent estimates [27, 17] so its luminosity value could be even higher. To what extent the -ray parameters (luminosities, spectra, and durations) of the LAT-detected novae are similar is not yet understood, but this can assuredly be addressed with future observations (§ 4).
2 Compton OSSE Continuum Detection of V382 Vel 1999
The Fermi-LAT 100 MeV classical novae detections motivated us to revisit previous observations of other novae from the Compton Gamma Ray Observatory (CGRO). In the case of the bright classical nova V382 Velorum 1999 (V382 Vel), that peaked at 2.5 mag about one-day after it was discovered May 22.4 UT [41], Oriented Scintillation Spectrometer Experiment (OSSE) [22] observations were obtained over 26 days beginning May 27. The primary objective was to search for nuclear line emission, which was not detected ([23]; see [19] for the flux limits for the lines at 0.478 MeV from 7Be and 1.275 MeV from 22Na). Instead, [23] found a continuum signal over the MeV energy range in the first 12 days of the OSSE observations (CGRO Viewing Period, VP 817.5), that could not at the time be unambiguously associated with the nova because of OSSE’s large field of view (). There was no significant detection in the subsequent 14-day observation interval (VP 819.5) that began June 8.
With the benefit of hindsight, these Compton-OSSE continuum observations of V382 Vel are not surprising considering it is an analogue of the Fermi-LAT detected ONe-type nova V959 Mon [36, 9]. Specifically, the OSSE soft -ray detection within the first weeks after its optical peak and its null-detection in the weeks that followed, is similar to the 100 MeV light curves of the Fermi-LAT detected novae (Figure 2), strongly suggesting the positive detection is not a result of source confusion.
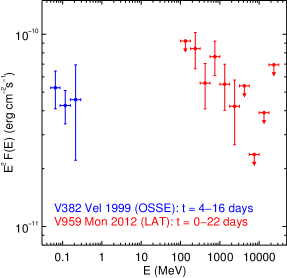
The OSSE MeV spectrum from VP 817.5 (encompassing the interval days after optical peak) that we can now associate with V382 Vel (no significant detection was obtained from MeV) is compared to the average Fermi-LAT 100 MeV spectrum of V959 Mon 2012 up to 22-days after its first significant 1-day LAT detection (Figure 4 [right]). Because these novae are similarly distant ( kpc for V382 Vel, [16, 35]; see § 1 for V959 Mon), this can be considered an early time composite spectrum of an ONe-type nova. Interestingly, a single BeppoSAX observation of V382 Vel obtained 15 days after optical maximum resulted in a keV detection and keV upper limit () erg cm-2 s-1 attributable to a keV plasma [29]. It is difficult to gauge how the BeppoSAX data connect to the OSSE spectrum because it probed a single epoch coinciding with the end of the Compton VP (perhaps suggesting fading of the 0.1 MeV emission), but such early X-ray observations can similarly probe internal shocked emission in the nova ejecta (see [25]).

3 New Fermi LAT Gamma-ray Novae Detections
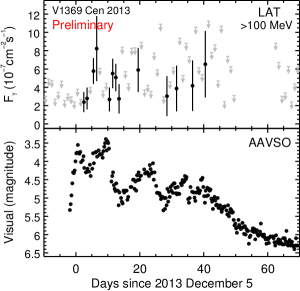
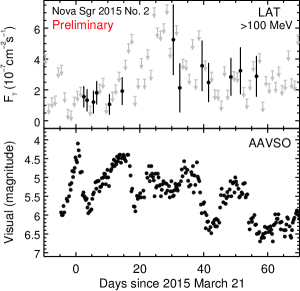
Since the first four -ray novae discoveries (§ 1), significant LAT detections of two more followed, V1369 Cen 2013 [10, 11] and Nova Sgr 2015 No. 2 [13, 14], as a result of Fermi target-of-opportunity (ToO) observations prompted by their optical discoveries [33, 34]. Both reach naked-eye brightness optically, but in contrast to the previous -ray detected novae, several subsequent optical peaks were observed up to months after their first optical peaks. The first significant 1-day -ray detections began days after the first optical peaks, similar to that reported in V339 Del. The distances to these two novae are not yet known, but they are fainter in -rays on average than the previous LAT-detected novae, and are characterized by more sporadic low-significance 1-day detections extended over moderately longer durations (up to months), broadly mimicking the multi-peaked optical activity (Figure 5).
4 Future Perspectives
The -ray detections of V407 Cyg 2010 and the two CNe in 2012 resulted naturally from Fermi-LAT’s all-sky -ray monitoring. They paved the way for the secure detections of fainter -ray fluxes from three naked-eye novae enabled by Fermi ToO observations following their optical discoveries by the amateur community. The detection rate of -ray novae is 1 yr-1 over the first 7 yrs of the Fermi mission, consistent with the rate of Galactic novae at kpc distances, suggesting all novae are potential -ray sources [2]. The more recent detections may be revealing a wider diversity in -ray properties, being fainter and seemingly characterized by longer total durations. Further serendipitous and targeted -ray detections through the continued Fermi mission, as well as studies of non-LAT detected novae (e.g., [7]) could reveal the true range of -ray properties. Coordinated -ray and multi-wavelength observations can test scenarios for how and where the putative shocks are generated (e.g., internal shocks or strong turbulence driven in the ejecta [2], or in wind-wind interactions [15]) and point to the underlying -ray emission mechanism.
Fermi-LAT observations of the recurrent nova V745 Sco 2014 [37] indicated low significance, -ray emission on February 6 and 7, coincident with its optical outburst detected on February 6.694 [12], suggesting a connection between these events. Though not definitive, the short -ray duration would imply a‘fast’ analogue of V407 Cyg [4], with the () larger distance of V745 Sco helping to explain the fainter -ray peak flux observed. Such systems demonstrate the important role of the companions in the -ray production that has yet been fully explored in CNe. Of the known recurrent novae, one can anticipate future outbursts [31] with the immediate ones to watch being perhaps V3890 Sgr (expected in 2015 with some great uncertainty) and U Sco ( years, again during the Fermi-era after its 2010 eruption).
In light of the Fermi-LAT discovery that classical novae can be bright continuum emitters at 100 MeV, the possibility that these spectra extend down to lower, MeV energies is supported by the revisited Compton/OSSE observations of V382 Vel 1999. This should motivate early observations with INTEGRAL to search for both soft -ray continuum, in addition to nuclear lines, in future Fermi-novae. Current facilities that can probe the hard X-ray band like Suzaku, NuSTAR, and the upcoming ASTRO-H mission [38] will be invaluable, as well as future MeV missions (e.g., AstroMeV; http://astromev.in2p3.fr). Extrapolating their LAT spectra to higher energies suggest novae could be detected by CTA (see e.g., [5] for V407 Cyg), and can give crucial hints as to the emission mechanism. Simultaneity of such observations will be key, so perhaps then the most important recurrent novae to anticipate for the Fermi mission in the CTA-era are RS Oph (2021? Its last explosion in 2006 did not have -ray coverage) and T CrB (2026?), a very nearby kpc system that could produce a remarkably bright MeV-GeV-TeV -ray source, and a transient neutrino signal expected in the hadronic scenario [30] potentially detectable at even higher energies.
Acknowledgments.
The Fermi-LAT Collaboration acknowledges support for LAT development, operation and data analysis from NASA and DOE (United States), CEA/Irfu and IN2P3/CNRS (France), ASI and INFN (Italy), MEXT, KEK, and JAXA (Japan), and the K.A. Wallenberg Foundation, the Swedish Research Council and the National Space Board (Sweden). Science analysis support in the operations phase from INAF (Italy) and CNES (France) is also gratefully acknowledged. C.C.C. was supported at NRL by a Karles’ Fellowship and by NASA through Guest Investigator programs 12-FERMI12-0026 and 13-FERMI13-0008. We acknowledge with thanks the variable star observations from the AAVSO International Database contributed by observers worldwide and used in this research, and the dedicated observers of the Astronomical Ring for Access to Spectroscopy group (http://www.astrosurf.com/aras/).References
- [1] A. A. Abdo, M. Ackermann, M. Ajello, et al. Science, 329 (2010) 817.
- [2] M. Ackermann, M. Ajello, A. Albert, et al. Science, 345 (2014) 554.
- [3] W. B. Atwood, A. A. Abdo, M. Ackermann, et al. Astrophys. J. 697 (2009) 1071.
- [4] D. P. K. Banerjee, V. Joshi, V. Venkataraman, et al. Astrophys. J. Lett. 785 (2014) L11.
- [5] W. Bednarek, Astropart. Phys. 43 (2013) 81.
- [6] C. C. Cheung, D. Donato, E. Wallace, et al. The Astronomer’s Telegram, 2487 (2010) 1.
- [7] C. C. Cheung, Fermi-LAT collaboration, in 4th Fermi Symposium, eConf C121028 (2012) 106.
- [8] C. C. Cheung, E. Hays, T. Venters, D. Donato, R. H. D. Corbet, The Astronomer’s Telegram, 4224 (2012) 1.
- [9] C. C. Cheung, S. N. Shore, I. De Gennaro Aquino, et al. The Astronomer’s Telegram, 4310 (2012) 1.
- [10] C. C. Cheung, P. Jean, S. N. Shore, The Astronomer’s Telegram, 5649 (2013) 1.
- [11] C. C. Cheung, P. Jean, S. N. Shore, The Astronomer’s Telegram, 5653 (2013) 1.
- [12] C. C. Cheung, P. Jean, S. N. Shore, The Astronomer’s Telegram, 5879 (2014) 1.
- [13] C. C. Cheung, P. Jean, S. N. Shore, The Astronomer’s Telegram, 7283 (2015) 1.
- [14] C. C. Cheung, P. Jean, S. N. Shore, The Astronomer’s Telegram, 7315 (2015) 1.
- [15] L. Chomiuk, J. D. Linford, J. Yang, et al. Nature, 514 (2014) 339.
- [16] M. Della Valle, L. Pasquini, D. Daou, & R. E. Williams, Astron. Astrophys. 390 (2002) 155.
- [17] T. Finzell, L. Chomiuk, U. Munari, & F. M. Walter, 2015, submitted; arXiv:1506.04953
- [18] S. Fujikawa, IAU CBAT, No. 3202 (2012).
- [19] M. Hernanz, in Classical Novae, M. F. Bode, A. Evans, Eds. Cambridge UP, 2nd Ed. (2008) 252.
- [20] A. B. Hill, Fermi-LAT collaboration, in 4th Fermi Symposium, eConf C121028 (2012) 112.
- [21] K. Itagaki, IAU CBAT, No. 3628 (2013).
- [22] W. N. Johnson, R. L. Kinzer, J. D. Kurfess, et al. Astrophys. J. Supp. 86 (1993) 693.
- [23] M. D. Leising, J. E. Grove, R. A. Kroeger, & J. D. Kurfess, in 5th Compton Symposium (1999), A136.
- [24] J. D. Linford, V. A. R. M. Ribeiro, L. Chomiuk, et al. Astrophys. J. 805 (2015) 136.
- [25] K. Mukai, & M. Ishida, Astrophys. J. 551 (2001) 1024.
- [26] U. Munari, S. Dallaporta, F. Castellani, et al. Mon. Not. R. Astron. Soc. 435 (2013) 771.
- [27] U. Munari, F. M. Walter, A. Henden, et al. Information Bulletin on Variable Stars, 6139 (2015) 1.
- [28] K. Nishiyama, F. Kabashima, IAU CBAT, No. 2199 (2010).
- [29] M. Orio, A. Parmar, R. Benjamin, et al. Mon. Not. R. Astron. Soc. 326 (2001) L13.
- [30] S. Razzaque, P. Jean, & O. Mena, Phys. Rev. D, 82 (2010) 123012.
- [31] B. E. Schaefer, Astrophys. J. Supp. 187 (2010) 275.
- [32] G. H. Schaefer, T. T. Brummelaar, D. R. Gies, et al. Nature, 515 (2014) 234.
- [33] J. Seach, IAU CBAT, No. 3732 (2013).
- [34] J. Seach, IAU CBAT, No. 4080 (2015).
- [35] S. N. Shore, G. Schwarz, H. E. Bond, et al. Astron. J. 125 (2003) 1507.
- [36] S. N. Shore, I. De Gennaro Aquino, G. J. Schwarz, et al. Astron. Astrophys. 553 (2013) A123.
- [37] R. Stubbings, IAU CBAT, No. 3803 (2014).
- [38] T. Takahashi, K. Mitsuda, R. Kelley, et al. Proc. SPIE, 8443 (2012) 84431Z.
- [39] V. Tatischeff, & M. Hernanz, Astrophys. J. Lett. 663 (2007) L101.
- [40] R. M. Wagner, S. Dont, T. Bensby, et al. The Astronomer’s Telegram, 4157 (2012) 1.
- [41] P. Williams, A. C. Gilmore, IAU Circ. 7176 (1999) 1.