Substructure within the SSA22 protocluster at 11affiliation: Based on data obtained at the W.M. Keck Observatory, which is operated as a scientific partnership among the California Institute of Technology, the University of California, and the National Aeronautics and Space Administration, and was made possible by the generous financial support of the W.M. Keck Foundation.
Abstract
We present the results of a densely sampled spectroscopic survey of the SSA22 protocluster at . Our sample with Keck/LRIS spectroscopy includes 106 Ly Emitters (LAEs) and 40 Lyman Break Galaxies (LBGs) at . These galaxies are contained within the region in which the protocluster was discovered, which also hosts the maximum galaxy overdensity in the SSA22 region. The redshift histogram of our spectroscopic sample reveals two distinct peaks, at (blue; 43 galaxies) and (red; 103 galaxies). Furthermore, objects in the blue and red peaks are segregated on the sky, with galaxies in the blue peak concentrating towards the western half of the field. These results suggest that the blue and red redshift peaks represent two distinct structures in physical space. Although the double-peaked redshift histogram is traced in the same manner by LBGs and LAEs, and brighter and fainter galaxies, we find that nine out of 10 X-ray AGNs in SSA22, and all seven spectroscopically-confirmed giant Ly “blobs,” reside in the red peak. We combine our dataset with sparsely sampled spectroscopy from the literature over a significantly wider area, finding preliminary evidence that the double-peaked structure in redshift space extends beyond the region of our dense spectroscopic sampling. In order to fully characterize the three-dimensional structure, dynamics, and evolution of large-scale structure in the SSA22 overdensity, we require the measurement of large samples of LAE and LBG redshifts over a significantly wider area, as well as detailed comparisons with cosmological simulations of massive cluster formation.
Subject headings:
galaxies: clusters: individual (SSA22) — galaxies: formation — galaxies: high-redshift — galaxies: starburst — large-scale structure of universe1. Introduction
Clusters represent the largest gravitationally bound and densest structures in the universe. As such, they provide a unique context for studying the formation of both galaxies and large-scale structure. In order to understand how galaxies form and evolve in dense environments, and how these environments themselves evolve, it is important to trace the origins of galaxy clusters. Protoclusters are identified as regions containing significant overdensities of galaxies, which may not yet be virialized but will later evolve into rich galaxy clusters. These cluster seeds provide insight into the origins of the environmental trends observed among galaxies (e.g., Dressler 1980), as well as the assembly of clusters themselves. At this point, tens of protoclusters have been spectroscopically confirmed at (Chiang et al. 2013), with an order of magnitude more high-redshift protocluster candidates photometrically identified (e.g., Planck Collaboration et al. 2015b; Chiang et al. 2014).
The protocluster at in the SSA22 field is one of the best-studied cluster progenitors in the literature. This structure was first identified by Steidel et al. (1998) in the course of a large spectroscopic survey for Lyman Break Galaxies (LBGs; Steidel et al. 2003), and contains an LBG redshift-space overdensity of (Steidel et al. 2000). Based on analytic calculations, Steidel et al. (1998) argued that the SSA22 protocluster will evolve by into a rich Coma-like cluster with .
Following the initial protocluster discovery, an extensive suite of multi-wavelength observations has been assembled in the SSA22 field, spanning from radio through X-ray wavelengths and including high-resolution Hubble Space Telescope imaging. Specifically, mid- and far-infrared, submillimeter, and millimeter observations have been used to study obscured star formation and AGN activity in the SSA22 protocluster (e.g., Geach et al. 2005; Webb et al. 2009; Tamura et al. 2009; Umehata et al. 2015), while deep JHK imaging has enabled the analysis of the most massive protocluster galaxies (Uchimoto et al. 2012; Kubo et al. 2013), and deep Chandra observations have unveiled the X-ray AGN population (Lehmer et al. 2009a, b). The above observations suggest enhancements in the star-formation rate density, and the abundance of both massive galaxies and AGNs in the SSA22 protocluster, relative to the “field” at .
Quite remarkably, narrowband-selected Ly emitting galaxies (LAEs) at have been identified in the original SSA22 pointing and the surrounding 1.38 deg2 area (Steidel et al. 2000; Matsuda et al. 2004; Hayashino et al. 2004; Yamada et al. 2012b), mapping the SSA22 protocluster and its surroundings on scales comoving Mpc. The sample of SSA22 LAEs includes 12 giant Ly “blobs” (LABs), i.e., regions of Ly emission extending over proper kpc in diameter (Matsuda et al. 2011), which may be specifically associated with galaxy overdensities (Prescott et al. 2008; Steidel et al. 2000). Follow-up spectroscopy of LAEs in SSA22 has been used to trace out the three-dimensional structure of this forming protocluster, in which three 30 Mpc 10 Mpc filaments of LAEs may intersect in the region of highest galaxy overdensity (Matsuda et al. 2005). However, with a sample of 56 spectroscopically-confirmed LAEs spread out over 170 arcmin2, the sampling in redshift and position is not particularly dense.
We have obtained spatially dense spectroscopic sampling of LBGs and LAEs, including 146 galaxies at within the original pointing of Steidel et al. (1998). This region also contains the highest overdensity of LAEs in the SSA22 structure (Yamada et al. 2012b). Our large spectroscopic sample reveals previously unknown substructure within the SSA22 overdensity, both in redshift space and on the sky. Characterizing the substructure in SSA22 is crucial for identifying analogous protoclusters in cosmological simulations and understanding the origin and fate of the SSA22 overdensity.
In §2, we describe our observations and redshift measurements for SSA22 LBGs and LAEs. In §3 we discuss the substructure observed within the SSA22 protocluster both in redshift space and on the sky. Finally, in §4 we compare with other work and discuss the implications of our results for understanding the SSA22 protocluster. For this work, we adopt cosmological parameters of , , and (Planck Collaboration et al. 2015a).
2. Observations & Methods
2.1. Data
In the analysis presented here, we consider the redshifts and sky positions of both LAEs and LBGs in the SSA22 field. The LAEs were selected to lie at using deep broadband BV imaging from Subaru/Suprime-cam and narrowband imaging from Keck/LRIS and Subaru/Suprime-cam. The LBGs were drawn from the large survey of Steidel et al. (2003), in which LBGs were identified using deep imaging and photometric selection criteria tuned to find star-forming galaxies at . Our key results are based on dense spectroscopic sampling of galaxies over a region within the original “SSA22a” pointing of Steidel et al. (1998), centered on R.A. = 22:17:34, decl.=00:15:04 (J2000). Keck/LRIS spectroscopy for the LBGs in our sample was obtained over the course of several observing campaigns utilizing different instrumental setups. Within the region of dense spectroscopic sampling, redshifts have been measured for 85% of LBG photometric candidates and 82% of LAE narrowband-selected candidates. A full description of these imaging and spectroscopic observations, including the methods of data reduction, can be found in Steidel et al. (2003) and Nestor et al. (2011, 2013).
2.2. Redshift Measurements
We measured redshifts for objects in our sample based on the observed wavelengths of Ly emission, and, if present, interstellar metal absorption lines. For measuring redshifts, we developed code to systematically fit profiles to either emission or absorption lines. Ly emission profiles were initially fit with single Gaussian functions. In the case of Ly emission exhibiting a double-peaked morphology, however, a single Gaussian did not provide an adequate description of the profile, and an additional Gaussian was required to obtain an acceptable fit. Galaxies with double-peaked Ly emission in our sample typically show one of two different morphologies, with either two peaks of comparable amplitude or else a significantly stronger red peak and weaker blue peak. We used the same method to measure the redshift for both types of double-peaked Ly emission, based on the wavelength of the center of the trough between the two peaks. To estimate the interstellar absorption redshift in LBG spectra, we averaged the redshift measurements from individual absorption lines. In our sample, some objects had repeat observations. In such cases, we adopted the redshift measured from the observation with the highest signal to noise ratio (SNR).
In total, we measured redshifts for 202 galaxies, including 116 LAEs and 86 LBGs. Due to our interest in the protocluster, we now focus only on galaxies at . This redshift cut reduces our sample to 146 galaxies, comprising 106 LAEs and 40 LBGs.
Ly emission and interstellar absorption features typically trace gas that is outflowing from galaxies, which perturbs their measured redshifts from the systemic value. In order to investigate the large-scale structure traced by LBGs and LAEs in SSA22, we need to estimate the systemic redshift of each galaxy. We obtain systemic redshifts for objects in our sample by shifting the measured Ly and interstellar absorption redshifts to the rest frame of the galaxies.
The shift required to estimate the systemic redshift has been measured to be different for LAEs and LBGs, and depends on which spectral features are observed. Based on the results of Trainor et al. (2015), we shifted the redshifts of objects classified as LAEs with only Ly emission by , and the redshifts of LAEs showing both Ly emission and interstellar absorption lines by , where is the velocity difference between the Ly and interstellar absorption redshifts. Based on equations presented in Adelberger et al. (2003), we shifted the redshifts of objects classified as LBGs showing Ly emission by , and finally, the redshifts of LBGs showing only interstellar absorption lines by . To apply the systemic redshift correction, we converted the shifts from velocity to redshift space using . Following these corrections, we obtained a final list of LAE and LBG systemic redshifts.
3. Results
3.1. The SSA22 Redshift Distribution
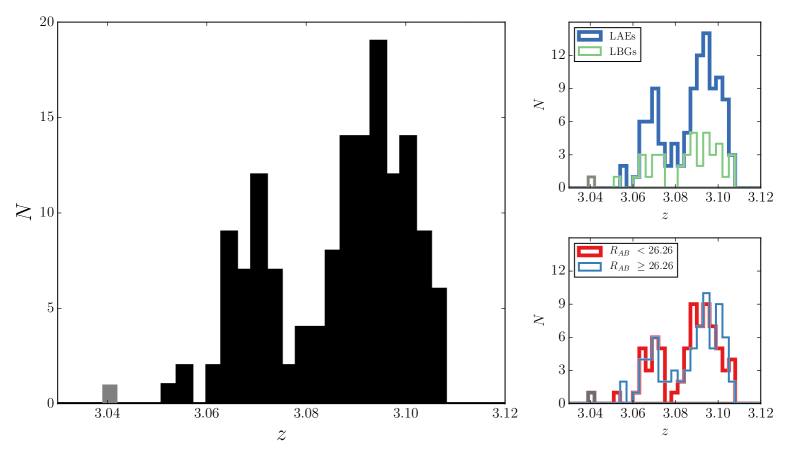
We constructed a histogram from the finalized list of 146 systemic redshifts in the SSA22 field (Figure 1). This histogram shows that the spike discovered in Steidel et al. (1998) at contains two distinct peaks, one with a central redshift of (blue peak), and another centered on (red peak). The peaks are separated by and comoving Mpc along the line of sight. We fit a Gaussian to each of the two peaks, defining the boundary between the two peaks as the bottom of the trough of the distribution (). Accordingly, the blue and red peaks contain, respectively, 43 and 103 galaxies. In velocity space, the standard deviations of the blue and red peaks are, respectively: and . Taking into account the uncertainties associated with estimating systemic redshifts (; Adelberger et al. 2003; Trainor et al. 2015), we find the intrinsic widths to be 310 and 520 , respectively, for the blue and red peaks. We note that the velocity width and centroid of the red peak are similar to values found by Kubo et al. (2015) for a sample of -selected galaxies in the SSA22 overdensity with rest-frame optical spectroscopic measurements. The properties of the two peaks are summarized in Table 1.
| Peak | aaValues in brackets result after deconvolving the uncertainties in systemic redshifts (Adelberger et al. 2003; Trainor et al. 2015) from the observed sample standard deviations in redshift and velocity space. | (km s-1)aaValues in brackets result after deconvolving the uncertainties in systemic redshifts (Adelberger et al. 2003; Trainor et al. 2015) from the observed sample standard deviations in redshift and velocity space. | ||
|---|---|---|---|---|
| Blue | 43 | 3.069 0.001 | (4.74 [4.25] 0.72) | 350 [310] 53 |
| Red | 103 | 3.095 0.001 | (7.37 [7.12] 0.54) | 540 [520] 40 |
We investigated the relative distributions of LAEs and LBGs in the two peaks. As shown in Figure 1, both the LAE and LBG distributions show evidence of double peaked structure. LBGs [LAEs] comprise 28% [72%] of the blue peak, and 27% [73%] of the red peak. A Kolmogorov-Smirnov (K-S) test indicates a probability of 98% that the LAE and LBG redshift distributions are drawn from the same parent distribution.
We also considered how brighter and fainter galaxies are distributed within the SSA22 stucture. All LAEs and LBGs are covered by a deep Subaru/Suprime-Cam R-band image (Hu et al. 2004), ranging in magnitude from (a QSO) to limits fainter than (roughly half of the LAEs). We classified each galaxy as either brighter or fainter, depending on its magnitude relative to the sample median of . As shown in Figure 1, the brighter and fainter histograms are very similar. A K-S test indicates a probability of 87% that the brighter and fainter redshift distributions are drawn from the same parent distribution. Galaxy correlation functions of LBGs suggest that more UV-luminous galaxies are more strongly clustered (Ouchi et al. 2004; Adelberger et al. 2005). In future work, we will compare the relative distributions of brighter and fainter galaxies (i.e., more and less massive dark matter halos) in cosmological simulations of protoclusters (e.g., Klypin et al. 2011) with those observed in the SSA22 overdensity.
Lehmer et al. (2009b) and Alexander et al. (2016) identify eight X-ray AGNs in the SSA22 field with spectroscopic redshifts falling within the protocluster range. We used the X-ray catalog of Lehmer et al. (2009a) to find two additional matches with spectroscopically-confirmed LAEs in our catalogs (LAE017 at and LAE076 at ; Nestor et al. 2013), for a total sample of 10 X-ray AGN at . Nine out of these 10 AGNs fall within the red peak of the SSA22 redshift histogram (and five out of 6 within the field of view of our dense spectroscopic sampling). Although there are more LBGs and LAEs identified in the higher-redshift peak (103, vs. 43 in the lower-redshift peak), the AGN distribution is even more skewed towards higher redshift. Lehmer et al. (2009b) previously noted an enhanced AGN fraction in the SSA22 protocluster, but now we can specifically associate this enhancement with the red peak at . We also note that all seven giant LABs from Matsuda et al. (2011) with spectroscopic redshifts are located in the red peak.
3.2. Sky Positions
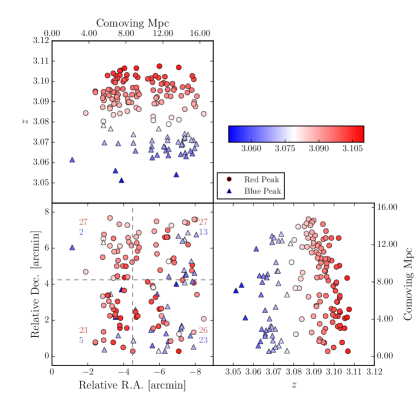
We use the sky positions of SSA22 LAEs and LBGs to investigate the spatial distribution of galaxies within the observed redshift structure. At , for the assumed cosmology, one arcsecond corresponds to kpc (proper). Our observations span comoving Mpc on a side, covering the densest region but not the full extent of the structure mapped out by Matsuda et al. (2005) and Yamada et al. (2012b) (see §4). The redshift interval corresponds to a Hubble-flow distance of comoving Mpc, but the translation between redshift and distance is affected by peculiar velocities.
Quite strikingly, we find differences in the spatial distributions of galaxies located in the two redshift peaks. Figure 2 displays the sky positions of objects in our spectroscopic sample, indicating members of blue and red redshift peaks with, respectively, blue and red symbols. In order to search for a spatial separation of galaxies in different redshift peaks, we split the positions of objects in our sample into quadrants, represented by grey dashed lines in Figure 2 (bottom left), and count the number of galaxies in each quadrant that are within either blue or red redshift peaks. Most significantly, we find that galaxies in the blue peak concentrate towards the western half of the field, with the northeast quadrant showing the strongest deficiency in lower-redshift galaxies. This result suggests that galaxies in blue and red redshift peaks do not span the same physical volume, and that we are observing the edge of the structure containing the galaxies in the blue peak.
4. Discussion
We have measured redshifts for LAEs and LBGs at in the SSA22 field, which clearly delineate two separate peaks in redshift space and also show segregation on the sky. Collectively, these observations suggest that the the two redshift peaks correspond to physically distinct structures.
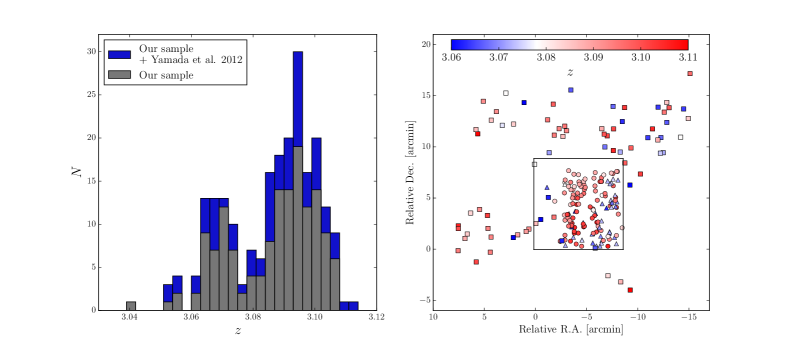
As stated previously, our spectroscopic observations do not cover the full area of the overdensity in LAEs traced by Matsuda et al. (2005) and Yamada et al. (2012b). Therefore, with our data alone, we cannot establish the spatial extent of the double-peaked redshift histogram. However, we can start to address this question with the observations of Yamada et al. (2012a), who survey in the SSA22 field with Subaru/FOCAS spectroscopy and find 91 LAEs at a redshift consistent with the structure. There are 19 LAEs in common with our sample, resulting in 72 additional objects over a significantly larger area on the sky (though with sparser sampling). As shown in Figure 3, in both the Yamada et al. sample alone, and the total sample combined with our data, we detect a double-peaked structure in redshift. This result suggests that the double-peaked structure is not localized to the field of view of our observations. We also observe a relative lack of blue-peak galaxies towards the eastern portion of the field in the combined sample, consistent with our results over a smaller field.
The large-scale structure of the SSA22 overdensity has been considered by Matsuda et al. (2005), who identify three filaments of length comoving Mpc intersecting within the highest-density region of LAEs on the sky, and at in redshift space. One of these apparent filaments is traced by a concentration of galaxies at , which corresponds to the blue peak of our measured histogram.111Given that the majority of objects in our histogram are LAEs, whose redshifts were shifted by to the systemic frame, our measured would appear at a redshift of in the absence of Ly velocity corrections, which were not applied by Matsuda et al.). With much sparser spectroscopic sampling, Matsuda et al. describe this lower-redshift concentration as connecting smoothly with the large belt-like structure of LAEs at that extends comoving Mpc across the sky in the northwest – southeast direction, and corresponds to the red peak of our redshift histogram. In contrast, our well-sampled redshift distribution indicates that the two peaks are distinct structures that do not join smoothly in redshift space or fully overlap on the sky, leading to a qualitatively different description of the large-scale structure in the SSA22 overdensity at .
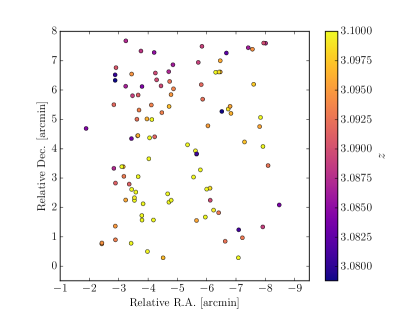
Matsuda et al. (2005) also present a gradient in redshift from northwest (higher redshift) to southeast (lower redshift) within the extended band of LAEs at . As shown in Figure 4, within our smaller field of view, we find a redshift gradient in the red peak () from southwest (higher redshift) to northeast (lower redshift), i.e., rotated by 90 degrees with respect to the gradient presented in Matsuda et al. (2005). Our dense spectroscopic sampling covers only % of the linear dimension of the band of LAEs, so we cannot establish the extent of the redshift gradient we observe. However, based on higher spatial resolution, our sampling of redshifts as a function of position within the red peak reveals a more complex picture than the linear gradient presented by Matsuda et al. (2005).
In order to understand the full three-dimensional architecture, dynamics, origin, and fate of the substructure we have uncovered with our spectroscopic survey of the SSA22 overdensity, we must obtain comparably dense spectroscopy over a significantly larger area – at the very least within the Subaru/Suprime-Cam pointing (SSA22-Sb1 from Yamada et al. 2012b) containing the initial SSA22a field of Steidel et al. (1998). The spectroscopic samples of Matsuda et al. (2005) and Yamada et al. (2012a) begin to address this need, but are both incomplete in terms of areal coverage of the field, and too sparsely sampled within the areas covered. Detailed comparisons with cosmological simulations of large-scale structure formation (e.g., Springel et al. 2005; Klypin et al. 2011) are also required to understand whether the double-peaked substructure in SSA22 will coalesce by or remain as two distinct clusters. We will perform such comparisons in future work.
Acknowledgements
We thank Abhimat Gautam and Tommaso Treu for useful comments. CCS acknowledges support from NSF grants AST-0908805 and AST-1313472. AES acknowledges support from the David & Lucile Packard Foundation. We wish to extend special thanks to those of Hawaiian ancestry on whose sacred mountain we are privileged to be guests. Without their generous hospitality, most of the observations presented herein would not have been possible.
References
- Adelberger et al. (2005) Adelberger, K. L., Steidel, C. C., Pettini, M., et al. 2005, ApJ, 619, 697
- Adelberger et al. (2003) Adelberger, K. L., Steidel, C. C., Shapley, A. E., & Pettini, M. 2003, ApJ, 584, 45
- Alexander et al. (2016) Alexander, D. M., Simpson, J. M., Harrison, C. M., et al. 2016, ArXiv e-prints, arXiv:1601.00682
- Chiang et al. (2013) Chiang, Y.-K., Overzier, R., & Gebhardt, K. 2013, ApJ, 779, 127
- Chiang et al. (2014) —. 2014, ApJ, 782, L3
- Dressler (1980) Dressler, A. 1980, ApJ, 236, 351
- Geach et al. (2005) Geach, J. E., Matsuda, Y., Smail, I., et al. 2005, MNRAS, 363, 1398
- Hayashino et al. (2004) Hayashino, T., Matsuda, Y., Tamura, H., et al. 2004, AJ, 128, 2073
- Hu et al. (2004) Hu, E. M., Cowie, L. L., Capak, P., et al. 2004, AJ, 127, 563
- Klypin et al. (2011) Klypin, A. A., Trujillo-Gomez, S., & Primack, J. 2011, ApJ, 740, 102
- Kubo et al. (2015) Kubo, M., Yamada, T., Ichikawa, T., et al. 2015, ApJ, 799, 38
- Kubo et al. (2013) Kubo, M., Uchimoto, Y. K., Yamada, T., et al. 2013, ApJ, 778, 170
- Lehmer et al. (2009a) Lehmer, B. D., Alexander, D. M., Geach, J. E., et al. 2009a, ApJ, 691, 687
- Lehmer et al. (2009b) Lehmer, B. D., Alexander, D. M., Chapman, S. C., et al. 2009b, MNRAS, 400, 299
- Matsuda et al. (2004) Matsuda, Y., Yamada, T., Hayashino, T., et al. 2004, AJ, 128, 569
- Matsuda et al. (2005) —. 2005, ApJ, 634, L125
- Matsuda et al. (2011) —. 2011, MNRAS, 410, L13
- Nestor et al. (2013) Nestor, D. B., Shapley, A. E., Kornei, K. A., Steidel, C. C., & Siana, B. 2013, ApJ, 765, 47
- Nestor et al. (2011) Nestor, D. B., Shapley, A. E., Steidel, C. C., & Siana, B. 2011, ApJ, 736, 18
- Ouchi et al. (2004) Ouchi, M., Shimasaku, K., Okamura, S., et al. 2004, ApJ, 611, 660
- Planck Collaboration et al. (2015a) Planck Collaboration, Ade, P. A. R., Aghanim, N., et al. 2015a, ArXiv e-prints, arXiv:1502.01589
- Planck Collaboration et al. (2015b) Planck Collaboration, Aghanim, N., Altieri, B., et al. 2015b, A&A, 582, A30
- Prescott et al. (2008) Prescott, M. K. M., Kashikawa, N., Dey, A., & Matsuda, Y. 2008, ApJ, 678, L77
- Springel et al. (2005) Springel, V., White, S. D. M., Jenkins, A., et al. 2005, Nature, 435, 629
- Steidel et al. (1998) Steidel, C. C., Adelberger, K. L., Dickinson, M., et al. 1998, ApJ, 492, 428
- Steidel et al. (2000) Steidel, C. C., Adelberger, K. L., Shapley, A. E., et al. 2000, ApJ, 532, 170
- Steidel et al. (2003) —. 2003, ApJ, 592, 728
- Tamura et al. (2009) Tamura, Y., Kohno, K., Nakanishi, K., et al. 2009, Nature, 459, 61
- Trainor et al. (2015) Trainor, R. F., Steidel, C. C., Strom, A. L., & Rudie, G. C. 2015, ApJ, 809, 89
- Uchimoto et al. (2012) Uchimoto, Y. K., Yamada, T., Kajisawa, M., et al. 2012, ApJ, 750, 116
- Umehata et al. (2015) Umehata, H., Tamura, Y., Kohno, K., et al. 2015, ApJ, 815, L8
- Webb et al. (2009) Webb, T. M. A., Yamada, T., Huang, J.-S., et al. 2009, ApJ, 692, 1561
- Yamada et al. (2012a) Yamada, T., Matsuda, Y., Kousai, K., et al. 2012a, ApJ, 751, 29
- Yamada et al. (2012b) Yamada, T., Nakamura, Y., Matsuda, Y., et al. 2012b, AJ, 143, 79