Power-law creep and residual stresses in a carbopol microgel
Abstract
We report on the interplay between creep and residual stresses in a carbopol microgel. When a constant shear stress is applied below the yield stress , the strain is shown to increase as a power law of time, , with an exponent that is strongly reminiscent of Andrade creep in hard solids. For applied shear stresses lower than some typical value , the microgel experiences a more complex, anomalous creep behaviour, characterized by an initial decrease of the strain, that we attribute to the existence of residual stresses of the order of that persist after a rest time under a zero shear rate following preshear. The influence of gel concentration on creep and residual stresses are investigated as well as possible aging effects. We discuss our results in light of previous works on colloidal glasses and other soft glassy systems.
I Introduction
In the introduction of his 1916 paper, Eugene Cook Bingham states: “In the study of plastic flow it has already been shown that most homogeneous solids will flow somewhat after the manner of liquids, if subjected to sufficient pressure. Copper, steel, lead, ice, menthol, glass, and asphalt fall in this class insofar as they may be regarded as homogeneous solids. But ordinarily plastic substances are not homogeneous solids but suspensions of finely divided solids in fluids, such as paint in oil, lime in water, and especially clay in water. Numerous papers have been devoted to the explanation of this latter type of plasticity.” Bingham, (1916). A hundred years later, in spite of an overwhelming number of works on the subject, the details of plastic flow in such amorphous materials as the clay suspensions studied by Bingham, nowadays referred to as “soft glassy materials,” still resist complete understanding Lin and Wyart, (2016).
Creep, the slow deformation that results from the application of a constant stress on a solidlike material, is a common manifestation of plasticity. Six years before Bingham’s paper, at the age of 23, Edward Neville da Costa Andrade showed that when stretched under a constant load, some metallic wires deform such that the strain grows with time as a power law of exponent 1/3 Andrade, (1910). This behaviour, known as “power-law creep,” has been interpreted in terms of peculiar dislocation motion within the crystalline matrix due to thermally activated processes Cottrell, (1952); Mott, (1953); Cottrell, (1997) or due to dislocation jamming Miguel et al., (2002). Although also observed in a variety of disordered materials including emulsions, microgels and colloidal gels and glasses, the origin of power-law creep remains mostly elusive in such soft amorphous systems Sentjabrskaja et al., (2015).
When the applied stress is increased above some critical value, creep gives way to fracture or to viscous flow depending on the material microstructure. In his 1916 paper, Bingham focused on “English china clay.” Using a capillary viscometer, he showed that this colloidal dispersion was well described by the following affine constitutive relation between the stress and the shear rate : , where is the yield stress of the material and is the viscosity of the material when made to flow far above . Ten years later, this empirical relation was generalized by Winslow Herschel and Ronald Bulkley to , where and are known as the consistency index and flow index respectively Herschel and Bulkley, (1926). This relation accounts for shear-thinning above the yield stress and the exponent typically lies between 0.2 and 0.8 Roberts and Barnes, (2001); Bonn et al., (2015). The Herschel-Bulkley (HB) constitutive relation was found to account correctly for the behaviour of a wide range of disordered materials such as foams, emulsions and microgels, which were recently coined “simple yield stress fluids” by contrast with other soft glassy materials that display more complex rheological behaviour including thixotropy or shear localization Møller et al., 2009b ; Balmforth et al., (2014); Bonn et al., (2015).
An additional well-known feature of glassy systems is their history-dependence. For instance, when a silica glass is thermally quenched below the glass temperature, it stores stresses that remain trapped within the material. These “residual” or “internal” stresses are routinely used to strengthen so-called prestressed glasses in industrial applications. Similarly, soft glassy materials store residual stresses when mechanically quenched from a presheared fluidised state to rest at zero strain or stress Ballauff et al., (2013). The configuration reached by the quenched microstructure is generally metastable and evolves more and more slowly as the system explores more stable configurations. Such a physical aging may subsequently compete with rejuvenation induced by shear Cloitre et al., (2000); Viasnoff and Lequeux, (2002).
The main goal of the present contribution is to explore creep in a carbopol dispersion, a system made of acidic cross-linked polymer particles that swell and jam upon neutralization Ketz et al., (1988); Piau, (2007); Putz and Burghelea, (2009). Such carbopol “microgels” generally nicely follow the HB behaviour and are considered as non-aging, non-thixotropic yield stress materials Curran et al., (2002); Piau, (2007); Lee et al., (2011). However, a number of recent results have reported unexpected results for such a simple yield stress fluid, including rheological hysteresis Putz and Burghelea, (2009); Divoux et al., (2013), transient shear localization Divoux et al., (2012), influence of rest time on stress overshoots upon shear start-up Divoux et al., 2011b and influence of confinement on flow properties Géraud et al., (2013). Creep below the yield stress has only been scarcely explored in carbopol and previous works focused on the debate about the existence of a true yield stress vs a Newtonian plateau at low shear rate Møller et al., 2009a ; Dimitriou et al., (2013).
Here, we focus on a carbopol ETD 2050 dispersion whose preparation, microstructure and basic rheological features are discussed in Section II. Section III presents the results of creep experiments performed after preshear followed by a rest time under a zero shear rate in cone-and-plate geometry. We first show that our microgels display robust power-law creep with an exponent for stresses ranging from the yield stress down to a typical value . For applied shear stresses lower than , the microgels experience a more complex creep behaviour, characterized by an initial decrease of the strain. We attribute this anomalous creep to residual stresses of the order of that slowly relax after quenching the system from a presheared fluidised state and that compete with the applied stress. This behaviour appears to be independent of the carbopol concentration (Appendix B) but is no longer observed if one prevents residual stresses by imposing a zero shear stress during the rest time (Appendix C). In Section IV, these results are discussed in light of the current literature and compared to previous works on other systems in terms of glassy dynamics and aging phenomena. Beside findings specific to carbopol microgels, we emphasize the relevance of creep studies for a better general understanding of soft glassy materials and for deeper investigations of the subtle interplay between microstructure and deformation below the yield stress.
II Materials and methods
II.1 Sample preparation, microstructure and rheology
Our samples are made of carbopol ETD 2050 following the preparation protocol described in Géraud et al., (2013); Géraud, (2013). The carbopol powder, a mixture of homopolymers and copolymers of acrylic acid cross-linked with a polyalkyl polyether, is dissolved in deionized water at 50∘C under magnetic stirring for 30 min. The carbopol mass fraction is % wt throughout this paper, except in Appendix B where mass fractions of 0.6 % wt and 2 % wt are briefly explored. After equilibration at room temperature for 30 min, the acid solution is neutralized by addition of sodium hydroxyde (NaOH at 0.1 M) until the pH reaches a value of . This leads to a dilution of the carbopol solution by about 10 % so that the final carbopol mass fraction is close to 0.9 % wt. Neutralization induces the swelling and jamming of polymer particles Roberts and Barnes, (2001); Baudonnet et al., (2004). The sample is subsequently homogenized for 24 h by stirring with a mixer (RW20, Ika, tip: R1303) at 2000 rpm. Finally, the sample is centrifuged for 10 min at 3200 rpm in order to remove air bubbles.
The microstructure of carbopol ETD 2050 dispersions has been characterized by dynamic light scattering and confocal imaging Lee et al., (2011); Gutowski et al., (2012); Géraud, (2013). It was shown that these systems can be considered as a dense, amorphous assembly of soft jammed particles made of swollen polymers, namely as a “microgel” following a widespread –yet rather loose– definition Baker, (1949); Saunders and Vincent, (1999); Roberts and Barnes, (2001). The typical size of the particles is about m as estimated from confocal microscopy on the same system as that investigated here Géraud, (2013). Such a length scale is consistent with light scattering measurements performed on samples made of the same carbopol and prepared in similar conditions Lee et al., (2011). More specifically, Lee et al., (2011) report the existence of two different length scales, which points to a heterogeneous structure where regions of higher- and lower- than-average cross-link density coexist. This suggests that carbopol ETD 2050 consists of randomly cross-linked polymers rather than polymer particles with heavily cross-linked cores and dangling free ends.
As a result of the percolation of the network of swollen polymer particles, carbopol dispersions typically show a yield stress for weight concentrations as low as 0.06 % Roberts and Barnes, (2001); Oppong et al., (2006); Oppong and De Bruyn, (2011). For concentrations larger than typically 0.2 % wt, rheological measurements suggest that the system can be described as a “space-filling paste of swollen microgel particles” Gutowski et al., (2012). As shown in Appendix A (see Fig. 10), the flow curve of our carbopol ETD 2050 microgel for % wt nicely follows HB rheology, , with parameters Pa, and Pa.sn that are fully consistent with those reported on the same system with similar preparation protocols Divoux et al., (2010, 2012); Gutowski et al., (2012); Géraud et al., (2013). The large extent of the linear regime up to about one strain unit, the low-frequency values of the viscoelastic moduli Pa Pa and their weak increase with frequency (see Fig. 11 in Appendix A) are also in line with previous measurements available in the carbopol literature Ketz et al., (1988); Benmouffok-Benbelkacem et al., (2010); Divoux et al., 2011b ; Gutowski et al., (2012); Géraud, (2013); Jofore et al., (2015). These various rheological features are characteristic of “soft glassy materials” Liu et al., (1996); Fielding et al., (2000); Derec et al., (2003). Although one should keep in mind that there is no universality among these systems due to the huge variety of microstructures, this “simple” yield stress rheology makes carbopol microgels good candidates for generic studies of creep phenomena.
II.2 Creep test and flow cessation protocols
All the experiments reported here were performed with a stress-imposed rheometer (Anton Paar MCR 301) equipped with a cone-and-plate geometry of diameter 40 mm and angle . To minimize wall slip, we used a sand-blasted cone (CP40-2/S) with a roughness of 5.5 m. The bottom plate includes a Peltier element that keeps the temperature fixed to 25∘C. A specific cover is used to limit evaporation and allows us to work on the same sample loading for at most h.
In Sect. III.1 below, we perform creep experiments by monitoring the strain response to a constant shear stress . As in most soft glassy materials, a good control of the initial state of the microgel sample is crucial to warrant reproducibility and to ensure proper analysis of the experimental data. Therefore, prior to any experiment (including the previous viscoelastic measurements), the freshly loaded sample is first thoroughly fluidised thanks to a strong preshear under a controlled shear rate for a duration . The sample is then allowed to rest under a zero shear rate during a waiting time . Such a protocol allows us to start subsequent tests in a reproducible initial state. We note that it slightly differs from usual creep protocols performed from a rest period under a zero shear stress Cloitre et al., (2000); Purnomo et al., (2007). Experiments performed by imposing a zero shear stress rather than a zero shear rate during the rest time are briefly presented in Appendix C. We check for reproducibility (and for lack of evaporation or other long-term degradation of the sample) by systematically measuring the viscoelastic moduli during the rest time under small-amplitude oscillatory shear (strain amplitude 1 % and frequency 1 Hz). The variation in from one experiment to the other over the same loading is found to be less than 1 %.
Unless otherwise specified, we use , and as default parameters for the preshear and rest protocol. The creep test is started immediately after the rest time and the strain is monitored for at least 300 s and up to one hour. Thus, the origin of time is taken here after an “aging” duration following preshear. The influence of and will be addressed in Sect. III.2. Aging issues, i.e. a possible dependence with , will be discussed in Sect. IV.3.
We checked that a constant torque is reached within about 10 ms and that it is kept perfectly constant by the rheometer throughout the creep experiment. However, inertio-elastic oscillations occur upon application of stress and the material is truly submitted to a constant stress only once these oscillations are damped, typically after a couple of seconds (see Fig. 1 and discussion below). After a creep test under a given shear stress , the preshear and rest protocol is repeated over again and another creep test is performed for a different value of . Successive values of are chosen in a random order to avoid any artefact arising from a systematic drift in the sample or in the setup. This procedure is iterated until the elastic modulus at rest differs by more than 10 % from its initial value, indicating evaporation and/or sample alteration, thus requiring to load a new sample. To improve the statistics, creep experiments are reproduced three to six times for the same shear stress on different loadings of the same microgel preparation batch.
Finally, in Sect. III.2, we shall investigate stress relaxation after preshear through flow cessation experiments. The reason for these additional experiments is that our rheometer does not provide the full temporal stress response under small-amplitude oscillatory strain but only the amplitude of the stress oscillations, so that stress relaxation cannot be monitored simultaneously to the viscoelastic moduli. The preshear protocol for flow cessation experiments is the same as for creep experiments, namely preshear under a controlled shear rate for a duration . After preshear, a zero shear rate is applied and the stress is monitored over time whose origin is taken immediately after preshear.
III Results
III.1 Creep tests
III.1.1 Analysis of a typical creep test
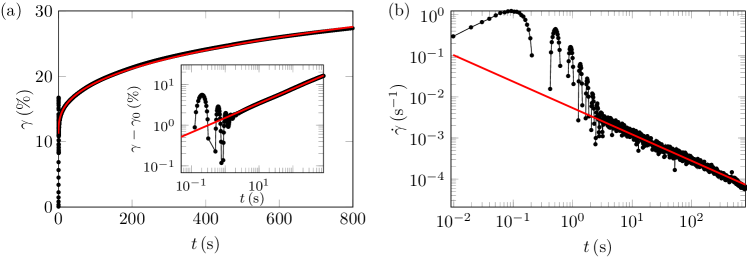
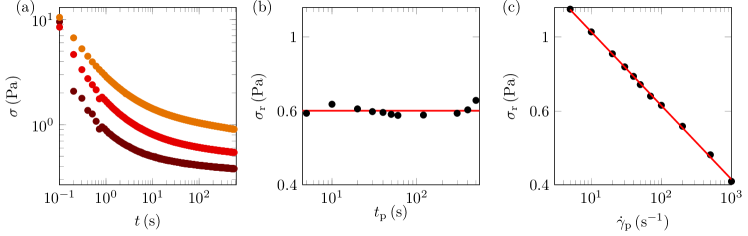
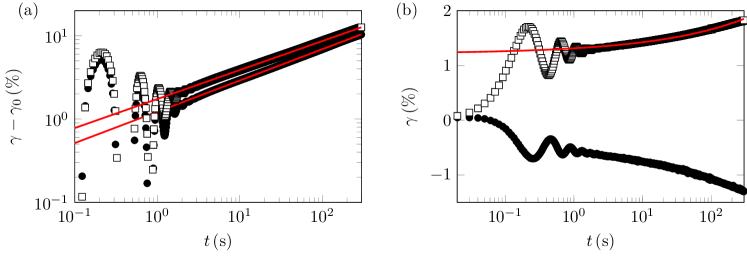
Figure 1(a) displays a typical strain response recorded during a creep test under a shear stress well below the yield stress Pa but larger than 2 Pa. The short-time response involves damped oscillations [see inset of Fig. 1(a) for s] that are characteristic of the coupling between the instrument inertia and the material elasticity in stress-controlled rheometry Ferry, (1980). Although analyzing such oscillations may provide valuable information Baravian and Quemada, (1998); Baravian et al., (2007); Benmouffok-Benbelkacem et al., (2010); Ewoldt and McKinley, (2007), we shall disregard them in the present work as we focus on the long-term creep behaviour of our microgels. In order to quantify the response to creep, we first consider the shear rate obtained by differentiating with respect to time and plotted in Fig. 1(b). As seen by using logarithmic scales, decays as a power law of time, with over almost three decades in time.
Based on the value of the exponent extracted from , we then go back to the strain data and fit by a power law:
| (1) |
with only two adjustable parameters, namely the initial strain and the prefactor . Such a fit is restricted to times larger than a few seconds in order to exclude short-time oscillations. The result is shown as a red line in Fig. 1(a) and the inset confirms that grows as a power law of time. Such a power law is strikingly similar to the power-law creep with exponent 1/3 first reported by Andrade in metallic wires stretched under a constant load Andrade, (1910). This behaviour, referred to as “Andrade-like” scaling, will be discussed in more details in Sect. IV.1 below.
The initial strain corresponds to the instantaneous, elastic deformation that would be observed in the absence of inertio-elastic oscillations i.e. in an “ideal” creep experiment. The time in Eq. (1) corresponds to the point where the strain has increased by 100 % starting from . However, cannot be interpreted as some “characteristic time” of the material since it appears in a power law. As a matter of fact, is generally much larger than the creep duration itself ( in the present case) and has no specific physical significance. In the following, we shall thus discuss only the exponent and the strain .
III.1.2 Creep dependence on the applied stress
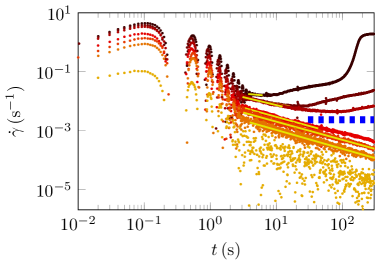
Shear rate responses to several creep tests for imposed stresses ranging from 1 Pa to 15 Pa are gathered in Fig. 2. While experiments performed above the yield stress Pa show a transition from a creep regime to a flowing regime with a non-zero steady-state shear rate (see dark brown curve for Pa) or at least an upturn in the shear rate (see curves for and 14 Pa), creep tests for all decrease to vanishingly small shear rates. This behaviour is typical of the yielding transition. Below the yield stress, the system slowly creeps and the shear rate tends towards zero. Above the yield stress, the material eventually flows although such a solid-to-fluid transition takes increasingly long times as the applied stress approaches the yield stress.
The creep behaviour of microgels made of carbopol ETD 2050 –yet with a different preparation protocol– has been extensively studied above the yield stress by Divoux et al. Divoux et al., 2011a ; Divoux et al., (2012). It was shown that the fluidisation time diverges as a power law of the viscous stress and that the transition towards a flowing state involves a solid–fluid coexistence through the presence of long-lived transient shear bands. Although the goal of the present study is to focus on creep below the yield stress, we emphasize that an Andrade-like scaling was already reported in Divoux et al., 2011a with an exponent of about 1/3 and that the creep regime was shown to involve a locally homogeneous deformation field at scales larger than a few tens of micrometers thanks to ultrasonic velocimetry.
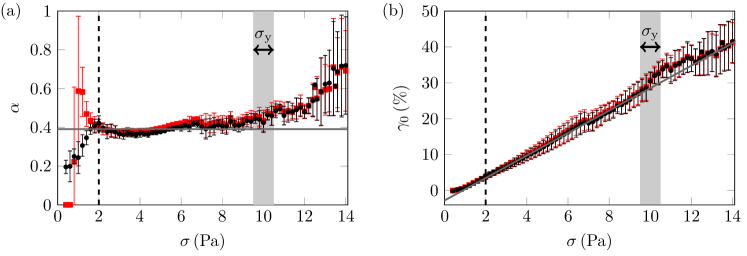
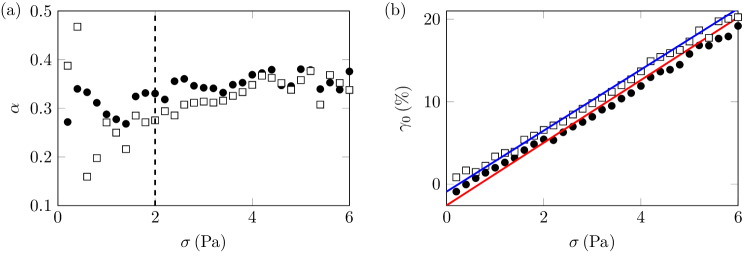
The parameters and , extracted from power-law fits of and as described above, are plotted as a function of the imposed stress with black symbols in Fig. 3. The time intervals over which the fits are performed depend on and are indicated by yellow lines in Fig. 2. The exponent is seen to remain roughly constant for and its mean is . For stresses above the yield stress, the exponent seems to increase significantly. This could be due to the fact that for , the amplitude of the initial inertio-elastic oscillations may reach into the nonlinear regime and significantly affect the material, e.g. through microstructural rearrangements. Yet, the fitting interval gets smaller as the creep regime becomes shorter under larger applied stresses, which makes the error bars on increase dramatically. The value of the Andrade exponent for will be further discussed in Sect. IV.1 in light of the current literature.
Not unexpectedly, the initial elastic deformation increases linearly with over the whole range of applied shear stresses and the proportionality factor Pa is fully consistent with the elastic modulus Pa measured independently through small oscillatory shear. However, it is important to note that the linear fit shown in Fig. 3(b) involves a non-negligible value for . In other words, one has where Pa is significant and points to a specific behaviour at low applied stresses. Correspondingly, the exponent sharply deviates from its mean value when the stress is decreased below a characteristic value Pa.
To test the robustness of the above estimates, Fig. 3 also displays the parameters and obtained by fitting directly the strain response to Eq. (1) with three free parameters. Over the range –10 Pa, the results are almost undistinguishable from those obtained with the previous fitting procedure. For however, the two estimates of strongly differ. This may be due to the fact that for low stresses, differentiating leads to noisy shear rate responses involving negative values of which are not taken into account when fitting the logarithm of the data to a straight line (see Fig. 2 for Pa). This also suggests that Eq. (1) may fail in describing the strain response for .
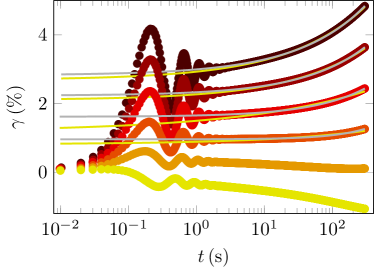
In order to get better insight into the creep behaviour at low applied stresses, Fig. 4 displays strain responses recorded for Pa in semilogarithmic scales. For Pa, can still be well fitted to power laws, leading to the values of reported in Fig. 3(a). It could be tempting to interpret the low values of obtained by first fitting (yellow solid lines in Fig. 4) as logarithmic creep. However, fitting with three free parameters over the same time range leads to much larger values of (gray solid lines in Fig. 4). This is indicative of a high sensitivity to the fitting procedure and questions the validity of the power-law model. Even more strikingly, at even lower stresses ( Pa), strain responses no longer show a monotonic increase once the initial oscillations have died out and even goes to negative values for the smallest applied stress of 0.6 Pa. As shall be shown in the next section, this anomalous behaviour is the signature of a subtle interplay between creep and residual stresses following preshear.
III.2 Interplay between creep and residual stresses
III.2.1 Evidence for residual stresses
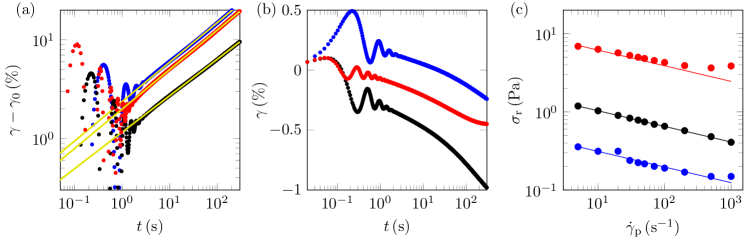
In order to interpret the unusual creep behaviour under low applied stresses, we now turn to the flow cessation experiments shown in Fig. 5(a). The stress is seen to slowly relax and does not seem to tend to zero at long times. This indicates that internal stresses remain within the material over long time scales. For obvious practical reasons, we have to stop the relaxation after a given waiting time , here . We then define the “residual stress” simply as . This residual stress is of the order of 1 Pa and decreases with the preshear rate . Figures 5(b) and (c) show that for a given , is independent of the preshear duration but that it decreases as . This means that the material only keeps a memory of the preshear intensity (as long as it has been previously thoroughly fluidised by preshear).
As will be discussed in more details below in Sect. IV.2, residual stresses result from the quench from a high shear rate to zero shear rate, which traps the microstructure into a configuration that slowly relaxes over time. Here, we note that the values taken by roughly correspond to the stress below which the Andrade exponent significantly differs from in Figs. 3(a) and 4. It is also of the same order of magnitude as the value Pa found in Fig. 3(b). Therefore, the anomalous creep behaviour observed at low stress most likely arises from an effect of this residual stress.
III.2.2 Interpretation of anomalous creep at low applied stresses
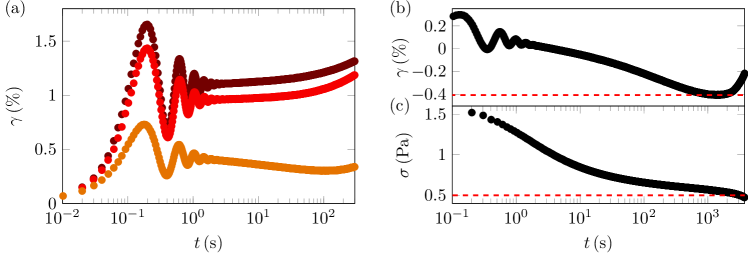
To confirm the link between anomalous creep and residual stresses, we go back to creep experiments at low imposed stress but we now vary the preshear rate for a fixed Pa in Fig. 6(a). The strain response is observed to decrease initially only for the lowest preshear rate i.e. for the largest residual stress after the rest period of 300 s following preshear. When the preshear rate is increased such that the corresponding residual stress lies significantly below the applied stress, Andrade-like creep is recovered.
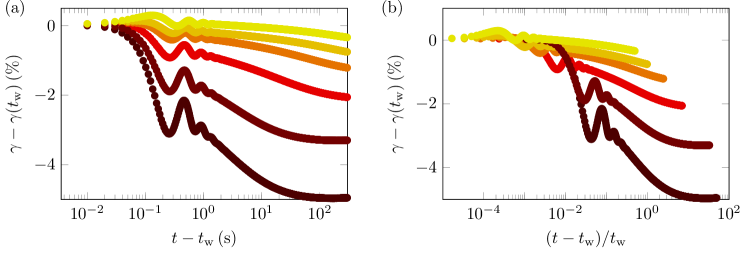
Figures 6(b) and (c) focus on two one-hour long experiments performed on the same loading, respectively a creep test at a very low stress of 0.5 Pa and a stress relaxation for the same preshear protocol. Interestingly, the strain in Fig. 6(b) decreases as long as the stress is larger than 0.5 Pa in Fig. 6(c) and the time at which reaches 0.5 Pa is of the same order of magnitude as the time at which goes through a minimum value of about and starts increasing (see red dashes).
Our interpretation of anomalous creep at low stress is thus as follows. When brought to rest at a zero shear rate, the presheared material stores some internal stresses that do not fully relax even on very long time scales. After a waiting time of 300 s, the resulting macroscopic stress is typically about 1 Pa. When a stress is subsequently applied, the material actually “feels” an effective stress . When , this results in a decreasing strain response after the initial elastic deformation. During such a “backward creep,” the strain may then reach negative values. To put it differently, relaxing residual stresses tend to deform the material in the direction opposite to that of preshear. This is most probably because microstructural deformations induced by preshear in the forward direction are quenched during the rest time at zero shear rate so that releasing the stress (or applying ) tends to relax the structure in the reverse direction. As the microstructure slowly relaxes, the applied stress eventually overcomes residual stresses and the strain starts increasing, although this may take very long times. On the other hand, when , the strain increases right from the start of the creep experiment but residual stresses slow down the strain response, leading to the flatter observed for Pa. This competition between structural relaxation and the applied stress leads to the anomalous creep response observed for Pa. Long-time behaviours similar to those reported here in Figs. 4 and 6 have been observed previously in other microgels under low stresses Cloitre et al., (2000); Purnomo et al., (2007) and raise the question of aging. This will be further discussed in Sect. IV.3.
IV Discussion
Our main findings concern (i) the evidence for robust power laws that characterize the creep behaviour of ETD 2050 carbopol microgels below the yield stress and down to and (ii) the presence of residual stresses after a rest time under a zero shear rate following preshear. These residual stresses are of the same order of magnitude as and compete with the applied stress in creep experiments for and that raise the question of long-term relaxation and glassy dynamics. As shown in Appendix B, these findings are robust to a change of carbopol concentration. Moreover, in Appendix C, we test the more classical protocol where a zero shear stress (rather than a zero shear rate) is imposed during the rest time. These additional measurements show that power-law creep is still present and characterized by the same exponent but that anomalous creep is no longer observed at low applied stresses. Since this zero-stress protocol cancels out any residual stress, this confirms the interplay between creep and residual stresses when a quench to a zero shear rate is applied following preshear. In this section, we further discuss our results in light of previous works on soft materials.
IV.1 Andrade-like creep in soft materials
Power-law creep has been reported in a number of soft systems including cellulose solutions Plazek, (1960), aging polymers Chérière et al., (1997), hexagonal columnar phases Bauer et al., (2006), collagen solutions Gobeaux et al., (2010), carbopol microgels similar to those studied here Møller et al., 2009a ; Divoux et al., 2011a ; Dimitriou et al., (2013), emulsions Paredes et al., (2013); Dinkgreve et al., (2015), colloidal glasses Siebenbürger et al., (2012); Chan and Mohraz, (2014), colloidal gels made of attractive carbon black particles Grenard et al., (2014), natural gum Jaishankar and McKinley, (2012), protein gels Brenner et al., (2009, 2013); Leocmach et al., (2014) and living cells Desprat et al., (2005); Balland et al., (2006); Kollmannsberger and Fabry, (2011); Hecht et al., (2015). The exponent ranges from 0.2 to 0.7 depending on the system. Therefore, Andrade-like creep is ubiquitous in soft matter and the main open question is how it can be interpreted in terms of microstructure.
It appears that the various materials listed above can be broadly divided into two categories. A first category encompasses biological and/or fibrous-like materials such as living cells, protein, collagen or cellulose gels, whose creep eventually leads to irreversible failure. These materials are generally characterized not only by power-law creep but also by a “power-law rheology” in the sense that their linear viscoelastic moduli depend upon frequency as power laws, , with the same exponent as the strain in creep experiments. Power-law rheology is generally understood as deriving from the fractal nature of the underlying microstructural network Muthukumar, (1989); Patricio et al., (2015); Hung et al., (2015). Since the viscoelastic spectrum and the creep compliance are related through a Laplace transform, the link between power-law rheology and power-law creep is straightforward at least in the small deformation regime Desprat et al., (2005); Tschoegl, (2012). Interestingly, based on Scott-Blair’s fractional approach and material “quasiproperties” Blair et al., (1947), such a link can be extended to more complex linear rheologies and even to nonlinear viscoelasticity Jaishankar and McKinley, (2014). Moreover, power-law creep, as well as the critical behaviour of some protein gels approaching failure Leocmach et al., (2014), is well captured by a family of models known as “fiber-bundle models” (FBMs) Kun et al., 2003a ; Kovács et al., (2008); Jagla, (2011) that were originally devised for solid fibrous materials such as fiber-matrix composites Nechad et al., 2005b ; Nechad et al., 2005a . However, so far, some important assumptions of FBMs, such as local vs global load sharing Kun et al., 2003b or damage accumulation Halász et al., (2012) by the “fibers” that constitute the microstructure, have not been evidenced experimentally in real soft systems.
The second category, which is more relevant to the present work, gathers a number of “soft glassy materials” that are characterized by an amorphous microstructure made of a dense assembly of particles. These materials include hexagonal columnar phases, colloidal glasses, emulsions and carbopol microgels. They generically show an almost frequency-independent elastic modulus so that there is not such an obvious link between their linear viscoelasticity and power-law creep as for the previous class of materials. Rather, the origin of power-law creep in soft glassy materials and its relation to their structural properties remain to be fully unveiled. In particular, a recent single-mode reduction of mode-coupling theory (MCT) generalized to transient regimes suggests that under certain conditions and in the low-frequency range, the elastic modulus is essentially frequency-independent and the viscous modulus scales as where corresponds to the Andrade exponent Frahsa, (2015). Here, we note from Fig. 11(a) that so that this exponent is indeed compatible with the Andrade exponent. Clearly, more systematic work is required to decide whether this is mere coincidence or whether there is a fundamental connection between the frequency-dependence of the viscous modulus and power-law creep in soft glassy materials. Let us also point out that a recent model of an elasto-plastic material with kinematic hardening predicts power-law creep where the Andrade exponent is linked to the Herschel-Bulkley exponent through for and for Dimitriou et al., (2013). Unfortunately, with , this corresponds to negative values of i.e. to decreasing strains inconsistent with the Andrade-like creep observed experimentally.
By analogy with the motion of dislocations and vacancies that gives rise to Andrade creep in crystalline solids Cottrell, (1952); Mott, (1953); Cottrell, (1997); Miguel et al., (2002, 2008); Nabarro, (2004), it has been speculated that power-law creep arises from collective particle dynamics within the dense, disordered microstructure. A phenomenological model based on this idea and introducing a time-dependent fraction of mobile and arrested particles correctly predicts the Andrade exponent observed in emulsions from the scaling of the steady-state flow curve with the volume fraction Paredes et al., (2013). Direct evidence for such heterogeneous dynamics under creep came only very recently from both simulations and experiments on hard-sphere colloidal glasses Chaudhuri and Horbach, (2013); Sentjabrskaja et al., (2015). Using simultaneous rheology and confocal microscopy, Sentjabrskaja et al. could make a quantitative link between the strain response and dynamical heterogeneities that remain spatially localized and sub-diffusive during creep but grow in size and become transiently super-diffusive at the onset of steady flow. In particular, they showed that the mean squared displacement follows the same power law as the strain, , with for in simulations and for in experiments. Although applied stresses smaller than the yield stress were not investigated experimentally, probably due to the very small value of mPa, this study provides promising key results on microscopic dynamics during the creep of colloidal glasses. Interestingly, simulations show that dynamical heterogeneities may arrange into macroscopic shear bands during power-law creep Chaudhuri and Horbach, (2013) while local measurements –yet on rather large spatial scales– have suggested that the deformation remains homogeneous Divoux et al., 2011a ; Grenard et al., (2014). This obviously deserves more work and confocal microscopy appears as an excellent tool to address this issue.
Of course the present measurements, which are restricted to global rheological data, do not provide any insight into local dynamics. However, we note that the Andrade exponent takes very similar values in carbopol, emulsions and colloidal glasses. Our results also show that power-law creep is observed below the yield stress down to very small applied stresses. We believe that microscopy experiments coupled to rheology are in line to fully understand creep in carbopol microgels where the above picture of mobile vs arrested particles is likely to fail since the microstructure is constituted of swollen polymer particles that are compressed and deformed against each other.
IV.2 Residual stresses in soft materials
Over the last few years, interest into residual stresses in soft materials has grown spectacularly. It is acknowledged that residual stresses (also sometimes referred to as “internal” stresses) result from history-dependent microstructural features that are frozen-in upon cessation of shear and generally decrease with the preshear rate or stress. Recent studies include polyelectrolyte microgels Mohan et al., (2013, 2015), colloidal gels Osuji et al., (2008); Negi and Osuji, (2009, 2010) as well as colloidal glasses Ballauff et al., (2013). Numerical simulations of random jammed assemblies of non-Brownian elastic spheres have shown that residual stresses can be attributed to quenched angular distortions of the microstructure that slowly relax over time Mohan et al., (2013).
To the best of our knowledge, in carbopol microgels, residual stresses have only been mentioned by a few studies and in the specific contexts of bubble rise Piau, (2007); Mougin et al., (2012), penetrometry Boujlel and Coussot, (2012), capillary rise Géraud et al., (2014) and surface tension measurements Jørgensen et al., (2015). While Coussot et al. have raised the possibility that residual stresses interfere with the creep response at low applied stresses in bentonite, mustard and a hair gel mostly constituted of carbopol Coussot et al., (2006), no quantitative analysis of this phenomenon had been performed as in the present work. As seen in Fig. 5(c) for a fixed , the residual stress decreases as a weak power law of with an exponent which seems rather insensitive to the concentration [see Fig. 12(c) in Appendix B]. Interestingly, residual stresses measured from experiments on colloidal glasses and from molecular dynamics simulations are consistent with such a scaling, although power-law fits were not performed by the authors (see Fig. 2 in Ballauff et al., (2013)). Moreover, it could be argued that the logarithmic scaling evidenced in polyelectrolyte microgels, with the preshear stress Mohan et al., (2013, 2015), is actually compatible with the present weak power law of .
IV.3 Aging or not aging?
Andrade-like creep and/or residual stresses are commonly predicted from various non-ergodic models for glassy behaviour, including the “Soft Glassy Rheology” (SGR) model derived from local probabilistic descriptions Fielding et al., (2000), the “Shear Transformation Zone” (STZ) theory Falk and Langer, (2011); Bouchbinder and Langer, (2011), MCT Ballauff et al., (2013); Frahsa, (2015) and more phenomenological approaches Dinkgreve et al., (2015); Joshi, (2015). There, the progressive slowing down of the shear rate observed under creep is attributed to aging, i.e. to the fact that the system explores deeper and deeper potential wells in the complex energy landscape that results from the wealth of ever-evolving configurations accessible to the glassy system. In the case of step-strain response, aging can be defined as “the property that a significant part of the stress relaxation takes place on time scales that grow with the age of the system” Fielding et al., (2000).
These observations obviously question the possible implication of aging in the interplay between creep and residual stresses observed in our experiments. As a matter of fact, decreasing strain responses under small applied stresses have been reported in polyelectrolyte microgels Cloitre et al., (2000). Together with logarithmic strain recovery curves after flow cessation, these peculiar creep responses have been interpreted in terms of aging phenomena. More precisely, the curves measured under a stress first increase and then keep decreasing logarithmically over the course of several hours without any sign of levelling off. The time at which starts to decrease was shown to correspond to the “age” of the system, defined as the waiting time at rest between preshear and the creep measurement, so that all strain responses under low stresses can be collapsed by plotting as function of . Similar results were later reported in thermosensitive pNIPAM microgels for Purnomo et al., (2007) and successfully modeled with an STZ theory Bouchbinder and Langer, (2011). Such a striking behaviour, characterized by a response in the direction opposite to the preshear flow, was ascribed to structural relaxation and strong aging effects: after a rest time , configurations with relaxation times faster than have relaxed so that, when a small stress is applied, the strain increases at short times but decreases for as configurations with relaxation times longer than relax. Above a typical stress , ever-increasing strain responses are observed that are still dependent on due to competition between aging and partial rejuvenation. This transition between normal and anomalous creep occurs at a relative stress which is quantitatively very close to that found in our experiments.
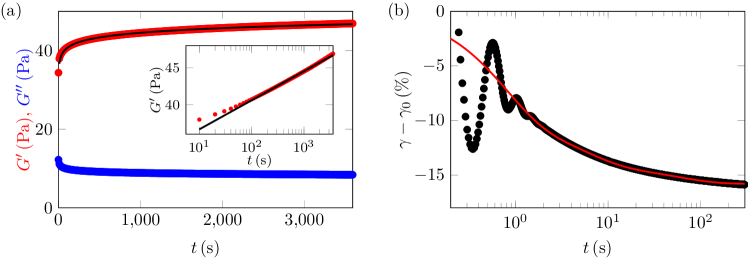
In order to decide whether aging could be at play in the long-time creep behaviour of our carbopol microgels, we first test for the time evolution of the elastic modulus over one hour after preshear in Fig. 7(a). As already reported on similar ETD 2050 carbopol samples Divoux et al., 2011b , we find that the elastic modulus recovers a value of about 40 Pa within a few seconds but that it subsequently increases logarithmically with time [see inset of Fig. 7(a)] while the viscous modulus concomitantly decreases. Therefore, we observe a slow consolidation, i.e. enhanced elasticity and smaller dissipation over time, that could be interpreted as the signature of some aging process Fielding et al., (2000); Derec et al., (2003); Coussot et al., (2006). However, focusing on strain relaxation after preshear provides a somewhat different picture. Figure 7(b) indeed shows that following a fast quench from a stress value Pa well above the yield stress down to zero stress, the strain does not decrease logarithmically as observed in polyelectrolyte microgels by Cloitre et al., (2000). Rather it is well fitted by a sum of three exponentials, which hints at a viscoelastic-like relaxation mechanism. Thus, it appears that our system reaches an equilibrium state within a few minutes in contrast with strongly aging materials (compare with Fig. 1 in Cloitre et al., (2000)). We also note that in the case of thermosensitive pNIPAM microgels, strain relaxations were not strictly logarithmic and seemed to level off after a few minutes (see Fig. 4 in Purnomo et al., (2007)). This could be indicative of aging effects intermediate between the present study and those in Cloitre et al., (2000).
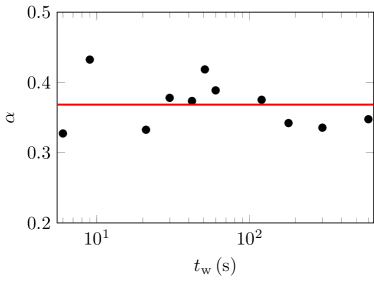
To further test the influence of the “age” of the system on its creep behaviour, we performed series of creep experiments with different rest times during which the viscoelastic moduli are monitored through small-amplitude oscillatory shear (strain amplitude 1 % and frequency 1 Hz). When the applied stress is well above , we observe power-law creep whatever the age of the system. Moreover, as seen in Fig. 8 for , the Andrade exponent does not display any systematic variation with and the average of 0.37 is consistent with found previously. This indicates that, if present, aging has little effect on Andrade-like creep.
In Fig. 9(a), a stress , well below , is applied for different values of . There, a clear influence of on anomalous creep is observed: for short waiting times, the strain decrease is faster and much sharper. Such strain responses significantly differ from those of polyelectrolyte microgels (compare with Fig. 2 in Cloitre et al., (2000)). Here, neither a strain maximum nor a long-time logarithmic decrease is observed. Moreover, as shown in Fig. 9(b), the strain response does not scale as . The influence of on at low stresses may thus be simply interpreted as the signature of the relaxation of residual stresses over (viscoelastic) time scales of a few tens of seconds: when s, Fig. 5(a) indeed shows that residual stresses sharply decrease so that for shorter , a higher level of residual stress induces a stronger strain decrease but the strain eventually levels off and starts to increase as the applied stress becomes larger than the residual stress.
To conclude this discussion, the above comparison with previous results on microgels suggests that aging does not have a paramount influence on the creep behaviour of our carbopol samples. Even if we observe long-lasting stress and strain relaxations, these are most likely to be of viscoelastic origin than due to true glassy dynamics.
V Conclusion
We have shown that microgels constituted of carbopol ETD 2050 display power-law creep with an exponent of about 0.4 whatever the carbopol concentration. Additionally, when quenched from a fluidised state to a constant strain, these samples store residual stresses that relax in a viscoelastic-like fashion (rather than logarithmically as observed in other systems with strong aging effects). These residual stresses result in an anomalous creep behaviour under low shear stresses: for , the strain initially decreases but levels off and eventually increases after a time that depends on the preshear rate, on the rest time and on the applied stress. Here, we do not observe strain responses with long-time logarithmic decreasing trends that scale as , which points to the absence of significant aging effects.
Future work will explore other types of carbopol microgels, such as carbopol Ultrez 10 and carbopol 940 or 941, in order to check for the generality of Andrade-like creep and residual stresses. Investigations based on confocal microscopy should also provide deeper insight into the origin of power-law creep and of stress relaxation in microgels.
Acknowledgements.
The authors wish to thank P. Coussot, T. Divoux and G. Ovarlez for enlightening discussions.Appendix A: Rheological characterization of carbopol ETD 2050 samples
Flow curve measurement
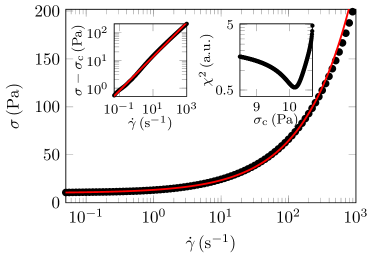
The flow curve of our 1 % wt carbopol microgel recorded through a downward shear-rate sweep is shown in Fig. 10 together with the best HB fit, , yielding Pa, and Pa.sn. Let us emphasize here our method for estimating the yield stress . Instead of fitting the flow curve with the full HB model that involves three free parameters, which can raise some convergence issues due to nonlinearity depending on the fitting algorithm and on the initial guess for the parameters Mullineux, (2008), we first set to some arbitrary value and compute the best linear fit of vs . Fitting a straight line in logarithmic coordinates rather than fitting vs as a power law allows us to give the same weight to small shear rates and to larger ones. We compute the residuals of this fit, defined as the sum of the squared distances from the experimental data to the fit. We then vary systematically over a realistic range and look for a minimum of vs . As shown in the upper right inset of Fig. 10, goes through a well-defined minimum: the stress Pa corresponding to this minimum is thus taken as the yield stress of our microgel. It can be checked in the upper left inset of Fig. 10 that with this value of , the difference follows a strict power law of with no significant deviation over the whole range of shear rates. This method allows us to confidently estimate the yield stress of our microgels to within 1 % for a given flow curve measurement. In the case of Fig. 10, this procedure yields Pa, and Pa.sn. We note that a direct HB fit of the same data with three free parameters leads to significantly different estimates ( Pa, and Pa.sn), which illustrates the importance of using a careful fitting procedure as described here.
Still, it should be noted that we observe a reproducibility of the best HB fit parameters of only about 10 %. For instance, for the same preparation batch, we found values of ranging from 9.5 to 10.5 Pa from one loading of the cone-and-plate geometry to the other. Since the flow curves are measured through decreasing shear rate sweeps, the loading history is efficiently erased at high shear rates and such variations can only be explained by small differences in the sample volume from one loading to the other. We checked that the various flow curves are simply shifted along the stress axis from one measurement to the other and that the scatter is typically 1 Pa, which confirms that variations in HB parameters essentially stem from variations in the loaded sample volume.
Linear and nonlinear viscoelastic measurements
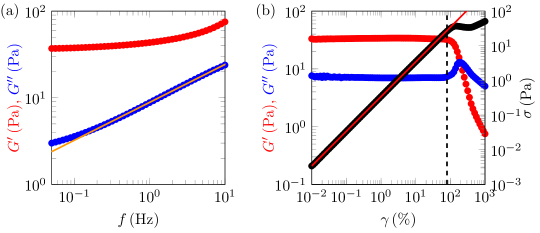
The linear viscoelastic moduli of our microgels are shown as a function of oscillation frequency in Fig. 11(a). The storage modulus Pa increases weakly over the whole frequency range. Here again, we observe variations of by about 10 % from one loading to the other. The loss modulus remains always smaller than and can be well fitted by a power law at high frequencies. The oscillatory strain sweep of Fig. 11(b) shows that the linear regime, characterized by an elastic modulus Pa, extends up to strain amplitudes of about 100%. The nonlinear regime involves a sharp drop of the storage modulus and a local maximum in the loss modulus. This corresponds to a case of “weak strain overshoot” as classified by Huyn et al. in their review on large-amplitude oscillatory shear Hyun et al., (2011) and appears as a distinctive feature of soft glassy materials, including microgels de Souza Mendes et al., (2014). In systems like emulsions and microgels, the maximum in is generally attributed to enhanced dissipation due to local irreversible particle rearrangements that progressively invade the whole sample before yielding and complete fluidisation Mason et al., (1995); Knowlton et al., (2014). We note that the point at which and cross corresponds to a stress of about 36 Pa, significantly above the yield stress measured from the flow curve in Fig. 10. Since this article is mostly devoted to creep experiments performed below the yield stress, where the strain shall not increase beyond 100 %, we do not expand more on the nonlinear behaviour of our carbopol ETD 2050 samples and refer the reader to the cited literature for more details.
Appendix B: Influence of the carbopol concentration
The robustness of our findings has been tested by considering two other concentrations of carbopol ETD 2050, namely % wt and 2 % wt. As shown in Fig. 12(a) for similar normalized stresses, , power-law creep is observed in all three samples. Table 1 gathers the rheological parameters of the various samples as well as the results of the analysis of strain responses in the Andrade-like regime as described in Sect. III.1.2. We find a remarkably robust mean Andrade exponent of for all concentrations. Here again, the prefactor deduced from the initial elastic deformation is in good agreement with the elastic modulus . The parameter is non-zero and increases with in the same fashion as the elastic modulus and the yield stress. This suggests that residual stresses also come into play for % wt and 2 % wt.
Indeed, for applied stresses such that , the same decreasing trend is observed in the strain response for all three concentrations [see Fig. 12(b)]. The presence of residual stresses for % wt and 2 % wt is further confirmed through flow cessation experiments performed as in Sect. III.2.1. Figure 12(c) shows that decreases roughly as for all concentrations with an amplitude that scales with like and (see Table 1). We conclude that a similar interplay between creep and residual stress occurs at low stresses whatever the carbopol concentration.
| (% wt) | (Pa) | (Pa) | (Pa) | (Pa) | (Pa) | |
|---|---|---|---|---|---|---|
| 0.6 | 0.20 | |||||
| 1 | 0.65 | |||||
| 2 | 4.9 |
Appendix C: Influence of the rest protocol
In order to test the influence of the rest protocol, Fig. 13 compares creep experiments following a rest period performed either under a zero shear stress or under a zero shear rate (or more precisely under small strain oscillations with amplitude 1% and frequency 1 Hz, which were checked to effectively correspond to a zero shear rate). As shown in Fig. 13(a) for , the Andrade exponent is robust to a change of rest protocol but the initial deformation is slightly smaller when rest is imposed under a zero shear rate. Moreover, when the imposed stress is decreased to , anomalous creep characterized by a decreasing strain is recovered only in the case of rest under a zero shear rate [see Fig. 13(b)]. In the case of rest performed under a zero shear stress, Andrade-like response persists down to the lowest imposed stresses as shown by the fit in Fig. 13(b).
Andrade fit parameters are displayed in Fig. 14 which confirms the good collapse of the exponents independent of the rest protocol, provided the imposed stress is large enough and anomalous creep is avoided. The linear fits of vs show that the difference noted above in the initial deformation does not stem from the slope which remains close to the elastic modulus of the microgel but from the intercept which is significantly larger in the case of rest under zero shear rate (0.7 Pa) than in the case of rest under zero shear stress (0.2 Pa). These results indicate that imposing a zero shear stress during the rest time essentially cancels out residual stresses so that power-law creep is observed even at very low applied stresses.
References
- Andrade, (1910) Andrade, E. N. d. C. A. (1910). The viscous flow in metals, and allied phenomena. Proc. R. Soc. London A, 84(1):1–12.
- Baker, (1949) Baker, W. (1949). Microgel, a new macromolecule. relation to sol and gel as structural elements of synthetic rubber. Ind. Eng. Chem., 41:511–520.
- Balland et al., (2006) Balland, M., Desprat, N., Icard, D., Féréol, S., Asnacios, A., Browaeys, J., Hénon, S., and Gallet, F. (2006). Power laws in microrheology experiments on living cells: Comparative analysis and modeling. Phys. Rev. E, 74:021911.
- Ballauff et al., (2013) Ballauff, M., Brader, J. M., Egelhaaf, S. U., Fuchs, M., Horbach, J., Koumakis, N., Krüger, M., Laurati, M., Mutch, K. J., Petekidis, G., et al. (2013). Residual stresses in glasses. Phys. Rev. Lett., 110(21):215701.
- Balmforth et al., (2014) Balmforth, N. J., Frigaard, I. A., and Ovarlez, G. (2014). Yielding to stress: recent developments in viscoplastic fluid mechanics. Annual Review of Fluid Mechanics, 46:121–146.
- Baravian et al., (2007) Baravian, C., Benbelkacem, G., and Caton, F. (2007). Unsteady rheometry: can we characterize weak gels with a controlled stress rheometer? Rheol. Acta, 46(5):577–581.
- Baravian and Quemada, (1998) Baravian, C. and Quemada, D. (1998). Using instrumental inertia in controlled stress rheometry. Rheol. Acta, 37(3):223–233.
- Baudonnet et al., (2004) Baudonnet, L., Grossiord, J.-L., and Rodriguez, F. (2004). Effect of dispersion stirring speed on the particle size distribution and rheological properties of three carbomers. J. Dispersion Sci. Technol., 25(2):183–192.
- Bauer et al., (2006) Bauer, T., Oberdisse, J., and Ramos, L. (2006). Collective rearrangement at the onset of flow of a polycrystalline hexagonal columnar phase. Phys. Rev. Lett., 97:258303.
- Benmouffok-Benbelkacem et al., (2010) Benmouffok-Benbelkacem, G., Caton, F., Baravian, C., and Skali-Lami, S. (2010). Non-linear viscoelasticity and temporal behavior of typical yield stress fluids: Carbopol, xanthan and ketchup. Rheol. Acta, 49:305–314.
- Bingham, (1916) Bingham, E. (1916). An investigation of the laws of plastic flow. US Bureau of Standards Bulletin, 13:309–353.
- Blair et al., (1947) Blair, G. W. S., Veinoglou, B. C., and Caffyn, J. E. (1947). Limitations of the newtonian time scale in relation to non-equilibrium rheological states and a theory of quasi-properties. Proc. R. Soc. London, Ser. A, 189:69–87.
- Bonn et al., (2015) Bonn, D., Denn, M. M., Berthier, L., Divoux, T., and Manneville, S. (2015). Yield stress materials in soft condensed matter. arXiv:1502.05281.
- Bouchbinder and Langer, (2011) Bouchbinder, E. and Langer, J. S. (2011). Shear-transformation-zone theory of linear glassy dynamics. Phys. Rev. E, 83:061503.
- Boujlel and Coussot, (2012) Boujlel, J. and Coussot, P. (2012). Measuring yield stress: a new, practical, and precise technique derived from detailed penetrometry analysis. Rheol. Acta, 51:867–882.
- Brenner et al., (2013) Brenner, T., Matsukawa, S., Nishinari, K., and Johannsson, R. (2013). Failure in a soft gel: Delayed failure and the dynamic yield stress. J. Non-Newtonian Fluid Mech., 196:1–7.
- Brenner et al., (2009) Brenner, T., Nicolai, T., and Johannsson, R. (2009). Rheology of thermo-reversible fish protein isolate gels. Food Res. Int., 42(8):915–924.
- Chan and Mohraz, (2014) Chan, H. K. and Mohraz, A. (2014). Microdynamics of dense colloidal suspensions and gels under constant-stress deformation. J. Rheol., 58(5):1419–1439.
- Chaudhuri and Horbach, (2013) Chaudhuri, P. and Horbach, J. (2013). Onset of flow in a confined colloidal glass under an imposed shear stress. Phys. Rev. E, 88(4):040301.
- Chérière et al., (1997) Chérière, J., Bélec, L., and Gacougnolle, J. (1997). The three successive stages of creep of pmma between 55∘c and 90∘c. Polym. Eng. Sci., 37(10):1664–1671.
- Cloitre et al., (2000) Cloitre, M., Borrega, R., and Leibler, L. (2000). Rheological aging and rejuvenation in microgel pastes. Phys. Rev. Lett., 85:4819–4822.
- Cottrell, (1952) Cottrell, A. (1952). The time laws of creep. J. Mech. Phys. Solids, 1(1):53–63.
- Cottrell, (1997) Cottrell, A. (1997). Logarithmic and andrade creep. Philos. Mag. Lett., 75(5):301–308.
- Coussot et al., (2006) Coussot, P., Tabuteau, H., Chateau, X., Tocquer, L., and Ovarlez, G. (2006). Aging and solid or liquid behavior in pastes. J. Rheol., 50:975–994.
- Curran et al., (2002) Curran, S., Hayes, R. E., Afacan, A., Williams, M., and Tanguy, P. (2002). Properties of carbopol solutions as models for yield-stress fluids. J. Food Sci., 67(1):176–180.
- de Souza Mendes et al., (2014) de Souza Mendes, P. R., Thompson, R. L., Alicke, A. A., and Leite, R. T. (2014). The quasilinear large-amplitude viscoelastic regime and its significance in the rheological characterization of soft matter. J. Rheol., 58(2):537–561.
- Derec et al., (2003) Derec, C., Ducouret, G., Ajdari, A., and Lequeux, F. (2003). Aging and nonlinear rheology in suspensions of polyethylene oxide-protected sililca particles. Phys. Rev. E, 67:061403.
- Desprat et al., (2005) Desprat, N., Richert, A., Simeon, J., and Asnacios, A. (2005). Creep function of a single living cell. Biophys. J., 88(3):2224–2233.
- Dimitriou et al., (2013) Dimitriou, C. J., Ewoldt, R. H., and McKinley, G. H. (2013). Describing and prescribing the constitutive response of yield stress fluids using large amplitude oscillatory shear stress (laostress). J. Rheol., 57:27–70.
- Dinkgreve et al., (2015) Dinkgreve, M., Paredes, J., Michels, M., and Bonn, D. (2015). Universal rescaling of flow curves for yield-stress fluids close to jamming. Phys. Rev. E, 92(1):012305.
- (31) Divoux, T., Barentin, C., and Manneville, S. (2011a). From stress-induced fluidization processes to herschel-bulkley behaviour in simple yield stress fluids. Soft Matter, 7:8409–8418.
- (32) Divoux, T., Barentin, C., and Manneville, S. (2011b). Stress overshoot in a simple yield stress fluid: an extensive study combining rheology and velocimetry. Soft Matter, 7:9335–9349.
- Divoux et al., (2013) Divoux, T., Grenard, V., and Manneville, S. (2013). Rheological hysteresis in soft glassy materials. Phys. Rev. Lett., 110:018304.
- Divoux et al., (2010) Divoux, T., Tamarii, D., Barentin, C., and Manneville, S. (2010). Transient shear banding in a simple yield stress fluid. Phys. Rev. Lett., 104:208301.
- Divoux et al., (2012) Divoux, T., Tamarii, D., Barentin, C., Teitel, S., and Manneville, S. (2012). Yielding dynamics of a herschel-bulkley fluid: a critical-like fluidization behaviour. Soft Matter, 8:4151–4164.
- Ewoldt and McKinley, (2007) Ewoldt, R. H. and McKinley, G. H. (2007). Creep ringing in rheometry or how to deal with oft-discarded data in step stress tests! Rheol. Bull., pages 4–6.
- Falk and Langer, (2011) Falk, M. L. and Langer, J. (2011). Deformation and failure of amorphous, solidlike materials. Annu. Rev. Condens. Matter Phys., 2(1):353–373.
- Ferry, (1980) Ferry, J. D. (1980). Viscoelastic properties of polymers. John Wiley & Sons.
- Fielding et al., (2000) Fielding, S. M., Sollich, P., and Cates, M. E. (2000). Aging and rheology in soft materials. J. Rheol., 44(2):323–369.
- Frahsa, (2015) Frahsa, F. (2015). Nonlinear response of glass-forming dispersions under applied time-dependent deformations. PhD thesis, Konstanz University.
- Géraud, (2013) Géraud, B. (2013). Wetting and confined dynamics of complex fluids. PhD thesis, Université de Lyon.
- Géraud et al., (2013) Géraud, B., Bocquet, L., and Barentin, C. (2013). Confined flows of a polymer microgel. Eur. Phys. J. E, 36(3):1–13.
- Géraud et al., (2014) Géraud, B., Jørgensen, L., Petit, L., Delanoë-Ayari, H., Jop, P., and Barentin, C. (2014). Capillary rise of yield-stress fluids. Europhys. Lett., 107(5):58002.
- Gobeaux et al., (2010) Gobeaux, F., Belamie, E., Mosser, G., Davidson, P., and Asnacios, S. (2010). Power law rheology and strain-induced yielding in acidic solutions of type i–collagen. Soft Matter, 6:3769–3777.
- Grenard et al., (2014) Grenard, V., Divoux, T., Taberlet, N., and Manneville, S. (2014). Timescales in creep and yielding of attractive gels. Soft Matter, 10:1555–1571.
- Gutowski et al., (2012) Gutowski, I. A., Lee, D., de Bruyn, J. R., and Frisken, B. J. (2012). Scaling and mesostructure of carbopol dispersions. Rheol. Acta, 51(5):441–450.
- Halász et al., (2012) Halász, Z., Danku, Z., and Kun, F. (2012). Competition of strength and stress disorder in creep rupture. Phys. Rev. E, 85:016116.
- Hecht et al., (2015) Hecht, F. M., Rheinlaender, J., Schierbaum, N., Goldmann, W. H., Fabry, B., and Schäffer, T. E. (2015). Imaging viscoelastic properties of live cells by afm: power-law rheology on the nanoscale. Soft Matter, 11(23):4584–4591.
- Herschel and Bulkley, (1926) Herschel, W. H. and Bulkley, R. (1926). Konsistenzmessungen von gummi-benzollösungen. Kolloid Zeitschrift, 39(4):291–300.
- Hung et al., (2015) Hung, K.-C., Jeng, U.-S., and hui Hsu, S. (2015). Fractal structure of hydrogels modulates stem cell behavior. ACS Macro Letters, 4(9):1056–1061.
- Hyun et al., (2011) Hyun, K., Wilhelm, M., Klein, C. O., Cho, K. S., Nam, J. G., Ahn, K. H., Lee, S. J., Ewoldt, R. H., and McKinley, G. H. (2011). A review of nonlinear oscillatory shear tests: Analysis and application of large amplitude oscillatory shear (laos). Prog. Polym. Sci., 36:1697–1753.
- Jagla, (2011) Jagla, E. A. (2011). Creep rupture of materials: Insights from a fiber bundle model with relaxation. Phys. Rev. E, 83:046119.
- Jaishankar and McKinley, (2012) Jaishankar, A. and McKinley, G. H. (2012). Power-law rheology in the bulk and at the interface: quasi-properties and fractional constitutive equations. Proc. R. Soc. A, page 20120284.
- Jaishankar and McKinley, (2014) Jaishankar, A. and McKinley, G. H. (2014). A fractional k-bkz constitutive formulation for describing the nonlinear rheology of multiscale complex fluids. J. Rheol., 58:1751–1788.
- Jofore et al., (2015) Jofore, B. D., Erni, P., Vleminckx, G., Moldenaers, P., and Clasen, C. (2015). Rheology of microgels in single particle confinement. Rheol. Acta, 54(7):581–600.
- Jørgensen et al., (2015) Jørgensen, L., Le Merrer, M., Delanoë-Ayari, H., and Barentin, C. (2015). Yield stress and elasticity influence on surface tension measurements. Soft Matter, 11(25):5111–5121.
- Joshi, (2015) Joshi, Y. M. (2015). A model for aging under deformation field, residual stresses and strains in soft glassy materials. Soft Matter, 11(16):3198–3214.
- Ketz et al., (1988) Ketz, R. J., Prud’homme, R. K., and Graessley, W. W. (1988). Rheology of concentrated microgel solutions. Rheol. Acta, 27:531–539.
- Knowlton et al., (2014) Knowlton, E. D., Pine, D. J., and Cipelletti, L. (2014). A microscopic view of the yielding transition in concentrated emulsions. Soft Matter, 10:6931–6940.
- Kollmannsberger and Fabry, (2011) Kollmannsberger, P. and Fabry, B. (2011). Linear and nonlinear rheology of living cells. Annu. Rev. Mater. Res., 41:75–97.
- Kovács et al., (2008) Kovács, K., Nagy, S., Hidalgo, R. C., Kun, F., Herrmann, H. J., and Pagonabarraga, I. (2008). Critical ruptures in a bundle of slowly relaxing fibers. Phys. Rev. E, 77:036102.
- (62) Kun, F., Hidalgo, R. C., Herrmann, H. J., and Pál, K. F. (2003a). Scaling laws of creep rupture of fiber bundles. Phys. Rev. E, 67:061802.
- (63) Kun, F., Moreno, Y., Hidalgo, R., and Hermann, H. (2003b). Creep rupture has two universality classes. Europhys. Lett., 63(3):347–353.
- Lee et al., (2011) Lee, D., Gutowski, I. A., Bailey, A. E., Rubatat, L., de Bruyn, J. R., and Frisken, B. J. (2011). Investigating the microstructure of a yield-stress fluid by light scattering. Phys. Rev. E, 83(3):031401.
- Leocmach et al., (2014) Leocmach, M., Perge, C., Divoux, T., and Manneville, S. (2014). Creep and fracture of a protein gel under stress. Phys. Rev. Lett., 113(3):038303.
- Lin and Wyart, (2016) Lin, J. and Wyart, M. (2016). Mean-field description of plastic flow in amorphous solids. Phys. Rev. X, 6:011005.
- Liu et al., (1996) Liu, A. J., Ramaswamy, S., Mason, T., Gang, H., and Weitz, D. (1996). Anomalous viscous loss in emulsions. Phys. Rev. Lett., 76(16):3017–3020.
- Mason et al., (1995) Mason, T. G., Bibette, J., and Weitz, D. A. (1995). Elasticity of compressed emulsions. Phys. Rev. Lett., 75:2051–2054.
- Miguel et al., (2008) Miguel, M.-C., Laurson, L., and Alava, M. (2008). Material yielding and irreversible deformation mediated by dislocation motion. Eur. Phys. J. B, 64:443–450.
- Miguel et al., (2002) Miguel, M.-C., Vespignani, A., Zaiser, M., and Zapperi, S. (2002). Dislocation jamming and andrade creep. Phys. Rev. Lett., 89:165501.
- Mohan et al., (2013) Mohan, L., Bonnecaze, R. T., and Cloitre, M. (2013). Microscopic origin of internal stresses in jammed soft particle suspensions. Phys. Rev. Lett., 111(26):268301.
- Mohan et al., (2015) Mohan, L., Cloitre, M., and Bonnecaze, R. T. (2015). Build-up and two-step relaxation of internal stress in jammed suspensions. J. Rheol., 59(1):63–84.
- (73) Møller, P. C. F., Fall, A., and Bonn, D. (2009a). Origin of apparent viscosity in yield stress fluids below yielding. Europhys. Lett., 87:38004.
- (74) Møller, P. C. F., Fall, A., Chikkadi, V., Derks, D., and Bonn, D. (2009b). An attempt to categorize yield stress fluid behaviour. Phil. Trans. R. Soc. Lond. A, 367:5139–5155.
- Mott, (1953) Mott, N. (1953). A theory of work-hardening of metals ii: Flow without slip-lines, recovery and creep. Philos. Mag., Ser. 7, 44(354):742–765.
- Mougin et al., (2012) Mougin, N., Magnin, A., and Piau, J.-M. (2012). The significant influence of internal stresses on the dynamics of bubbles in a yield stress fluid. J. Non-Newtonian Fluid Mech., 171:42–55.
- Mullineux, (2008) Mullineux, G. (2008). Non-linear least squares fitting of coefficients in the herschel–bulkley model. Appl. Math. Model., 32(12):2538–2551.
- Muthukumar, (1989) Muthukumar, M. (1989). Screening effect on viscoelasticity near the gel point. Macromolecules, 22(12):4656–4658.
- Nabarro, (2004) Nabarro, F. R. N. (2004). Do we have an acceptable model of power-law creep? Mater. Sci. Eng. A, 387-389:659–664.
- (80) Nechad, H., Helmstetter, A., Guerjouma, R. E., and Sornette, D. (2005a). Andrade and critical time-to-failure laws in fiber-matrix composites: Experiments and model. J. Mech. Phys. Solids, 53:1099–1127.
- (81) Nechad, H., Helmstetter, A., Guerjouma, R. E., and Sornette, D. (2005b). Creep ruptures in heterogeneous materials. Phys. Rev. Lett., 94:045501.
- Negi and Osuji, (2009) Negi, A. S. and Osuji, C. O. (2009). Dynamics of internal stresses and scaling of strain recovery in an aging colloidal gel. Phys. Rev. E, 80:010404(R).
- Negi and Osuji, (2010) Negi, A. S. and Osuji, C. O. (2010). Physical aging and relaxation of residual stresses in a colloidal glass following flow cessation. J. Rheol., 54(5):943–958.
- Oppong and De Bruyn, (2011) Oppong, F. and De Bruyn, J. (2011). Mircorheology and jamming in a yield-stress fluid. Rheologica acta, 50(4):317–326.
- Oppong et al., (2006) Oppong, F. K., Rubatat, L., Bailey, A. E., Frisken, B. J., and de Bruyn, J. R. (2006). Microrheology and structure of a polymer gel. Phys. Rev. E, 73:041405.
- Osuji et al., (2008) Osuji, C. O., Kim, C., and Weitz, D. A. (2008). Shear thickening and scaling of the elastic modulus in a fractal colloidal system with attractive interactions. Phys. Rev. E, 77:060402(R).
- Paredes et al., (2013) Paredes, J., Michels, M. A. J., and Bonn, D. (2013). Rheology across the Zero-Temperature Jamming Transition. Phys. Rev. Lett., 111:015701.
- Patricio et al., (2015) Patricio, P., Leal, C. R., Duarte, J., and Januario, C. (2015). Rheology of the cytoskeleton as a fractal network. Phys. Rev. E, 92(4):040702.
- Piau, (2007) Piau, J. M. (2007). Carbopol gels: Elastoviscoplastic and slippery glasses made of individual swollen sponges. meso- and macroscopic properties, constitutive equations and scaling laws. J. Non-Newtonian Fluid Mech., 144:1–29.
- Plazek, (1960) Plazek, D. J. (1960). Dynamic mechanical and creep properties of a 23solution: Andrade creep in polymeric systems. J. Colloid Sci., 15:50–75.
- Purnomo et al., (2007) Purnomo, E. H., van den Ende, D., Mellema, J., and Mugele, F. (2007). Rheological properties of aging thermosensitive suspensions. Phys. Rev. E, 76:021404.
- Putz and Burghelea, (2009) Putz, A. M. and Burghelea, T. I. (2009). The solid–fluid transition in a yield stress shear thinning physical gel. Rheol. Acta, 48(6):673–689.
- Roberts and Barnes, (2001) Roberts, G. P. and Barnes, H. A. (2001). New measurements of the flow-curves for carbopol dispersions without slip artefacts. Rheol. Acta, 40:499–503.
- Saunders and Vincent, (1999) Saunders, B. R. and Vincent, B. (1999). Microgel particles as model colloids: theory, properties and applications. Adv. Colloid Interface Sci., 80(1):1–25.
- Sentjabrskaja et al., (2015) Sentjabrskaja, T., Chaudhuri, P., Hermes, M., Poon, W. C. K., Horbach, J., Egelhaaf, S. U., and Laurati, M. (2015). Creep and flow of glasses: strain response linked to the spatial distribution of dynamical heterogeneities. Sci. Rep., 5(January):11884.
- Siebenbürger et al., (2012) Siebenbürger, M., Ballauff, M., and Voigtmann, T. (2012). Creep in colloidal glasses. Phys. Rev. Lett., 108:255701.
- Tschoegl, (2012) Tschoegl, N. W. (2012). The phenomenological theory of linear viscoelastic behavior: an introduction. Springer Science & Business Media.
- Viasnoff and Lequeux, (2002) Viasnoff, V. and Lequeux, F. (2002). Rejuvenation and overaging in a colloidal glass under shear. Phys. Rev. Lett., 89:065701.