Hubble Space Telescope Observations of Accretion-Induced Star Formation in the Tadpole Galaxy Kiso 5639
Abstract
The tadpole galaxy Kiso 5639 has a slowly rotating disk with a drop in metallicity at its star-forming head, suggesting that star formation was triggered by the accretion of metal-poor gas. We present multi-wavelength HST WFC3 images of through band plus H to search for peripheral emission and determine the properties of various regions. The head has a mass in young stars of and an ionization rate of s-1, equivalent to O9-type stars. There are four older star-forming regions in the tail, and an underlying disk with a photometric age of Gyr. The mass distribution function of 61 star clusters is a power law with a slope of . Fourteen young clusters in the head are more massive than , suggesting a clustering fraction of 30%-45%. Wispy filaments of H emission and young stars extend away from the galaxy. Shells and holes in the head Hii region could be from winds and supernovae. Gravity from the disk should limit the expansion of the Hii region, although hot gas might escape through the holes. The star formation surface density determined from H in the head is compared to that expected from likely pre-existing and accreted gas. Unless the surface density of the accreted gas is a factor of or more larger than what was in the galaxy before, the star formation rate has to exceed the usual Kennicutt-Schmidt rate by a factor of .
Subject headings:
galaxies: star formation– galaxies: photometry – galaxies: dwarf – galaxies: star clustersI. Introduction
Tadpole galaxies are characterized by a bright star-forming head and an elongated tail with weak star formation. They are sometimes called cometary (Markarian, 1969; Loose & Thuan, 1985; Cairós et al., 2001) and are designated sub-class iI,c of the Blue Compact Dwarf (BCD) type by Noeske et al. (2000). Other local tadpoles were studied by Kniazev et al. (2001), Gil de Paz, Madore, & Pevunova (2003), Papaderos et al. (2008), Elmegreen et al. (2012), and others. They are rare in the local universe, where only 0.2 of the 10,000 galaxies in the Kiso Survey of UV Bright Galaxies (Miyauchi-Isobe, Maehara, & Nakajima, 2010) are tadpoles (Elmegreen et al., 2012), but they are common, 75% (Morales-Luis et al., 2011), among local extremely metal poor (XMP) galaxies, which have metallicities less than 0.1 solar.
The association between tadpole shapes and BCD or low metallicity galaxies suggests an element of youthfulness. Indeed, tadpoles are relatively common in the early Universe, amounting to some 10% of all galaxies larger than 10 pixels in diameter in the Hubble Space Telescope Ultra Deep Field (Elmegreen et al., 2005), and a similar fraction in other deep fields (van den Bergh et al., 1996; Straughn et al., 2006; Windhorst et al., 2006). XMP galaxies are also gas-rich, giving them a low average Hi star formation efficiency ( star formation surface density/Hi surface density), but they have relatively few stars, so their specific star formation rates (SFR/stellar mass) are high, comparable to those in high redshift galaxies (Filho et al., 2015).
| RA | Dec | filter | Exposure time | Date | |
|---|---|---|---|---|---|
| (J2000) | J2000 | (sec) | |||
| 11 41 09.410 | +32 25 27.21 | F225W | 2508.0 | 02-16-2015 | |
| 11 41 09.410 | +32 25 27.21 | F336W | 2508.0 | 02-16-2015 | |
| 11 41 08.702 | +32 25 40.21 | F438W | 1248.0 | 07-02-2015 | |
| 11 41 08.702 | +32 25 40.21 | F547M | 1248.0 | 07-02-2015 | |
| 11 41 08.702 | +32 25 40.21 | F606W | 1310.0 | 07-02-2015 | |
| 11 41 08.702 | +32 25 40.21 | F814W | 1310.0 | 07-02-2015 | |
| 11 41 08.640 | +32 25 41.13 | F657N | 2624.0 | 07-02-2015 |
Single slit spectra of 22 tadpoles or XMP galaxies have been used to determine metallicities along the major axes and, in a few cases, rotation curves. Sánchez Almeida et al. (2013) obtained spectra of 7 tadpoles with the 2.5m Isaac Newton Telescope and the 2.5m Nordic Optical Telescope on Tenerife. Rotation was observed, with a peak speed of several tens of km s-1, as expected for these low mass objects. The metallicities were unusual, however. As inferred from the N2 index (the ratio [N II]/H), the metallicities were lowest in the star-forming heads in 6 out of the 7 cases. Sánchez Almeida et al. (2014a) determined metallicities in 7 more dwarf galaxies with the 4.2 m William Hershel Telescope using the “direct method” (i.e., [SII] lines for electron density, [OIII] lines for electron temperature of [OIII], and [OII] lines ) for electron temperature of [OII], with a sum of the oxygen states up to [OIII] to give the oxygen abundance relative to hydrogen). Of these 7 galaxies, 2 out of 5 with measurable metallicities had low values in the head; the other 2 were ambiguous. Spectra of another 10 XMPs, including tadpoles, were obtained with the 10.4m Gran Telescopio Canarias using the HII-CHI-mistry algorithm (Pérez-Montero, 2014, i.e., minimizing the fit to many lines). In 9 out of 10 cases, the metallicities were lower in the heads by factors of 3 to 10 (Sánchez Almeida et al., 2015).
We interpret these metallicity drops as the result of recent accretion of metal-poor gas onto part of an otherwise quiescent dwarf galaxy. Idealized simulations (Verbeke et al., 2014) as well as cosmological simulations of galaxy formation (Ceverino et al., 2016) show this effect. A recent review of accretion-fed star formation is discussed in Sánchez Almeida et al. (2014b). Support for this interpretation comes from the locations of most of the XMPs in low-density environments, such as voids and sheets in the distribution of galaxies (Filho et al., 2015). They are surrounded by low-metallicity, often-asymmetric Hi (Filho et al., 2013), which could be the accreting gas reservoir. Motion through this reservoir could cause the accretion and promote star formation on the leading edge of the dwarf, as might have happened for 30 Doradus in the Large Magellanic Cloud (Mastropietro et al., 2009). High-mass late-type galaxies could also be bursting with star formation in their outer parts from episodic accretion (Huang et al., 2013).
One of the best examples of a metallicity drop is in the bright star-forming head of the local tadpole galaxy Kiso 5639, which is the focus of the present paper. Here we examine Hubble Space Telescope (HST) Wide Field Camera 3 (WFC3) multiwavelength images of Kiso 5639 to determine the masses and ages of the clusters and large-scale star-forming clumps, and to search for evidence of accretion on the periphery. Our data are presented in Section II, analyses are in Section III, results are in Section IV, and conclusions are in Section V.
II. Observations and Data Reduction
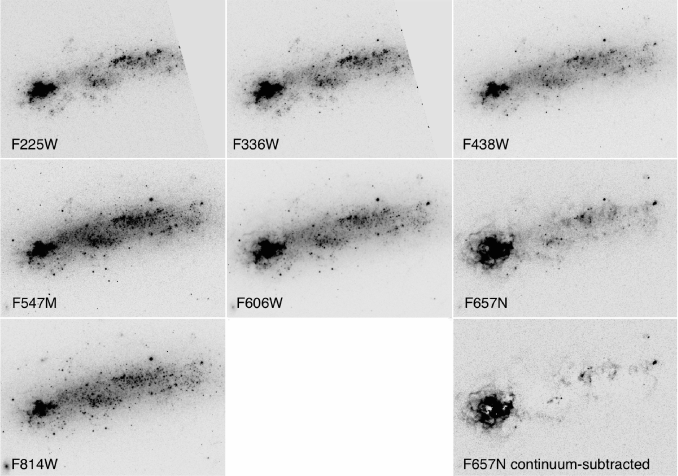
Kiso 5639 (LEDA-36252, KUG 1138+327) is a small emission line galaxy approximately 2.7 kpc in diameter at a galactocentric distance of 24.5 Mpc (NED111NASA/IPAC Extragalactic Database, http://ned.ipac.caltech.edu). It is slowly rotating with a velocity of 35-40 km s-1, giving it a dynamical mass of 1.5 (Sánchez Almeida et al., 2013). Its photometric mass is 5 based on Sloan Digital Sky Survey images (Elmegreen et al., 2012), and the Hi mass is around (Salzer et al., 2002, see Sect. IV.4). HST WFC3/UVIS images of Kiso 5639 were obtained in February and July 2015 (Proposal 13723) in filters F225W, F336W, F438W, F547M, F606W, F814W, and F657N (H + N II), where the parentheses indicate wide (W), medium (M), and narrow (N) filters with central wavelengths in nanometers; exposure times and coordinates for the observations are listed in Table 1. At the assumed distance, the pixel size of 0.0396 arcsec corresponds to 4.7 pc. We placed the galaxy near the edge of the detector to put it close to the read-out to minimize charge transfer efficiency (CTE) degradation effects, and adjusted its position with the F225W and F336W filters to avoid a bright star.
The WFC3/UVIS instrument has degraded over time due to radiation damage, reducing the CTE, which results in smeared images along the read-out direction when not corrected (MacKenty & Smith, 2012). The science images are therefore CTE corrected using code provided by STScI222http://www.stsci.edu/hst/wfc3/tools/cte_tools. However, the dark calibrations also suffer from this degradation, and therefore we required special calibration files to mask all the hot pixels, and remove a background gradient and splotchy pattern in the science images. To do so, we created custom super-darks following the method described in Rafelski et al. (2015), which use all CTE corrected post-flash darks from an anneal cycle to determine the average dark level per good pixel, and mark all hot pixels on shorter timescales with a uniform threshold. This resulted in cleaner and more accurate images, especially for near ultra-violet and narrow-band images. The CTE-corrected and newly calibrated science exposures were then combined using AstroDrizzle and an 0.8 pixel fraction at the original pixel scale.
Figure 1 shows the images for the individual filters and for the continuum-subtracted H image. The latter was made by scaling the average counts of the F547M image to the F657N image using the ratio of the PHOTFLAM values333http://www.stsci.edu/hst/wfc3/phot_zp_lbn for the two filters. PHOTFLAM is the inverse sensitivity, given in units of erg cm-2 Å-1 per electron count. In practice, this means that the F547M image was divided by 4.78 and then subtracted from the F657N image to make the continuum-subtracted H image. We used the F547M filter for this rather than the F606W filter because the F606W filter contains the H line and an equally strong [OIII] line at 5008 according to the spectrum of this galaxy in the SDSS. The F547M filter lies between these lines.
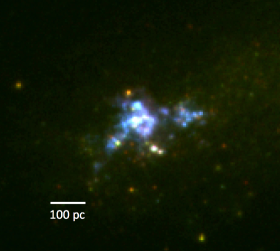
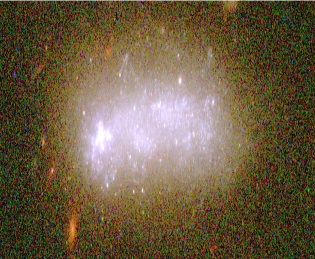
Color composite figures were made in the Image Reduction and Analysis Facility (IRAF) using RGB in DS9. Figure 2 shows F438W as blue, F547M as green, and F657N as red (which is H including the continuum). The line indicates 500 pc, corresponding to . The periphery of the galaxy is outlined by red wispy protrusions from H, discussed further in Section IV. These wisps are shown better in Figure 3, which is F657N on a linear scale, Gaussian smoothed by a factor of 5 in DS9 to enhance the faint structures.
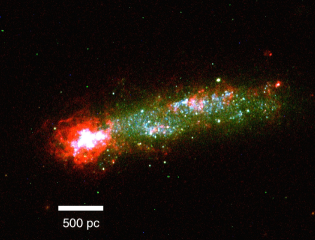
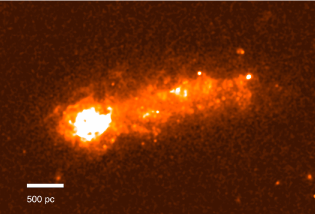
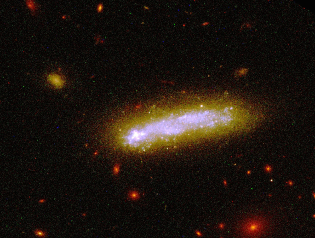
Figure 4 shows a large field of view with F438W as blue, F547M as green, and F814W as red. Small background galaxies can be seen, including a larger galaxy with an unknown redshift to the NE of Kiso 5639. The image is shown on a logarithmic scale to enhance the extended envelope around the main body of Kiso 5639. Note the extended oval of yellow color, which is interpreted in Section IV.2 as an underlying disk. There is also a small network of intersecting filaments in the north, one-third of the way along the galaxy from the head to the tail.
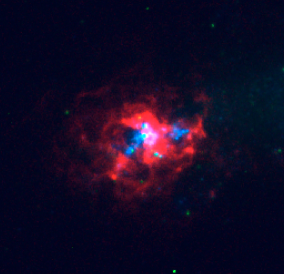
The head region is shown enlarged in Figure 5, with F438W in blue, F547M in green, and F814W in red. The line indicates 100 pc, or . There are many bright clusters and discrete regions of star formation that are described in the following sections. In Figure 6, the H continuum-subtracted image is shown in red, with F547M in green and F225W in blue, to highlight the juxtaposition of young clusters with the H. There are many cavities in the Hii region (Sect. IV.3.5).
III. Analysis
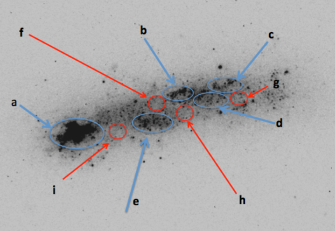
Photometric measurements were made of star-forming regions for each image using the task imstat in IRAF. Boxes were defined around the 5 most prominent large-scale clumps, 100-200 pc in diameter, based on isophotal contours in the F438W image. One clump is the bright part of the head and four are in the tail. These 5 regions are identified as blue ellipses in Figure 7 and labeled through . The average interclump background was subtracted from each measurement to get the magnitudes of the individual regions. The interclump surface brightnesses in regions through were also determined. Photometric zeropoints from the WFC3 website444http://www.stsci.edu/hst/wfc3/phot_zp_lbn were used to convert counts to AB mag.
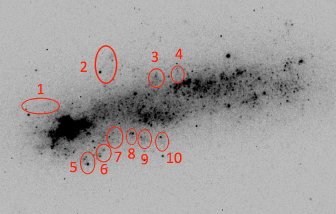
In addition, 61 individual clusters or unresolved complexes 10-20 pc in size were measured in all of these regions, selected by eye from the F438W images. These clusters are brighter than 25 AB mag in the F438W image. The average interclump background was subtracted from each of these. Ten filamentary regions extending away from the bright part of the galaxy were measured too, as outlined in Figure 8, with no background subtraction.
Masses and ages were determined by fitting photometric magnitudes and colors to population synthesis models from Bruzual & Charlot (2003) with wavelength-dependent extinction laws from Calzetti et al. (2000) and Leitherer et al. (2002). We followed the procedures in Elmegreen et al. (2012) and previous papers, using the integrated population spectra as a function of time as tabulated in Bruzual & Charlot (2003), and the UVIS filters on HST. Throughputs for the UVIS filters were from the WFC3 website555http://www.stsci.edu/hst/wfc3/ins_performance/throughputs/Throughput_Tables. The Chabrier initial mass function (IMF) and a metallicity of 0.2 solar were assumed. For the individual clusters, color models were generated, with the age of the cluster corresponding to the beginning of star formation, and an exponential decay going forward. Models for the large star-forming regions and the interclump regions were made assuming a constant SFR back to the fitted age.
Many models were run for each region, covering all combinations of visual extinction from 0 to 7.5 mag in steps of 0.25 mag, logarithmic age (in years) in 50 equal steps from 5.1 to 10, and the decay times of 1, 3, 10, 30 and 100 times years. Each combination produced theoretical colors that were compared to the observed colors using the quadratic sum of differences, . This is different from by not having the rms noise in the denominator of each difference. The rms noise from observations is much less than the rms variation from model to model. The region masses were determined from the models for each case also, scaling the theoretical magnitude in F438W to the observed magnitude and using the masses tabulated for each population and age by Bruzual & Charlot (2003). We then picked as reasonable solutions those with the lowest , and among those took the averages of the masses, ages, extinctions and decay times using a weighting function of .
The metallicity measurements of Kiso 5639 by Sánchez Almeida et al. (2013) are 0.1 solar for the head and 0.2 solar for the tail, so the tabulated Bruzual models with a metallicity of 0.2 solar (Z=0.004) are reasonable. To determine how important metallicity was, solutions for the individual clusters were also found for solar and 0.4 solar metallicities. For the 21 head clusters, the log-masses were on average 4.2% and 1.5% smaller than our measurements for solar and 0.4 solar metallicity, their log-ages were 3.9% and 3.4% larger, their extinctions were 16.6% and 9.2% smaller, and their SFR decay log-times were less than 1% larger, respectively. These changes are small enough to ignore metallicity effects on the photometric analysis.
Star formation rates (SFRs) were determined from the continuum-subtracted H image for the large-scale regions. Taking into account the distance and the filter width (121 ), the luminosity is given by erg s-1 for apparent AB H magnitude, . 666The coefficient is for distance D, filter width , speed of light and wavelength . The SFRs were determined from yr-1 using the calibration from Kennicutt (1998).
IV. Results
IV.1. Masses, Ages, and Star formation rates
Table LABEL:tab2 lists the mass and age solutions from the photometry for the main large-scale star-forming clumps in the head and tail (regions in Figure 7), for the averages of all the individual clusters in the head and tail regions, for the interclump regions (), and for the averages of the filamentary protrusions on the periphery of the galaxy in the head (ellipse 1 in Figure 8) and in the tail (ellipses 2 - 9). The SFRs are the ratios of the photometric masses to the ages, the surface densities are the ratios of the masses to the areas used for the photometry, and the H luminosities and H SFRs are from the continuum-subtracted H filter, evaluated only for the large regions.
| Region | log Mass | log Age | log SFR | Surface density | L(H) | log SFR(H) |
|---|---|---|---|---|---|---|
| (M⊙) | (yr) | (M⊙ yr-1) | (M⊙ pc-2) | erg s-1 | (M⊙ yr-1) | |
| Main clumpsa,ba,bfootnotemark: : | ||||||
| a (head) | 6.2 | 5.7 | 0.43 | 7.8 | -1.2 | |
| b (tail) | 5.2 | 6.6 | -1.4 | 4.3 | -3.0 | |
| c (tail) | 5.0 | 5.8 | -0.7 | 2.9 | -3.0 | |
| d (tail) | 5.2 | 6.7 | -1.5 | 3.1 | -3.2 | |
| e (tail) | 5.6 | 7.5 | -1.9 | 3.0 | -2.8 | |
| ClustersccThe numbers in parentheses are the number of clusters (or complexes) measured in each region.: | ||||||
| a (head, 21) | 4.2 | 5.9 | -1.7 | 66 | ||
| b (tail, 10) | 3.7 | 7.0 | -3.3 | 23 | ||
| c (tail, 9) | 3.5 | 6.8 | -3.4 | 15 | ||
| d (tail, 9) | 3.5 | 6.7 | -3.3 | 16 | ||
| e (tail, 12) | 3.5 | 6.7 | -3.2 | 43 | ||
| InterclumpsddThe masses and ages for the interclump regions correspond to rectangles with areas of 255, 204, 270, and 609 pixels for f, g, h, and i, respectively. A constant star formation rate back to the indicated age was assumed.: | ||||||
| f | 5.2 | 8.9 | -3.7 | 26.3 | ||
| g | 4.9 | 9.0 | -4.0 | 18.2 | ||
| h | 5.3 | 9.1 | -3.8 | 29.8 | ||
| i | 5.6 | 9.1 | -3.5 | 28.3 | ||
| PeripheryeeA constant star formation rate back to the indicated age was assumed.: | ||||||
| 1 (head) | 4.6 | 5.8 | -1.2 | 8.7 | ||
| 2-10 (tail) | 4.5 | 7.6 | -3.1 | 5.8 |
Uncertainties for the solutions were determined from the three sources of uncertainty added in quadrature. The first is the dispersion in the best fit log-values for each cluster in a region. The second is the variation in the model results (in logarithms) among all of the individual solutions for each cluster that were combined with the weighting factor to give the best fit (see above). The third is the measurement error from the standard deviation of the image counts relative to the average counts in each region, summed in quadrature for each filter.
Extinction results are not given in the table but they average about 0.6-0.8 mag visual for all of the clusters in the head and tail. The average decay rate in the best fit cluster solutions is years, which is typically longer than the cluster age, meaning that the preferred SFRs are fairly constant.
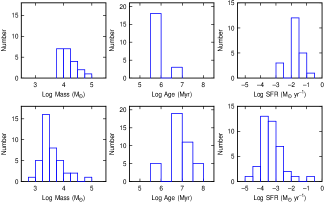
Figure 9 shows histograms for mass, age, and SFR for the 21 clusters in the head (top panels) and the 40 clusters in the 4 main clumps in the tail (regions ). The individual clusters in the head have average masses of , which is 3-6 times larger than those in the tail. The ages of the head clusters average yr, or about 7-12 times younger than in the tail.
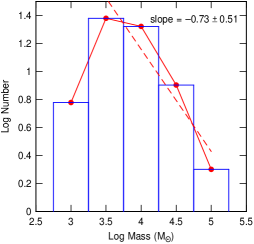
A histogram of mass for all 61 measured clusters is shown in Figure 10 with a power law fit at . The detection limit is . The slope of the mass function is on this log-log plot, which corresponds to a slope of in linear intervals of mass, i.e., . The error bars are the 90% confidence interval for a student t test with 4 degrees of freedom. The correlation coefficient is . This slope is typical for cluster mass functions (Larsen, 2009).
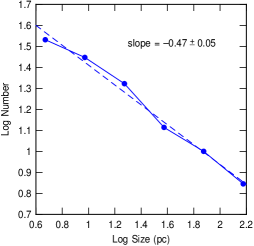
Star-forming regions in galaxies generally follow a hierarchical size distribution (Elmegreen, 2010). To check the size distribution of the star-forming regions in Kiso 5639, we used the IRAF task gauss to Gaussian blur the F336W image by five successive factors of two. Then the program SExtractor was used to identify and count sources in each of these Gauss-blurred images. The result is a count of regions larger than the blurring size. A plot of the log-count versus the minimum log-size is given in Figure 11. The power law distribution from 4 pc to 150 pc follows from the hierarchical structure; here the slope is . For 12 spiral and irregular galaxies in Elmegreen et al. (2014), a similar procedure gave slopes of to using the LEGUS Legacy ExtraGalactic UV Survey (Calzetti et al., 2015). A shallow slope, like that found here, means that star formation is spread out somewhat uniformly. This is reasonable from Figure 4, where the main star-forming regions are spread broadly across the galaxy.
IV.2. Tadpole Intrinsic Shape
The three-dimensional structure of Kiso 5639 is not easily determined from its projected shape, but the optical spectrum implies rotation (Sánchez Almeida et al., 2013). The F814W image also shows what may be a faint underlying disk, especially in the logarithmic stretch in Figure 4. Based on the assumption that the main disk is intrinsically round, we measured the outer isophotes of the major and minor axes of the F814W image to determine the orientation and inclination. The images were then rotated in IRAF by -9.3∘ using the task rotate and stretched by a factor of 2.67 (corresponding to an inclination of 68∘ for a thin disk) using the task magnify. Figure 12 shows the deprojected color composite image for the galaxy using F438W (blue), F547M (green), and F81W (red) images. The head region is round in the inclined view and elongated in the deprojected view. The projected roundness suggests that the head is more three-dimensional like a sphere than two-dimensional like a circle in the plane. Disk thickness elsewhere will cause another distortion, with one side of the minor axis showing slightly more stars from the back side of the disk and the other side showing slightly more from the front side. If we correct the apparent inclination, , for an intrinsic ratio of thickness to diameter equal to 0.2 using the equation from Sánchez-Janssen et al. (2010), then the true inclination is .
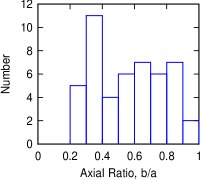
The assumption of a circular disk for the whole galaxy is reasonable considering axial ratios for one-clump galaxies in the Kiso sample of UV bright galaxies (Miyauchi-Isobe, Maehara, & Nakajima, 2010). If tadpoles are highly inclined disk galaxies, there should be face-on versions of tadpoles that have one dominant star-forming clump in a round disk. Kiso galaxies labeled as I,c and I,g are galaxies identified as having one or several main clumps. There are 159 of these galaxies in the Sloan Digital Sky Survey (SDSS), which we examined to select one-clump galaxies. Some galaxies in these lists were clearly spiral or interacting, and were excluded. Of the remainder, 48 had one main clump, and 44 had several main clumps; some of the one-clump dominant galaxies were in the I,g category.
A histogram of the isophotal axial ratios for the 48 one-clump galaxies is shown in Figure 13. The distribution is fairly flat over most of the range, except for a spike at an axial ratio of 0.35. This flatness means that most one-clump galaxies are approximately circular disks seen in random projections with tadpoles representing the edge-on cases (compare to similar distributions for clumpy galaxies in Elmegreen et al., 2005a, b). The spike suggests that a small fraction of one-clump galaxies may be intrinsically elongated. For example, the galaxy I Zw 18 is an apparent tadpole composed of one large clump of star formation in a main body with a smaller one to the south in the same old-stellar envelope, and a third clump to the north, somewhat detached; it appears to be intrinsically elongated. The drop-off in the distribution of axial ratios below 0.2 in the figure is presumably the ratio of disk thickness to diameter. Small galaxies like this tend to be relatively thick (Elmegreen et al., 2005b; Sánchez-Janssen et al., 2010; Elmegreen & Hunter, 2015).
IV.3. Star-forming Head
IV.3.1 Star Formation and Ionization Rates
The H luminosity of the central diameter region of the head (360 pc) is 8.0x1039 erg s-1 according to the SDSS spectrum (Elmegreen et al., 2012). For the HST observations, the H luminosity of a core rectangular region centered on the head is erg s-1. This H luminosity is determined from the continuum-subtracted F657N H image, which comes from the H filter width, , multiplied by the difference between the F657N intensity and the F547M intensity used for the continuum, and then multiplied by (see footnote 6 above). For reference, the continuum-subtracted H apparent AB magnitude of the head is . The size of this region is effectively , calculated as the square root of the number of pixels in the rectangle multiplied by the pixel size. Assuming the conversion in equation (2) of Kennicutt (1998), the head luminosity from HST H corresponds to a SFR of yr-1, which gives the log value of in Table 2.
The SFR determined from the ratio of the head region’s photometric mass to its photometric age, yr-1, is much larger than the H rate. One reason for this may be that the photometric ages are too young compared to the overall duration of star formation in the region. This could be the result of a dominance by the youngest massive stars in the ultraviolet bands, or from patchy dust that preferentially obscures older stars. There could also be a component of H that is obscured or too extended to see in our data. Extinction has an important effect on the inferred photometric SFR. Higher extinction requires more stellar mass to give the same brightness, and a younger age to give the same color, and the combined effect pushes up the SFR. Varying the extinction in our models from 0 to 1 magnitude in the visible band increases the total photometric SFR for the 21 clusters in the head from yr-1 to yr-1. The average cluster value in Table 2, per cluster, corresponds to a total for all 21 clusters of yr-1, in the middle of this range and consistent with the average extinction that we find for these clusters, which is 0.65 mag. We do not derive the SFR based solely on the FUV flux because that method needs to assume a star formation history, such as a constant rate. In what follows, we use the SFR from the H.
For typical recombination in a photoionized region, the Lyman continuum photon ionization rate, , in photons s-1, is proportional to the H luminosity in erg s-1 according to the conversion , again using equation (2) in Kennicutt (1998). This implies the ionization rate is photons s-1. For an ionization rate from an O9 star of s-1 (Vacca et al., 1996), the head of Kiso 5639 contains O9 stars.
The summed mass of the 21 measured clusters in the head region is . Considering a Chabrier IMF in the 0.2 solar metallicity models by Bruzual & Charlot (2003), such a mass of young stars at 1 Myr age would be expected to have an ionization rate of s-1; at 3 and 10 Myr, that would be and times s-1, respectively. The rate for the 1 Myr age is about 30% of what we observe. Alternatively, we can integrate an IMF that is flat below and a power law with the Salpeter slope of above to , and normalize it to the same total cluster mass. This gives stars more massive than , the mass of an O9 star (Vacca et al., 1996); that is % of the number obtained from the total ionization rate. These fractions imply that 30%-40% of the O stars in the head of Kiso 5639 are in clusters; the rest are presumably between the clusters.
IV.3.2 Ionization and Confinement of the Head Hii Region
If the full diameter of the head, pc, is the diameter of a Strömgren sphere formed by ionization at the inferred rate of photons s-1, then the rms electron density is cm-3, assuming a recombination coefficient cm3 s-1. At a temperature K, the corresponding pressure would be for Boltzmann’s constant .
We are interested in whether this pressure is too large for the galaxy to retain the gas. If the pressure exceeds the self-gravitational pressure from the weight of the disk, then the Hii region will expand. For the observed H line half-width of km s-1 (Sánchez Almeida et al., 2013), the expansion time over the radius of 415 pc is only Myr. A recent WIYN telescope spectrum taken by one of us (JSG) suggests that the H line is km s-1, which would make the expansion time 14 Myr. These high linewidths for the ionized gas also suggest that the Hii region pressure is larger than from the thermal motions alone. Gas with a density of cm-3 for hydrogen mass , mean atomic weight , and turbulent speed km s-1 has a pressure .
The self-gravitational pressure in a disk is approximately for total mass surface density , which consists of stars, gas, and some dark matter (Elmegreen, 1989). The average surface density of old stars in the interclump regions is pc-2, as obtained from SED fitting (Table LABEL:tab2). This is about the same as the surface density obtained from the galaxy dynamical mass, (Section II) spread out over the galaxy diameter of 2.7 kpc, assuming the galaxy is a circular disk. That result is pc-2, although it probably includes an amount of dark matter comparable to the stellar mass. The SED mass of the head without the background interclump emission subtracted (as it is in Table 1), is inside the area measured (8085 square pixels or pc2). This gives a total stellar surface density of pc-2 in the head region. The dynamical mass in the 130 pc diameter core of the head measured from the H velocity gradient (Sánchez Almeida et al., 2013) is . This suggests a surface density of pc-2, which is much larger than the photometric surface density. The difference could be the result of a component in the H velocity gradient that is caused by pressure forces, rather than gravity, or it could indicate a dense dark mass in this region, perhaps from a molecular cloud.
The photometric surface densities are within a factor of of the total mass surface density that would be needed to make the dynamical pressure equal to the Hii region thermal pressure, which is pc-2. For the Hii region turbulent pressure of , the total mass surface density needed for binding is pc-2. The dynamical surface density of pc-2 is more than enough to confine the Hii region.
The SFR determined from H is yr-1 for the square core (430 pc) measured in the head. This gives a rate per unit area of pc-2 Myr-1. This rate exceeds an empirically determined limit for the formation of a superwind (Heckman, 2002), which is pc-2 Myr-1, making it plausible that the HII region or hot gases associated with it are not bound to the galaxy.
IV.3.3 Enhanced Star Formation Rates
An estimate for the molecular gas surface density may be made from the product of and the typical molecular gas consumption time, which is Gyr in normal galaxy disks (Bigiel et al., 2008; Leroy et al., 2008) and the outer regions of spiral galaxies, as obtained by stacking CO spectra when the individual regions are too faint to see (Schruba et al., 2011). For pc-2 Myr-1 calculated above, the associated molecular surface density would be pc-2. This is comparable to the dynamical surface density of pc-2 (Sect. IV.3.2). Atomic gas would increase this gas surface density even more. Possibly, the consumption time is shorter than the canonical value; Myr would allow pc-2 for the observed SFR surface density. This short consumption time would place the head of Kiso 5639 a factor of above the normal Kennicutt-Schmidt relation between star formation surface density and gas surface density, and in the ULIRG regime (e.g., Sargent et al., 2014).
Enhanced SFRs per unit gas mass can also be inferred from our previous observations of 10 XMP galaxies (Sánchez Almeida et al., 2015). There we derived a ratio of for metallicity in the starburst compared to the host, and a factor of for the star formation surface density enhancement. For the present galaxy, Kiso 5639, and (Sánchez Almeida et al., 2013). Simulations by Ceverino et al. (2016) obtain similar factors. These factors place constraints on the relative efficiency of star formation in the burst and on the previous metallicity of the cosmic gas relative to the host, written as the factor . We assume that the starburst region contains gas column density contributions from the cosmic cloud, , and from the host, , in some ratio . Then
| (1) |
We also assume that the SFR scales with gas column density to a power but has an additional efficiency enhancement factor in the starburst compared to the host. Then
| (2) |
For the Kennicutt-Schmidt relation with total gas, (Kennicutt & Evans, 2012). Setting and as for Kiso 5639 and the galaxies in Sánchez Almeida et al. (2015), we find that if there is no enhancement in efficiency () then the accreted gas surface density factor is and the ratio of accreted metallicity to host metallicity is . These numbers decrease as the enhancement increases: for to 10, to 1.5, and to 0.005. Unless the accreted gas surface density is significantly higher than the host gas surface density (i.e., unless is large), the enhancement above the normal KS relation () has to be high and the relative metallicity of the accreted gas () has to be low.
The dense parts of individual molecular clouds (Lada et al., 2010) have relatively short consumption times like the small values implied by large (the relative consumption time is inversely proportional to ), but usually observations on large scales like the pc head region of Kiso 5639 have the canonical Gyr and no enhanced star formation (i.e., , Bigiel et al., 2008; Leroy et al., 2008). We conclude that the accretion of an amount of low metallicity gas comparable to or a few times larger than the previous gas column density in the disk triggered a substantial burst star formation with a relative short gas consumption time.
IV.3.4 Head Formation by Gravitational Instability
The largest star formation complexes in many galaxy disks form by gravitational instabilities in the turbulent interstellar medium. We are interested in whether the expected size and mass of a region formed this way match the tadpole head in Kiso 5639. The characteristic mass for an instability depends on the gas velocity dispersion and the disk column density. For a cosmological context with active accretion, Ceverino et al. (2010) suggest that the clump mass, , formed by such an instability is related to the disk mass, , as where and is the total disk mass out to the radius of the clump. They also suggest the clump radius is .
For Kiso 5639, the head region could be a clump that formed by a gravitational instability after fresh gas accreted in this part of the galaxy. To compare the observations with this theoretical prediction, the clump mass is taken to be twice the total SED mass of the head measured without interclump background subtraction, or . The factor of 2 accounts for gas that we do not detect. The disk mass is assumed to be half of the dynamical mass because of dark matter contributing to the rotation curve; then and . Thus, the theory in Ceverino et al. (2010) predicts that , and the observations agree, with . Also for , the theory predicts that the clump size is 25% of the galaxy size, and that is also about right for the head.
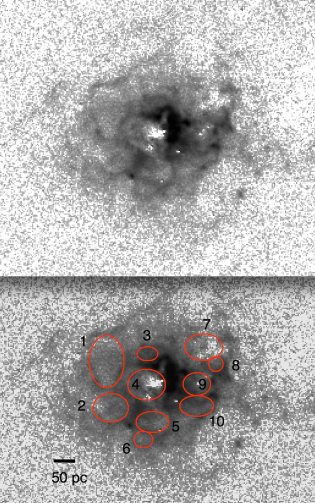
IV.3.5 Holes and Feedback in the Head Hii region
Holes are identified in the continuum-subtracted H image as low emission regions surrounded by ring-like structures. The holes evident in Figure 14 (top) are marked by red ellipses in the bottom panel. They span diameters of 28 to 100 pc, as listed in Table 3. Hydrodynamic calculations of supergalactic winds show that holes and filamentary structures can develop in the presence of a high concentration of super star clusters, such as those observed in M82 (Tenorio-Tagle, Silich, & Muñoz-Tuñón, 2003). The holes and filaments in Kiso 5639 could have the same origin.
| Number | RA | Dec | x diameter | y diameter | x diameter | y diameter |
|---|---|---|---|---|---|---|
| (J2000) | J2000 | ” | ” | pc | pc | |
| 1 | 11:41:07.700 | +32:25:37.70 | 0.57 | 0.85 | 67.5 | 100.9 |
| 2 | 11:41:07.689 | +32:25:36.20 | 0.57 | 0.47 | 67.6 | 55.6 |
| 3 | 11:41:07.596 | +32:25:37.95 | 0.34 | 0.23 | 40.0 | 27.0 |
| 4 | 11:41:07.598 | +32:25:36.94 | 0.61 | 0.50 | 72.7 | 59.4 |
| 5 | 11:41:07.583 | +32:25:35.74 | 0.53 | 0.34 | 63.5 | 40.9 |
| 6 | 11:41:07.606 | +32:25:35.17 | 0.31 | 0.27 | 36.9 | 32.1 |
| 7 | 11:41:07.451 | +32:25:38.16 | 0.61 | 0.43 | 72.9 | 51.2 |
| 8 | 11:41:07.420 | +32:25:37.61 | 0.23 | 0.24 | 27.8 | 28.3 |
| 9 | 11:41:07.469 | +32:25:36.97 | 0.45 | 0.37 | 53.4 | 44.2 |
| 10 | 11:41:07.469 | +32:25:36.26 | 0.55 | 0.34 | 65.3 | 40.2 |
The cavities in the head of Kiso 5639 could form by a combination of stellar winds and supernovae, depending on the age. Stellar winds would have to dominate if this is a very young region, as suggested by the photometry. With an ambient density of 1 atom cm-3 as calculated above for the Hii region, the wind luminosity , in units of ergs s-1, and the wind duration , in units of one million years, that are required to make a wind-swept bubble 50 pc in radius satisfy the product , according to equation (6) in Castor et al. (1975). An O9 star with solar metallicity has a mass loss rate of and wind speed of km s-1 (Martins, 2015), so . The mass loss rate decreases with metallicity as (Martins, 2015), where for the head of Kiso 5639, making . Thus, an equivalent of O9 stars would be needed for each large bubble. An O5 star has about 100 times the mass loss rate of an O9 star (Martins, 2015), so 40 equivalent O5 stars would be needed to evacuate the cavities with stellar winds alone. These numbers of O stars produce between and ionizing photons s-1, respectively (Vacca et al., 1996), which is consistent with the observed rate of ph s-1.
Multiple supernovae should help clear the cavities if the age is older than a few Myr. If we consider that a single supernova deposits a mechanical energy of 1 to 10 ergs to the surrounding gas (assuming 1% to 10% efficiency, Walch & Naab, 2015), and that the supernova rate is supernovae per million years, then the average supernova mechanical luminosity is erg s-1 or . Setting this to for a 1 million year duration in the Castor et al. solution above, we get a number of supernova equal to 8-80 to make a 100 pc diameter bubble in that time. For a 3 Myr duration, the number is smaller by . These are reasonable numbers if the duration of star formation is long enough to have had supernovae.
The hole morphology of the head region and the peripheral wispy H emission are similar in appearance to the holes and wisps in I Zw 18 (see Figs. 1 and 2 in Hunter & Thronson, 1995). I Zw 18 is one of the lowest metallicity local galaxies (Searle & Sargent, 1972; Izotov et a., 2009). Our estimates for supernovae clearing in Kiso 5639 are consistent with similar conclusions about star formation in I Zw 18 based on HST WFPC2 images (Hunter & Thronson, 1995; Annibali et al., 2013; Lebouteiller et al., 2013).
Supernova clearing of cavities may also lead to gas expulsion from the whole galaxy. Many of the shells in Figure 14 appear to be broken around the periphery of the head, suggesting a release of hot gas into the halo. Considering the low escape speed from this galaxy, km s-1 (Sánchez Almeida et al., 2013), and the high thermal speed of a K supernova cavity, km s-1, localized break out from the head should mean that a sizeable fraction of the cavity gas escapes from the disk region. This gas should ultimately become enriched with heavy elements, and if the escaping gas is preferentially enriched, then the metallicity in the remaining gas and stars can remain small. This is in accord with current models for the origin of the mass-metallicity relation in galaxies (e.g., Peeples & Shankar, 2011; Davé et al., 2012; Lilly et al., 2013; Fu et al., 2013).
IV.3.6 Clustering Fraction of Star Formation
There are two indications that a high fraction of star formation in the head of Kiso 5639 is clustered, rather than dispersed. The first was mentioned above, namely that the summed mass of the measured clusters, , produces 30%-40% of the H flux that is observed.
The second indication comes from the summed cluster masses in the head relative to the total young stellar mass in the head, which is (Table LABEL:tab2. The ratio is 25%, but this ignores smaller clusters. We can integrate over the cluster mass function below the detection limit to include those smaller clusters. The cluster mass function is from Section IV.1. We normalize this to the total count by setting the number greater than equal to the observed number of 14. This gives . Then the total integral of cluster mass from a lower limit of to is . This can be added to the observed mass above , which is , to give a total estimated cluster mass above of . This total is 45% of the young stellar mass.
The high fraction of clustering in the head of Kiso 5639 is inconsistent with the general lack of clusters in dwarf Irregular galaxies of the same total mass (Billett et al., 2002), but comparable to the clustering fraction in other starburst dwarfs like NGC 1569 and IC 1705, and in massive active and interacting galaxies (Adamo et al., 2015; Adamo & Bastian, 2015). High clustering suggests high pressures (Kruijssen et al., 2012), and highlights the peculiar nature of the head region studied here.
There are 8 clusters within 50 pc of the center of the head, so the mean separation in 3D between them is about pc. The IRAF task imexamine was used to measure the radial profiles of the central clusters to determine their radii at half maximum intensity. This radius averaged 2 px, which is essentially the resolution limit, so the maximum diameter of the central clusters is pc. Thus, the volume filling fraction of the clusters is %. These clusters have a total mass of , giving a mass density in the central 50 pc of pc-3, which is equivalent to 14 atoms cm-3.
We can compare the density of young clusters in Kiso 5639 with other starburst galaxies. In the densest clustered region of M82, there are 86 clusters in a 242x242 pc2 area, which is 1470 clusters per kpc2; in NGC 253, the peak projected cluster density is 113 per kpc2 (Melo et al., 2005). In Kiso 5639, the 8 clusters in 50x50 pc2 corresponds to 3200 per kpc2, which is twice that in M82. So the central region of Kiso 5639 has a high cluster density. However, the cluster masses in Kiso 5639 are not as large as in M82 where 3 clusters of each are within 25 pc or each other (Westmoquette et al., 2014), giving a combined mass density of pc-3.
IV.4. Associated HI gas
The only Hi data available for Kiso 5639 are at low resolution. In an Arecibo Hi survey of star-forming dwarfs, there is a detection near Kiso 5639 with , where the mass is given in (Salzer et al., 2002). The HIJASS survey from the Lovell telescope, with a beamsize of 12 arcmin, had a detection in the region of Kiso 5639 in a common Hi halo that included dwarf galaxies Mrk 0746, Was 28, and SDSSJ114135.98+321654.0, with (Wolfinger et al., 2013). The total Hi mass can be attributed to one, some, or all of these galaxies. The Hi halo shows a small extension to the Northwest, in the direction of Kiso 5639. There is no optical evidence that these galaxies are interacting.
In the 45 arcsec resolution NRAO VLA Sky Survey (NVSS) by Condon et al. (1998), there is a 21 cm radio continuum detection with a flux of 2.7 mJy slightly southwest of the optical position of Kiso 5639 (the star-forming head). The diffuse nature of the weak emission indicates that it is likely related to star formation. It is possible that the Hi emission is a reservoir from which accreted gas is stimulating the current star formation.
If the Lyman continuum escape fraction from the star-forming head were comparable to that estimated for Ly emitting galaxies, which is 25% or more (Blanc et al., 2011; Zheng et al., 2012), then the ionization rate in the surrounding gas would be s-1, based on the observed rate inside the head of s-1 given above. The Strömgren radius for this ionization could extend to 1 kpc if the average peripheral density is cm-1. This kpc extent would subtend an angle of in all directions and be easily observed; it is 3/4 of the radius of the galaxy. The only evidence for peripheral ionization that we see in Figures 2 and 3 is the system of filaments extending away from the body of the galaxy. Their lengths are typically or 150-250 pc.
On the other hand, recent estimates of the Lyman continuum escape fraction for low mass star-forming galaxies at z based on HST grism spectroscopy plus GALEX FUV indicate escape fractions of less than 2% (Rutkowski et al., 2016), which would not be sufficient to illuminate external gas.
V. Conclusions
HST WFC3 observations of the local metal-poor galaxy Kiso 5639 show a large star-forming region 830 pc in diameter with 21 clusters of average mass and an H SFR of yr-1. The overall galaxy appears to be a rotating disk with an inclination of (depending on thickness), but the star-forming region at one end makes it look like a tadpole or comet. Older and less massive clusters are in four other regions in the tail.
The metallicity in the large starburst region was previously found to be about 40% of that in the rest of the galaxy, suggesting that the burst occurred in recently accreted low-metallicity gas. A reservoir of HI associated with the galaxy has a mass comparable to the dynamical mass in the optical disk. This HI could be the source of the accreting gas, or both the HI and the galaxy disk could be accreting together from a common extragalactic source.
The properties of the burst region indicate an unusual, high pressure event. The gas depletion time is shorter than in spiral galaxies by a factor of , depending on the accreting mass, and the clustering fraction of star formation is high, %. H observations show 10 cavities in the tadpole head with sizes of 20-100 pc, which could each arise from many dozens of supernovae over a period of several Myr. The perimeter of the galaxy shows broken H shells and filamentary structures that include some star formation.
We conclude that the accretion of an amount of low metallicity gas that is comparable to or a few times larger than the previous gas column density in the disk of the low-metallicity dwarf galaxy Kiso 5639 triggered a substantial burst of star formation in one localized region, and that star formation there has a relative short gas consumption time and a high clustering fraction.
Acknowledgments: We thank NASA and STScI for observing time and grant support. DME is supported by HST-GO-13723.002-A and BGE is supported by HST-GO-13723.001-A; both are grateful to the Severo Ochoa and Jesús Serra Foundation for support during a visit to the Instituto de Astrofísica de Canarias. The work of JSA, CMT, and MF has been partly funded by the Spanish Ministry of Economy and Competitiveness, project AYA2013-47742-C4-2-P. JMA acknowledges support from the European Research Council Starting Grant (SEDmorph; P.I. V. Wild). MR acknowledges support from an appointment to the NASA Postdoctoral Program at Goddard Space Flight Center. DC acknowledges support from the European Research Council Advanced Grant (STARLIGHT; P.I. Ralf Klessen) This research has made use of the NASA/IPAC Extragalactic Database (NED) which is operated by the Jet Propulsion Laboratory, California Institute of Technology, under contract with the National Aeronautics and Space Administration.
References
- Adamo et al. (2015) Adamo, A., Kruijssen, J. M. D., Bastian, N., Silva-Villa, E., & Ryon, J. 2015, MNRAS, 452, 246
- Adamo & Bastian (2015) Adamo A., & Bastian N., 2015, in The Birth of Star Clusters, ed. Stahler S.W., Springer, arXiv151108212
- Annibali et al. (2013) Annibali, F., Cignoni, M., Tosi, M., van der Marel, R., Aloisi, A., Clementini, G., Contreras Ramos, R., Fioentino, G., Marconi, M., & Musella, I. 2013, AJ, 146, 144
- Bigiel et al. (2008) Bigiel, F., Leroy, A., Walter, F., Brinks, E., de Blok, W. J. G., Madore, B., & Thornley, M. D. 2008, AJ, 136, 2846
- Billett et al. (2002) Billett, O.H., Hunter, D.A., Elmegreen, B.G. 2002, AJ, 123, 1454
- Blanc et al. (2011) Blanc, G. Adams, J., Gebhardt, K., et al. 2011, ApJ, 736, 31
- Bruzual & Charlot (2003) Bruzual, G., & Charlot, S. 2003, MNRAS, 344, 1000
- Cairós et al. (2001) Cairós, L., et al. 2001b, ApJS, 136, 393
- Calzetti et al. (2000) Calzetti, D., Armus, L., Bohlin, R.C., Kinney, A.L., Koornneef, J., & Storchi-Bergmann, T. 2000, ApJ, 533, 682
- Calzetti et al. (2015) Calzetti, D., Lee, J., Sabbi, E., Adamao, A., et al. 2015, AJ, 149, 51
- Castor et al. (1975) Castor, J., McCray, R. & Weaver, R. 1975, ApJ, 200, L107
- Ceverino et al. (2010) Ceverino, D., Dekel, A. Bournaud, F. 2010, MNRAS, 404, 2151
- Ceverino et al. (2016) Ceverino, D., Jorge Sánchez Almeida, J., Muñoz-Tuñón, C., Dekel, A., Elmegreen, B.G., Elmegreen, D.M., & Primack, J. 2016, MNRAS, 457, 2605
- Condon et al. (1998) Condon, J., Cotton, W., Greisen, E., Yin, Q., Perley, R., & Broderick, J. 1998, AJ, 115, 1693
- Davé et al. (2012) Davé, R., Finlator, K., & Oppenheimer, B. D. 2012, MNRAS, 421, 98
- Elmegreen (1989) Elmegreen, B.G. 1989, ApJ, 338, 178
- Elmegreen et al. (2005a) Elmegreen, B.G., Elmegreen, D.M., 2005, ApJ, 627, 632
- Elmegreen (2010) Elmegreen, B.G. 2010, in IAUS266, Star clusters: basic galactic building blocks throughout time and space, ed. R. de Grijs and J. Lepine, Cambridge University Press, p.3
- Elmegreen & Elmegreen (2010) Elmegreen, B. G., & Elmegreen, D. M. 2010, ApJ, 722, 1895
- Elmegreen & Hunter (2015) Elmegreen, B.G., & Hunter, D.A. 2015, ApJ, 805, 145
- Elmegreen et al. (2005b) Elmegreen, D.M., Elmegreen, B.G., Rubin, D.S., & Schaffer, M.A. 2005, ApJ, 631, 85
- Elmegreen et al. (2014) Elmegreen, D.M. Elmegreen, B.G., Adamo, A., Aloisi, A., Andrews, J., Annibali, F., Bright, S., Calzetti, D., Cignoni, M., Evans, A., Gallagher, J., Gouliermis, D., Grebel, E., Hunter, D., Johnson, K., Kim, H., Lee, J., Sabbi, E., Smith, L., Thilker, D., Tosi, M., & Ubeda, L. 2014, ApJL, 787, L15
- Elmegreen et al. (2012) Elmegreen, D.M., Elmegreen, B.G., Sańchez Almeida, J., Muñoz-Tuñón, C., Putko, J., & Dewberry, J. 2012, ApJ, 750, 95
- Elmegreen et al. (2007) Elmegreen, D. M., Elmegreen, B. G., Ravindranath, S., & Coe, D. A. 2007, ApJ, 658, 763
- Elmegreen et al. (2005) Elmegreen, D. M., Elmegreen, B. G., Rubin, D. S., & Schaffer, M. A. 2005, ApJ, 631, 85
- Filho et al. (2015) Filho, M. E., Sańchez Almeida, J., Muñoz-Tuñón, C. et al. 2015, ApJ, 802 82
- Filho et al. (2015) Filho, M. E., Sańchez Almeida, J., Muñoz-Tuñón, C., Elmegreen, B., & Elmegreen, D. 2015, ApJ, submitted
- Filho et al. (2013) Filho, M., Winkel, B., Sańchez Almeida, J., Aguerri, J., Amorin, R., Ascasibar, Y., Elmegreen, B., Elmegreen D., Gomes, J., Humprey, A., Lagos, P., Morales-Luis, A., Muñoz-Tuñón, C., Papaderos, P., & Vilchez, J. 2013, A&A, 558, 18
- Fu et al. (2013) Fu, J., Kauffmann, G., Huang, M.-l., et al. 2013, MNRAS, 434, 1531
- Gil de Paz, Madore, & Pevunova (2003) Gil de Paz, A., Madore, B. F., & Pevunova, O. 2003, ApJS, 147, 29
- Heckman (2002) Heckman, T. 2002, in Extragalactic Gas at Low Redshift, ASP Conference Proceedings Vol. 254. Edited by John S. Mulchaey and John Stocke. San Francisco: ASP, p.292
- Huang et al. (2013) Huang, M-L., Kauffmann, G., Chen, Y.-M., Moran, S.M., Heckman, T.M., Davé, R., Johansson, J. 2013, MNRAS, 431, 2622
- Hunter & Thronson (1995) Hunter, D., & Thronson, H. 1995, ApJ, 452, 238
- Izotov et a. (2009) Izotov, Y.I., Guseva, N., Fricke, K., & Papderos, P. 2009, A&A, 503, 61
- Kennicutt (1998) Kennicutt, R., C. 1998, ARAA, 36, 189
- Kennicutt & Evans (2012) Kennicutt, R.C., & Evans, N.J. 1 2012, ARA&A, 50, 531
- Kniazev et al. (2001) Kniazev, A. Y., Pustilni, S. A., Ugryumov, A. V., & Pramsky, A. G. 2001, A&A, 371, 404
- Kruijssen et al. (2012) Kruijssen, J. M. D. 2012, MNRAS, 426, 3008
- Lada et al. (2010) Lada, C.J., Lombardi, M., & Alves, J.F. 2010, ApJ, 724, 687
- Larsen (2009) Larsen, S. S. 2009, A&A, 494, 539
- Lebouteiller et al. (2013) Lebouteiller, V., Heap, S., Hubeny, I., & Kunth, D. 2013, A&A, 553, A16
- Leitherer et al. (2002) Leitherer, C., Li, I.-H., Calzetti, D., Heckman, T.M. 2002, ApJS, 140, 303
- Leroy et al. (2008) Leroy, A.K., Walter, F., Brinks, E., Bigiel, F., de Blok, W. J. G., Madore, B., & Thornley, M. D. 2008, AJ, 136, 2782
- Lilly et al. (2013) Lilly, S. J., Carollo, C. M., Pipino, A., Renzini, A., & Peng, Y. 2013, ApJ, 772, 119
- Loose & Thuan (1985) Loose, H.-H., & Thuan, T. X. 1985, in Star-Forming Dwarf Galaxies and Related Objects, ed. D. Kunth, T. X. Thuan, and J. T. T. Vân (Gif-sur-Yvette: Edition Frontières), 73
- MacKenty & Smith (2012) MacKenty, J. W. & Smith, L. 2012, CTE White Paper, Tech. rep., STScI
- Markarian (1969) Markarian, B. E. 1969, Astrofizika, 5, 206
- Martins (2015) Martins, F. 2015, in SF2A-2015: Proceedings of the Annual meeting of the French Society of Astronomy and Astrophysics. Eds.: F. Martins, S. Boissier, V. Buat, L. Cambrésy, P. Petit, Société Francaise d’Astronomie et d’Astrophysique, pp.343-348
- Mastropietro et al. (2009) Mastropietro, C., Burkert, A., & Moore, B. 2009, MNRAS, 399, 2004
- Melo et al. (2005) Melo, V., Muñoz-Tuñón, C., Maíz-Appelániz, J., & Tenorio-Tagle, G. 2005, ApJ, 619, 270
- Miyauchi-Isobe, Maehara, & Nakajima (2010) Miyauchi-Isobe, N., Maehara, H., & Nakajima, K. 2010, Pub.Nat.Astro.Ob.Japan, 13, 9
- Morales-Luis et al. (2011) Morales-Luis, A. B., Sánchez Almeida, J., Aguerri, J. A. L. & Muñoz-Tuñón, C. 2011, astro-ph arXiv:1109.0235v1
- Noeske et al. (2000) Noeske, K., Guseva, N., Frick, K., Izotov, Y., Papaderos, P., & Thuan, T. 2000, A&A, 361, 33
- Rafelski et al. (2015) Rafelski, M., Teplitz, H. I., Gardner, J. P., et al. 2015, AJ, 150, 31
- Papaderos et al. (2008) Papaderos, P., Guseva, N. G., Izotov, Y. I., & Fricke, K. J. 2008, A&A, 491, 113
- Peeples & Shankar (2011) Peeples, M. S. & Shankar, F. 2011, MNRAS, 417, 2962
- Pérez-Montero (2014) Pérez-Montero, E. 2014, MNRAS, 441, 2663
- Rafelski et al. (2015) Rafelski, M., Teplitz, H., Gardner, J., Coe, D., et al. 2015, AJ, 150, 31
- Rutkowski et al. (2016) Rutkowski, M., Scarlata, C., Haardt, F., Siana, B., Rafelski, M., et al. 2016, ApJ, 819, 81
- Salzer et al. (2002) Salzer, J., Rosenberg, J., Weisstein, E., Mazzarella, J., & Bothun, G. 2002, AJ, 124, 191
- Sánchez Almeida et al. (2013) Sánchez Almeida, J., Muñoz-Tuñón, C. Elmegreen, D., Elmegreen, B., & Mendez-Abreu, J. 2013, ApJ, 767, 74
- Sánchez Almeida et al. (2014a) Sánchez Almeida, J. Morales-Luis, A.B., Muñoz-Tuñón, C., Elmegreen, D.M., Elmegreen B.G., & Mendez-Abreu, J. 2014a, ApJ, 783, 45
- Sánchez Almeida et al. (2014b) Sánchez Almeida, J., Elmegreen, B.G., Muñoz-Tuñón, C. & Elmegreen, D.M. 2014b, A&AR, 22, 71
- Sánchez Almeida et al. (2015) Sánchez Almeida, J. Elmegreen, B.G., Munoz-Tunon, C., Elmegreen D.M., Perez-Montero, E., Amorin, R., Filho, M.E., Ascasibar, Y., Papaderos, P., & Vilchez, J.M. 2015, ApJL, 810L, 15
- Sánchez-Janssen et al. (2010) Sánchez-Janssen, R., Méndez-Abreu, J., Aguerri, J. A. L. et al. 2010, MNRAS, 406, 65
- Sargent et al. (2014) Sargent, M. T., Daddi, E., Béthermin, M., et al. 2014, ApJ, 793, 19
- Schruba et al. (2011) Schruba, A., Leroy, A. K., Walter, F., et al. 2011, AJ, 142, 37
- Searle & Sargent (1972) Searle, L., & Sargent, W. 1972, ApJ, 173, 25
- Straughn et al. (2006) Straughn, A. N., Cohen, S. H., Ryan, R. E., Hathi, N. P., Windhorst, R. A., & Jansen, R. A. 2006, ApJ, 639, 724
- Tenorio-Tagle, Silich, & Muñoz-Tuñón (2003) Tenorio-Tagle, G., Silich, S., & Muñoz-Tuñón, C. 2003, ApJ, 597, 279
- Vacca et al. (1996) Vacca, W.D., Garmany, C.D., & Shull, J.M. 1996, ApJ, 460, 914
- van den Bergh et al. (1996) van den Bergh, S., Abraham, R. G., Ellis, R. S., Tanvir, N. R., Santiago, B. X., & Glazebrook, K. G. 1996, AJ, 112, 359
- Verbeke et al. (2014) Verbeke, R., De Rijcke, S., Koleva, M., et al. 2014, MNRAS, 442, 1830
- Walch & Naab (2015) Walch, S., & Naab, T. 2015, MNRAS, 451, 2757
- Westmoquette et al. (2014) Westmoquette, M. S., Bastian, N., Smith, L. J., Seth, A. C., Gallagher, J. S., III, O’Connell, R. W., Ryon, J. E., Silich, S., Mayya, Y. D., Muñoz-Tuñón, C., & Rosa González, D. 2014, ApJ, 789, 94
- Windhorst et al. (2006) Windhorst, R. A. et al. 2006, New Astron. Rev., 50, 821
- Wolfinger et al. (2013) Wolfinger, K., Kilborn, V., Koribalski, B., Minchin, R., Boyce, P., Disney, M., Lang, R., & Jordan, C. 2013, MNRAS, 428, 1790
- Zheng et al. (2012) Zheng, Z.-Y., Malhotra, S., Wang, J.-X., Rhoads, J. et al. 2012, ApJ, 746, 28