epartment of Physics and Astronomy, University of Nebraska-Lincoln, Lincoln, Nebraska, USA \PACSes \PACSit14.65.Hatop quarks \PACSit13.88.+epolarization in interactions and scattering \PACSit12.38.Qkexperimental tests of quantum chromodynamics \PACSit13.85.-thadron-induced high- and super-high-energy interactions
Top Production at the Tevatron: The Antiproton Awakens
Abstract
A long time ago, at a laboratory far, far away, the Fermilab Tevatron collided protons and antiprotons at TeV. The CDF and D0 experiments each recorded datasets of about 10 fb-1. As such experiments may never be repeated, these are unique datasets that allow for unique measurements. This presentation describes recent results from the two experiments on top-quark production rates, spin orientations, and production asymmetries, which are all probes of the initial state.
In 2001, the Fermilab Tevatron started colliding protons and antiprotons at TeV. When operations concluded in September 2011, two experiments, CDF and D0, had each recorded datasets of approximately 10 fb-1. As it is possible that there will never again be a collider, these are unique datasets that allow for unique measurements. In particular, the colliding partons were typically quarks and antiquarks, in contrast to the gluon-gluon collisions that predominate at the Large Hadron Collider (LHC). Here we describe a number of recent measurements that probe the production of top quarks at the Tevatron in ways that cannot easily be explored at the LHC. For the sake of brevity, older measurements are only summarized while those that have yet to be published or submitted for publication are described in greater detail.
Table 1 gives the predicted production cross sections for strongly-produced and electroweakly-produced single top quarks at the Tevatron and at LHC. While the cross sections are generally much larger at the LHC, that is not the case for the -channel single-top production in the mode, which is “only” a factor of five larger than at the Tevatron. Also, at the Tevatron the initial state provides about 85% of the total cross section for production, while it is only about 15% (10%) at the LHC in Run 1 (Run 2). This allows the Tevatron to compete with the LHC in some areas, and provides complementarity due to the initial state.
| Tevatron | 7.08 | 1.04 | 2.08 | 0.30 |
|---|---|---|---|---|
| LHC Run 1 | 234 | 5.55 | 87.2 | 22.2 |
| LHC Run 2 | 816 | 10.3 | 217 | 71.7 |
1 Production
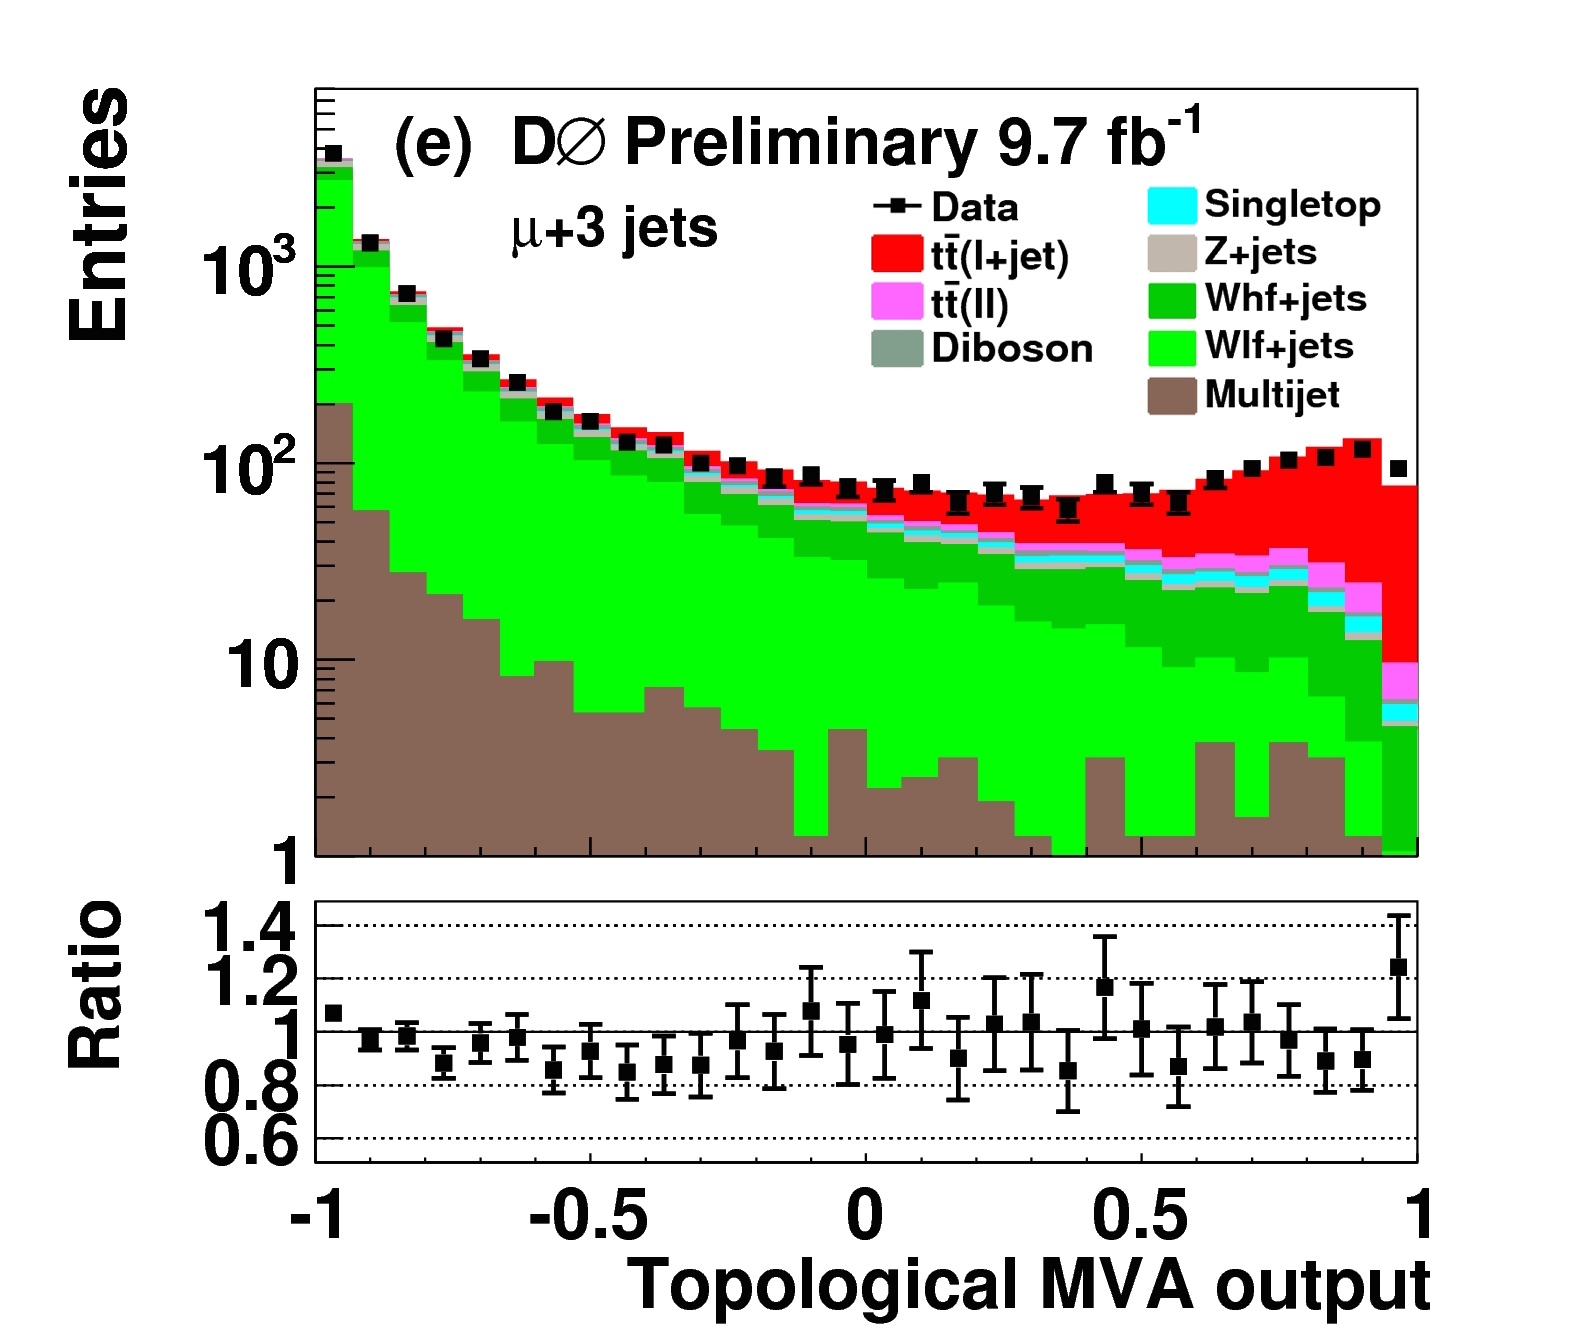
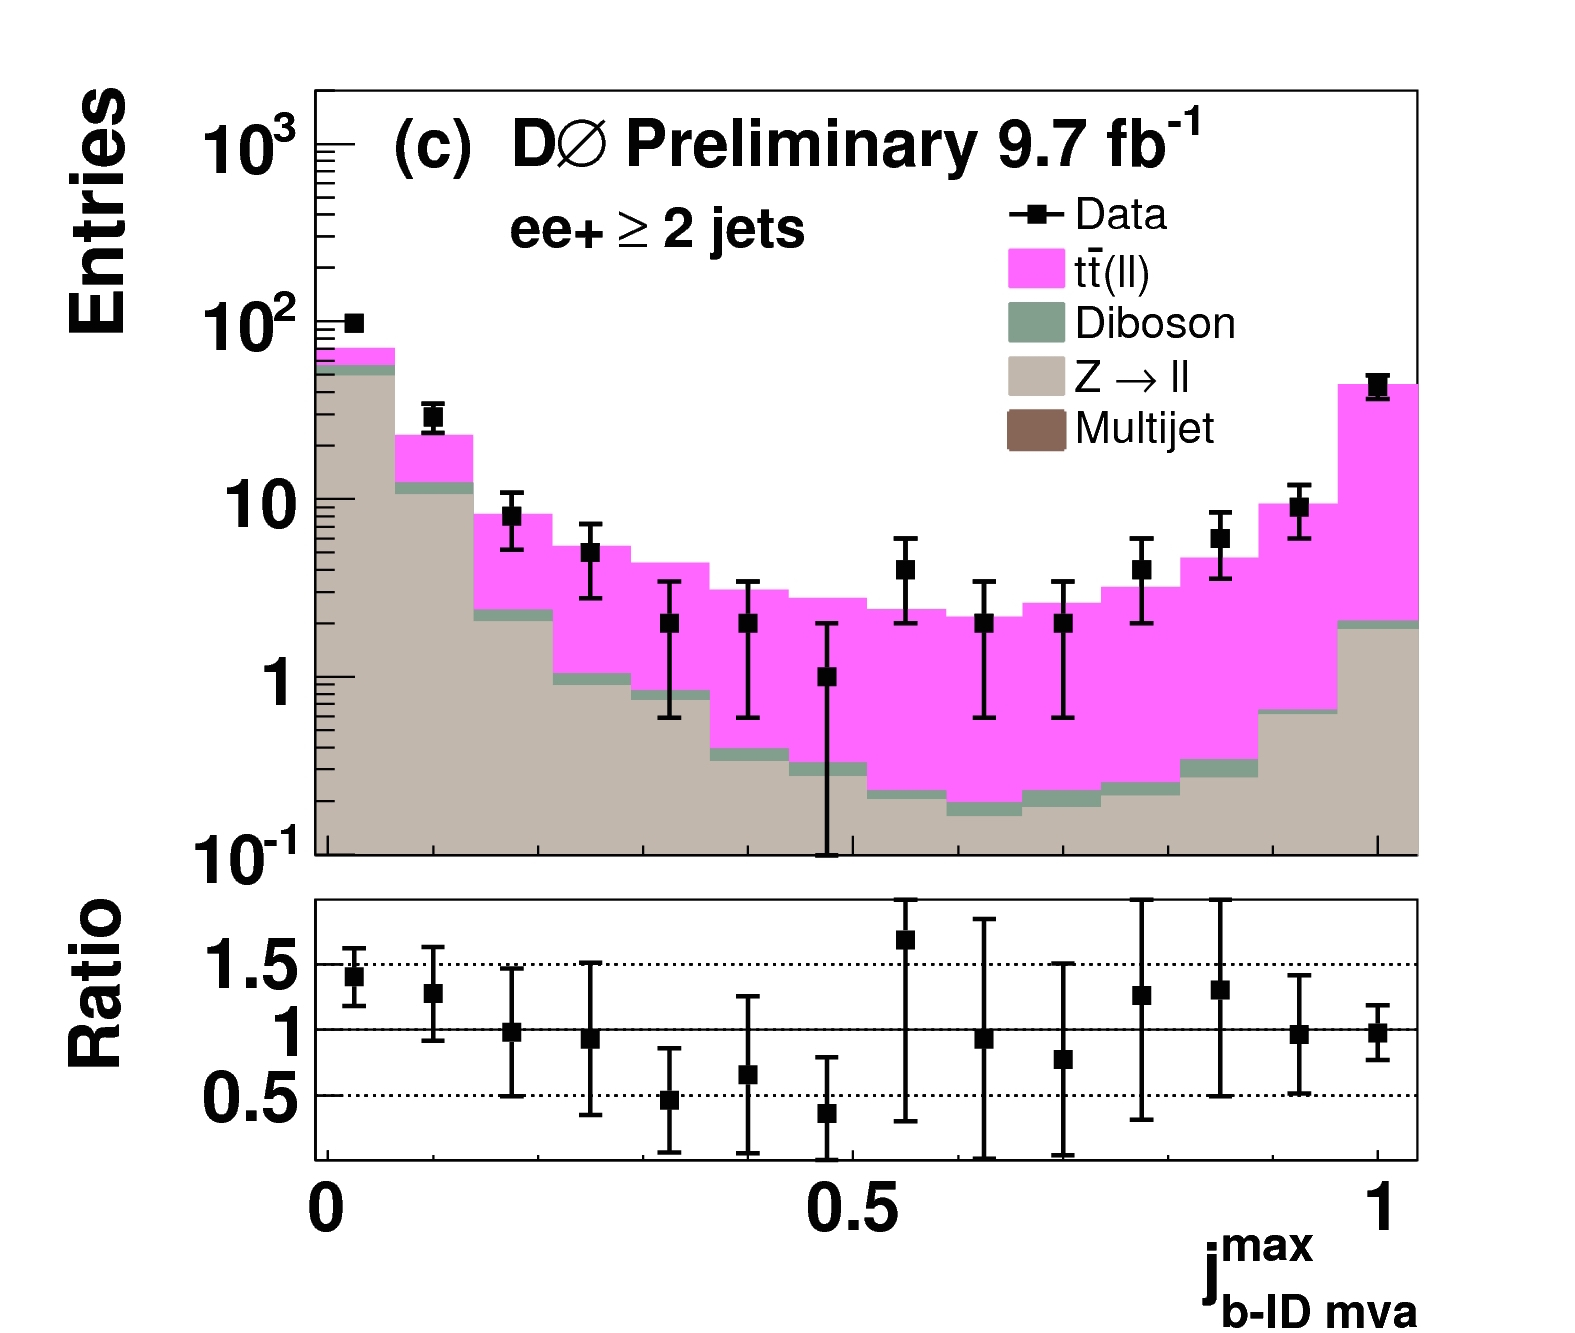
A preliminary measurement from D0, not yet published, gives a precise measurement of the inclusive cross section that makes use of both the dilepton and lepton-plus-jets channels [2]. The analysis makes heavy use of multivariate techniques, in which the numeric values of many individual observables from an event are combined to form one single quantity, and fits to distributions of those quantities from each different final state are used to obtain the cross section. The lepton plus jets channel is broken into six subsamples based on lepton type (electron or muon) and jet multiplicity (two, three or at least four jets). Each subsample gets its own boosted decision tree with gradients using about twenty kinematic variables, plus the output of a multivariate algorithm used to identify jets. The dilepton channel is simpler. It is broken into four subsamples ( plus one jet, plus at least two jets, plus at least two jets and plus at least two jets), and the -tag variable of the leading jet is the only one needed for the fit. Some representative distributions from the analysis are shown in Figure 1. The cross section is obtained from a simultaneous log-likelihood fit template fit across all samples, using systematic uncertainties as nuisance parameters. The profiling of systematic uncertainties reduces them by cross-calibration (for those that are uncorrelated). Careful attention is paid to correlations amongst systematic uncertainties in the different subsamples. The resulting cross section is 7.73 0.13 (stat) 0.55 (syst) pb, where the leading systematic uncertainties are from signal modeling, especially hadronization.
As stated earlier, the Tevatron experiments have unique access to the -channel production of single top quarks; at the LHC, the backgrounds (from production) are much more significant. The rate for this process is sufficiently small that results from the full datasets of both experiments need to be combined to obtain a measurement with sufficient statistical significance to be called an observation of the process [3]. The cross section result, pb, has 6.3 standard deviations significance. This measurement then allows separate estimates of the -channel and -channel cross sections, without any assumptions of the value of . The results are consistent with the standard model predictions, with no indication of any other contributing process. The two cross section values then leads to a measurement of that makes no assumptions on the number of quark generations, unitarity, or (but does assume standard model top decays, a pure interaction, and CP conservation). The result is , or at 95% confidence level after applying a flat prior distribution for .
2 Spin orientations
Top quarks produced in the strong interaction are almost entirely unpolarized, but for electroweak corrections at the 1% level. Thus, a search for top polarization is a search for new physics. The polarization of the top quark can be measured in the top rest frame through angular distributions of decay products with respect to a given axis :
| (1) |
where is the polarization strength and is the analyzing power of the decay product, which for leptons is nearly unity. There are many axes to choose from, such as the beam axis (the direction of the proton), the helicity axis (the direction of the parent top quark) and the transverse axis (the cross product of the other two which is perpendicular to the production plane).
D0 has new measurements of the top-quark polarization that makes use of the lepton plus three or at least four jets samples, in which a kinematic reconstruction is done is performed to obtain the lepton angles [4]. The inclusion of the three-jet sample increases the statistical power of the measurement but requires the use of a kinematic fitter developed for the measurement described in Section 3. Templates in for and are developed, and a fit of the angular distributions to the two templates and a background shape is performed. The relative normalizations of the templates allow for the extraction of . The distributions and fit results are shown in Figure 2 and Table 2. The measurements are consistent with both the standard model prediction and zero, and the measurement of the transverse polarization is the first ever. A measurement of the polarization in dilepton events is described in Section 3.
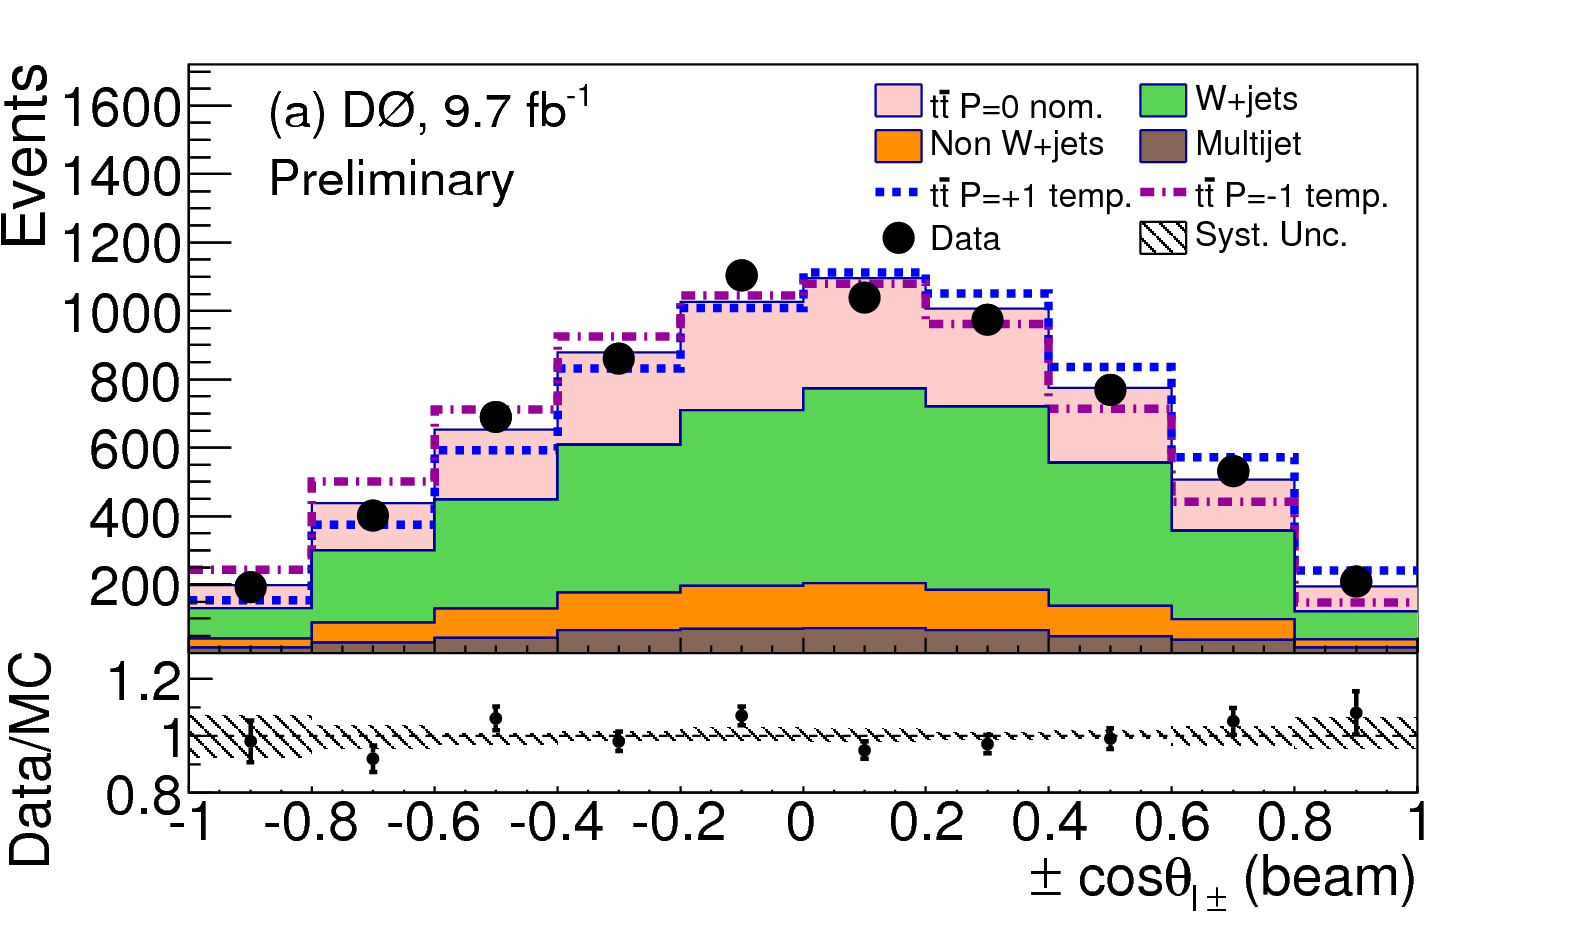
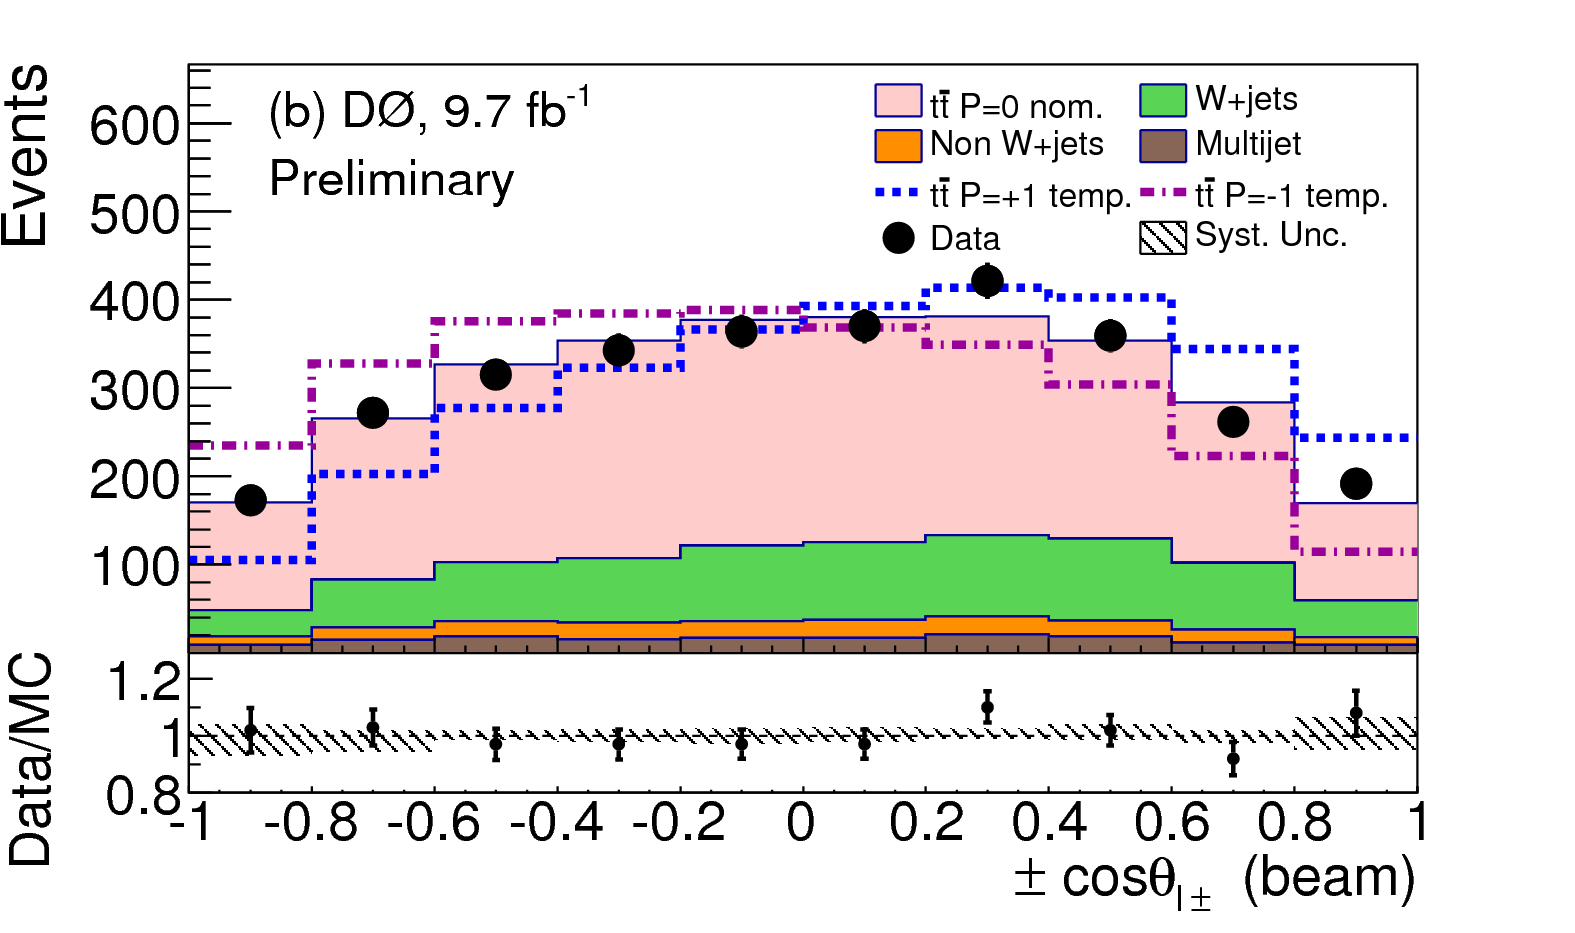
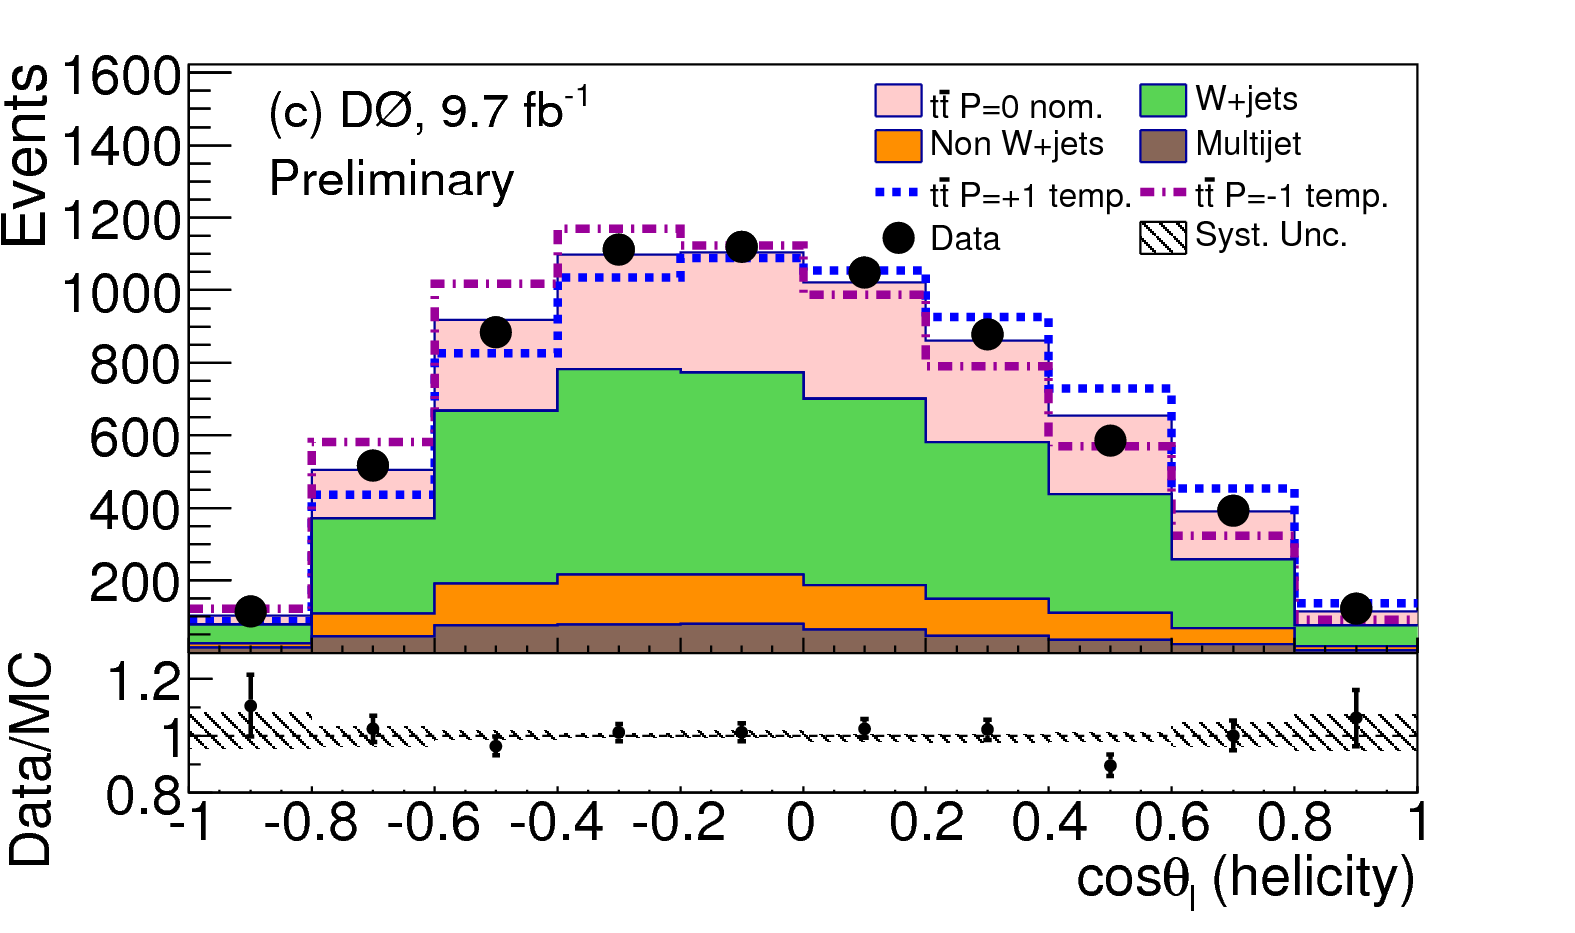
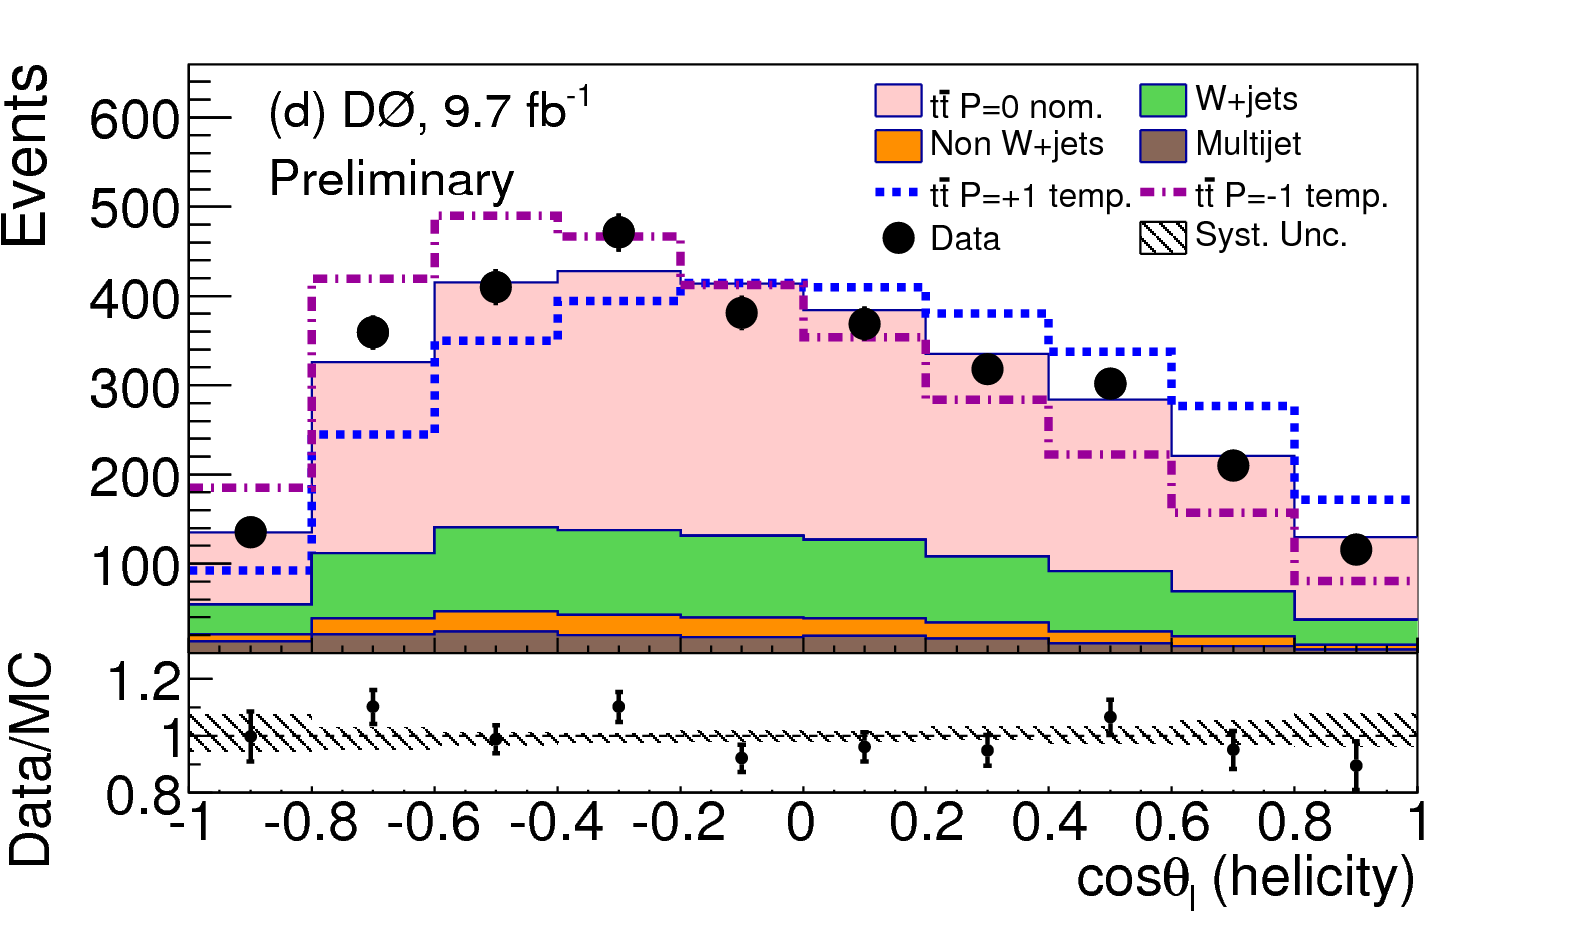
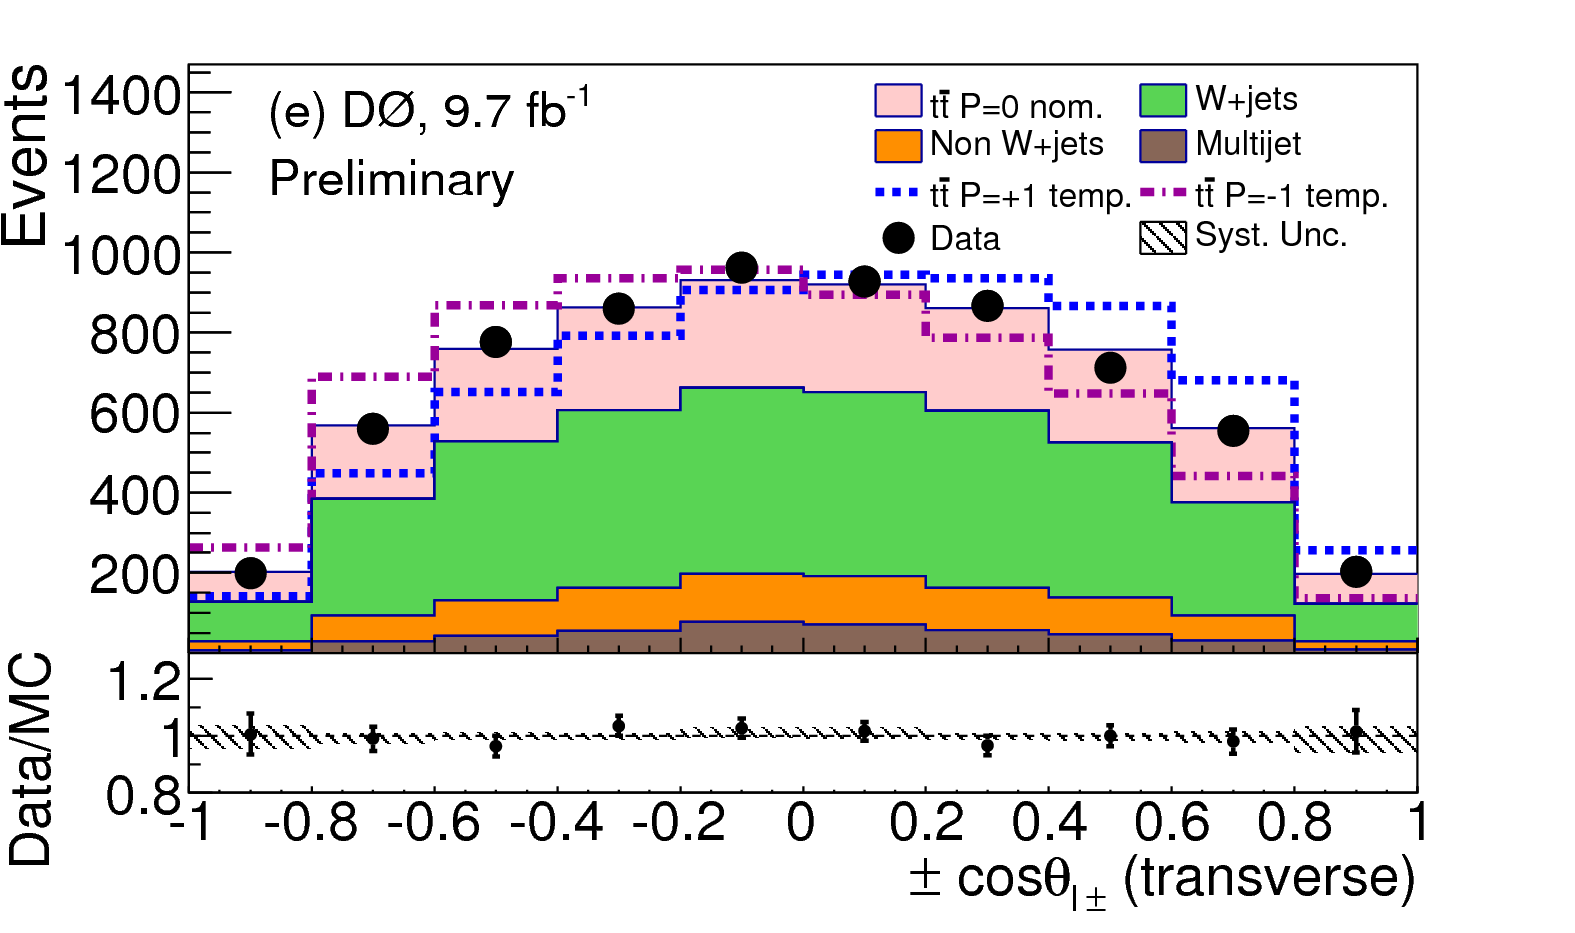
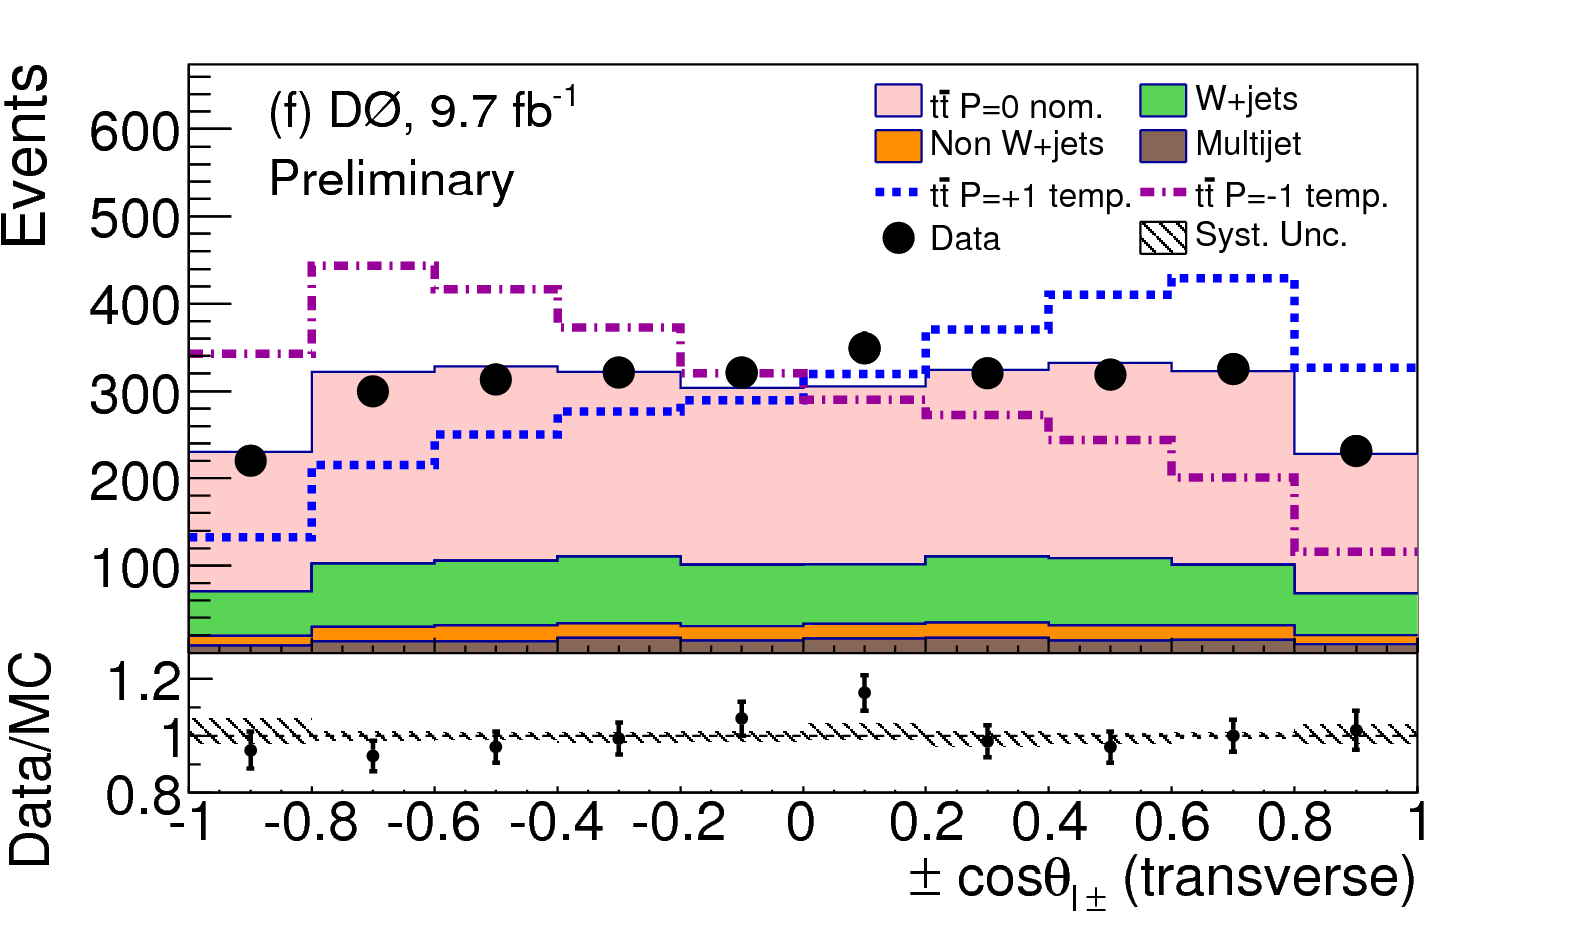
| Axis | Measured polarization | SM prediction |
|---|---|---|
| Beam | -0.002 | |
| Helicity | -0.004 | |
| Transverse | +0.011 |
While pairs are not produced polarized, their spins are correlated. The measurement of this correlation is unique to the system, as the top lifetime is a thousand times shorter than the spin decorrelation time. The amount of correlation depends on the initial state, or . D0 has measured the spin correlation using the observable
| (2) |
using the “off-diagonal” spin quantization basis [6] where the correlation is maximized [7]. Both dilepton and lepton+jets events are reconstructed with the matrix element method to create a discriminant distribution that reflects the relative probability for the SM or null spin correlation hypotheses. The resulting measurement is , where the systematic uncertainties are dominated by signal modeling issues. The measured value is in agreement with the SM value of 0.80 [8], and is 4.2 standard deviations away from zero, giving evidence for spin correlation. In addition, as the and initial states lead to different correlation strengths, the fraction from from each initial state at next to leading order can be extracted. The result is , consistent with the SM value of [8].
3 Production asymmetries
Due to interference terms that arise at next to leading order in QCD, pairs produced from interactions have a forward-backward asymmetry in the direction of the resulting quarks; the tends to follow the direction of the and the the direction of the . This asymmetry, defined as
| (3) |
where , the rapidity difference between the top quark and antiquark, is predicted to be about 10% [9]. The Tevatron has unique access to this quantity as most of the pairs are produced in interactions, which is not the case at the LHC.
The forward-backward asymmetry has been a topic of great interest for some years, as an anomalously large result could be an indicator of new physics, and some early measurements of this quantity using the amount of Tevatron data that was available at the time were in fact quite large (and the predicted values had been smaller). That spawned an effort to probe the asymmetry through a number of measurements that are briefly described here.
Reconstructing the top direction for is complicated, as it requires a kinematic reconstruction and then an unfolding because the experimental resolution is poor. Another approach to the problem is to measure the forward-backward asymmetry of the decay lepton. While the SM prediction for the asymmetry is only 4%, the measurement is relatively simple because of the resolution on the lepton direction. CDF has measured % [10] and D0 has measured % [11] for this quantity. The CDF result is slightly above the expected value, with an observed dependence on the lepton rapidity.
Another approach to the problem is to look in a different system. New physics affecting should affect production too. Most production is from the initial state, but production is enhanced for high-mass pairs. CDF has made two measurements of the asymmetry. One focuses on high-mass pairs, identifying jets with secondary vertices and assigning flavor with the difference in measured jet charges between the two jets. Effects that dilute the asymmetry such as mixing, secondary decays, charge misidentification and non- backgrounds are accounted for and the result is unfolded to the particle level. The result is consistent with the SM and is able to exclude some axigluon models [12]. A more recent search using lower-mass pairs makes use of soft-muon tagging to identify the jets, and is also consistent with SM expectations [13].
But the most fundamental information is obtained from the measurements themselves, in which the top quark directions are reconstructed. Both Tevatron experiments have well-established measurements in the lepton plus jets samples. CDF measures , somewhat higher than the SM prediction [14]. D0’s measurement uses more the phase space by exploiting the three-jet sample, along with a new top reconstruction method and two-dimensional unfolding. The result, , is more consistent with the SM prediction [15]. Both experiments examine the dependence of on and of the quarks, and find that it is greater than predicted.
measurements in the dilepton sample are more challenging because of the two neutrinos in the final state, and took longer to complete. The recently published D0 analysis [16] measures the production asymmetry simultaneously with the polarization of the top quark with respect to the beam axis, using a novel application of the matrix-element technique. A full reconstruction of the event kinematics is performed in a probabilistic fashion, and then a likelihood per event for the most probable kinematic value is made for both the asymmetry and the lepton decay angle with respect to the beam axis in the rest frame. After an appropriate calibration of the method, the relevant quantities can be extracted from the distributions of these quantities. The systematic uncertainties are dominated by those involved in modeling the signal, in particular hadronization and showering, and also the calibration of the method.
Without constraining either the asymmetry or the polarization, the results are
| (4) | |||||
| (5) |
where the first uncertainty is statistical and the second is systematic, and is the spin analyzing power of the lepton. If one of the quantities is constrained to its standard-model value, the result for the other quantity is
| (6) | |||||
| (7) |
The latter result for is combined with that from the lepton plus jets measurement to obtain the final D0 measurement of this quantity, .
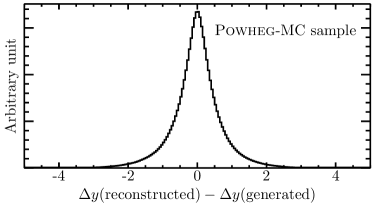
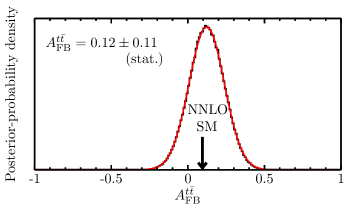
A CDF measurement of in the dilepton final state has recently been submitted for publication [17]. It is carried out in the same spirit as the D0 measurement. A likelihood-based algorithm is used to reconstruct the momenta of the two neutrinos, and thus the top momenta, in each event from the observed kinematics. Rather than a single solution, a likelihood is formed as a function of the kinematic variables, and both possible lepton-jet pairings are included. A likelihood-based scheme is used to unfold the results back to the parton level. The event selection is optimized to avoid poorly-reconstructed events, which keeps the migration matrix fairly diagonal. Figure 3 shows the expected resolution on the measurement of , and the posterior probability density obtained from the event sample. The resulting value of is %, where the first uncertainty is statistical and the second is systematic. While there is some sensitivity to the dependence of the result, no significant dependence is observed. The result is then combined with the CDF lepton plus jets result to obtain %, consistent with the SM expectation.
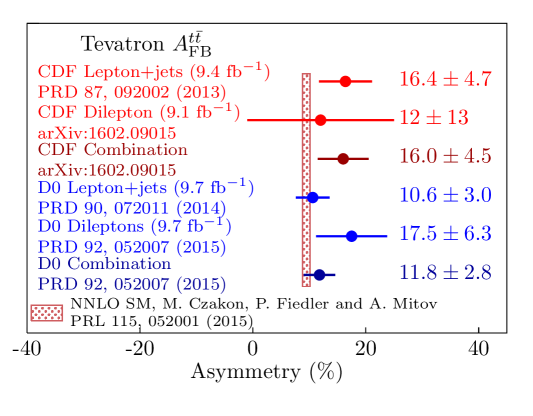
A summary the final Tevatron measurements of , using the full datasets, is given in Figure 4. The agreement between the results from CDF and D0 is reasonable, as is the agreement with the predictions from the standard model.
4 Conclusions
Even with the onslaught of data from the LHC, top physics at the Tevatron has remained interesting. The complementarity of the proton-antiproton initial state of the Tevatron has provided unique opporunities. The production asymmetry cannot be explored as well at the LHC, and the -channel single-top production is much more difficult to study there too. In addition, CDF and D0 are very mature experiments, with well-understood datasets and well-modeled detectors. This allows for significant creativity in data analyses that have yielded sophisticated measurements. The measurements in particular drove a spectacular effort to fully exploit the capabilities of the two experiments. Arguably the LHC has much to learn from the Tevatron experience. The last few Tevatron top production measurements should soon be available, bringing this epic adventure to a conclusion.
Acknowledgements.
Thousands of physicists worked on the Tevatron and on the CDF and D0 experiments over decades, and the results presented are due to their efforts. I particularly thank the current top-physics group conveners of the experiments for their input and feedback on their presentation. I also thank the conference organizers for the opportunity to enjoy La Thuile. May the quarks be with you!References
- [1] N. Kidonakis, Phys. Part. Nucl. 45, 714 (2014) and references therein.
- [2] D0 Collaboration, D0 Note 6453-CONF (2015).
- [3] CDF and D0 Collaborations, Phys. Rev. Lett. 112, 231803 (2014).
- [4] D0 Collaboration, D0 Note 6417-CONF (2015).
- [5] W. Bernreuther, M. Fucker and Z.-G. Si, Phys. Rev. D78, 017503 (2008); W. Bernreuther and Z.-G. Si, unpublished e-mail communication.
- [6] G. Mahlon and S. J. Parke, Phys. Lett. B411, 173 (1997).
- [7] D0 Collaboration, arxiv.org/1512.08818 (submitted to Phys. Lett. B).
- [8] W. Bernreuther and Z.-G. Si, Nucl. Phys. 837, 90 (2010)
- [9] M. Czakon and A. Mitov, Computer Physics Communications 185, 2930 (2014); P. Barnreuther, M. Czakon and A. Mitov, Phys. Rev. Lett. 109 132001 (2012).
- [10] CDF Collaboration, Phys. Rev. D90, 072001 (2014).
- [11] D0 Collaboration, Phys. Rev. D88, 072003 (2013).
- [12] CDF Collaboration, Phys. Rev. D92, 032006 (2015).
- [13] CDF Collaboration, arxiv.org/1601.06526, submitted to Phys. Rev. D.
- [14] CDF Collaboration, Phys. Rev. D87, 092002 (2012).
- [15] D0 Collaboration, Phys. Rev. D90, 072011 (2014).
- [16] D0 Collaboration, Phys. Rev. D92, 052007 (2015).
- [17] CDF Collaboration, arxiv.org/1602.09015, submitted to Phys. Rev. D.