SXP214, an X-ray Pulsar in the Small Magellanic Cloud, Crossing the Circumstellar Disk of the Companion
Abstract
Located in the Small Magellanic Cloud (SMC), SXP214 is an X-ray pulsar in a high mass X-ray binary system with a Be-star companion. A recent survey of the SMC under a Chandra X-ray Visionary program found the source in a transition when the X-ray flux was on a steady rise. The Lomb-Scargle periodogram revealed a pulse period of 211.49 0.42 s, which is significantly (5) shorter than the previous measurements with XMM-Newton and RXTE. This implies that the system has gone through sudden spin-up episodes recently. The pulse profile shows a sharp eclipse-like feature with a modulation amplitude of 95%. The linear rise of the observed X-ray luminosity from 2 to erg s-1 is correlated with steady softening of the X-ray spectrum, which can be described by the changes in the local absorption from H 1024 to 1020 cm-2 for an absorbed power-law model. The soft X-ray emission below 2 keV was absent in the early part of the observation when only the pulsating hard X-ray component was observed, whereas at later times both soft and hard X-ray components were observed pulsating. A likely explanation is that the neutron star was initially hidden in the circumstellar disk of the companion, and later came out of the disk with the accreted material that continued fueling the observed pulsation.
Subject headings:
stars: neutron — X-rays: binaries1. Introduction
The Small Magellanic Cloud (SMC) harbors a large number of high mass X-ray binaries with pulsating neutron stars (NS) and Be-star companions (Coe & Kirk, 2015; Haberl & Sturm, 2015). In a system with a relatively long orbital period, the NS is often in a wide and eccentric orbit, and periodically encounters the circumstellar disk of the Be star, which triggers Type-I outbursts through accretion onto the NS (Reig, 2011; Townsend et al., 2011). SXP214 or XMMU J005011.2–730026 was discovered as a transient pulsar in the SMC with a pulse period of = 214 s from an XMM-Newton observation in 2009 (Coe et al., 2011, hereafter C11). A B2-B3 III star with = 15.3 mag and a weak H emission line was identified as the optical counterpart from the OGLE-II & III data and an optical spectrum taken at the South African Astronomical Observatory (C11). Thus, SXP214 has been classified as a Be/X-ray binary (Be-XRB; C11).
The orbital period of the system remains unclear. C11 reported an optical periodicity of 4.52 d based on the OGLE-III lightcurve. Schmidtke & Cowley (2011) reported another optical period of 0.82 d based on the MACHO and OGLE-II observations, arguing that the 4.52 d periodicity is a weaker alias of the 0.82 d period and the latter is more consistent with other Be-XRBs. Later Schmidtke et al. (2013) reported a new optical period of 29.91 d with an eclipse-like feature in the folded lightcurve from the OGLE-IV data when the optical counterpart became faint and the 0.82 d optical pulsations disappeared.
Here we describe new Chandra observations of SXP214 (§2), which show dramatic temporal and spectral changes of the X-ray emission (§3). We search for periodicity in the X-ray emission and perform phase-resolved spectral analysis to understand the origin of the observed changes (§4). We revisit the OGLE optical lightcurve and its long term periodicity (§5). We present a likely scenario for the changes observed in the X-ray emission and constrain the density of the circumstellar disk, the magnetic field of the NS and the accretion rate (§6).
2. Observations and Data Processing
SXP214 was observed in 2013 January (Obs. ID 14670) and 2014 March (Obs. ID 15503) by Chandra for 50 ks each as a part of the recent SMC survey under the Chandra X-ray Visionary Program (PI A. Zezas). The details of the survey program and the full source catalog are found in Antoniou et al. (2016). The X-ray timing analysis and the catalog of the SMC pulsars in the survey are discussed by Hong et al. (2016). The data presented here were processed and analyzed by the latest X-ray analysis pipeline using CIAO ver 4.6 developed for the Chandra Multi-wavelength Plane survey (Grindlay et al., 2005; Hong, 2012).
The source was observed 7.5′ off the aimpoint in both observations. The source was detected in the first observation with 1511 net counts in the 0.3–8 keV band or a 0.5–8 keV X-ray luminosity of erg s-1 at 60 kpc (see below for the spectral model used), while it was not detected in the the second observation with an upper limit of 12 net counts at 3 significance ( erg s-1). According to the Chandra archival data, a Chandra observation in 2002 October (Obs. ID 2945) also covered SXP214 at 17′ off the aimpoint for 12 ks, but it was not detected ( erg s-1). The following analysis is based on the 2013 January observation (Obs. ID 14670). The Chandra position of the source is R.A. = 00h50m11.26s and Decl. = 73∘00′25.6′′ (J2000) with a 95% error radius of 0.47″ where the error is based on the formula by Hong et al. (2005).
3. Spectral and Temporal Evolution
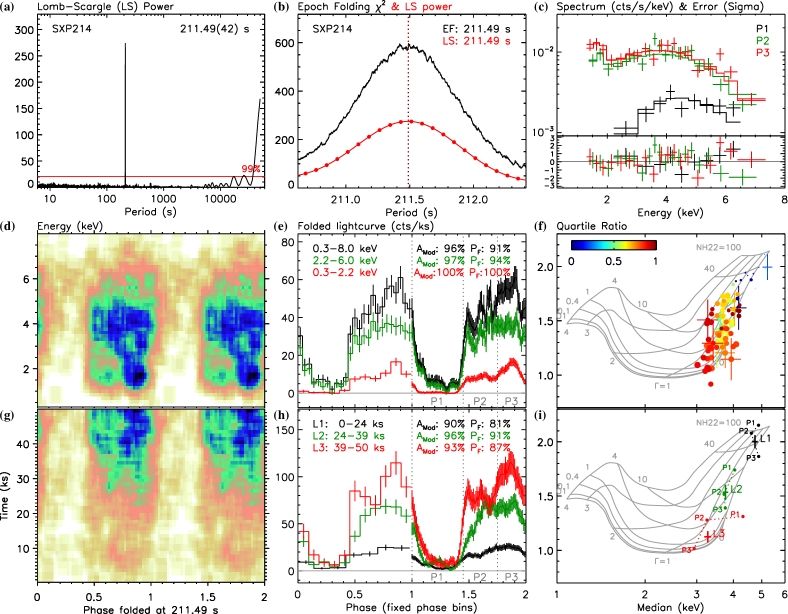
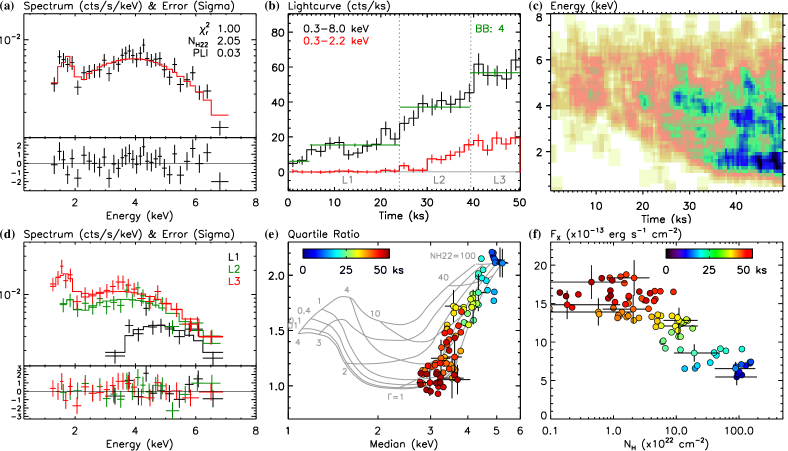
Fig. 1a shows the overall X-ray spectrum and the best spectral fit using an absorbed power-law model with two absorption components: the Galactic foreground absorption fixed at H = cm-2 (Dickey & Lockman, 1990) with solar abundances ( = ), and the free SMC and local absorption with reduced metal abundances of = 0.2 (Russell & Dopita, 1992) following the absorption model by Wilms et al. (2000). Each spectral bin is set to contain at least 40 net counts. The best-fit photon index is = 0.0 0.1 with H = cm-2 and reduced = 1 (Table 1). An absorbed blackbody, thermal bremsstrahlung or APEC model fits the X-ray spectrum poorly (reduced = 1.4 – 4).
The X-ray lightcurve of the source (Fig. 1b) shows a steady rise with an average count rate of 30 counts per ks. Bayesian block analysis, that searches for the change points between time intervals of statistically different rates (Scargle et al., 2013), identified four separate blocks (green). Fig. 1c visualizes a remarkable change in the spectrum using the temporal energy distribution of the X-ray events in the source aperture region. The early part of the X-ray spectrum is limited to hard X-ray photons above 3 keV, and the softer X-ray photons below 2 keV appeared only after 20 ks into the observation.
To quantify the spectral evolution, we divide the data set into three time intervals according to the Bayesian blocks: L1, L2, and L3 for the first 24 ks (combining the first two blocks with relatively low counts), the middle 15 ks, and the last 11 ks, respectively. Fig. 1d shows the best-fit joint spectral model of the three intervals with a common photon index. Each spectral bin of the segmented data set is set to contain at least 20–30 net counts. Table 1 lists the best-fit parameters for both joint and individual fits, which are all consistent with = 0.5, indicating that the spectral changes are driven by the variation in the local absorption.
Fig. 1e illustrates the evolution of spectral parameters in a finer timescale using the energy quantile diagram (quartile ratio vs. median energy), which can classify diverse spectral types without spectral bias often inherent to X-ray hardness or X-ray color-color diagrams (Hong et al., 2004). Each data point contains about 75 net counts in sliding time windows. The grids are for an absorbed power-law model covering a wide range of photon indices ( = 0–4) and local absorptions (H = 1020–24 cm-2). The rise in the count rate from 5 to 60 cts ks-1 is well correlated with the significant reduction in the local absorption from H 1024 to 1020 cm-2 for the aforementioned absorbed power-law model, whereas the photon index remains more or less constant. Fig. 1f shows the correlation between the observed 0.5–8 keV X-ray flux and the local absorption, assuming = 0.5, whereas the intrinsic X-ray flux or luminosity remains more or less constant within the uncertainty (Table 1).
4. Timing Analysis
We search for periodic X-ray modulations in the 0.3–8 keV lightcurve using a Lomb-Scargle (LS) periodogram (Scargle, 1982). For the details of the timing analysis, see Hong et al. (2016). Fig. 2a plots the LS periodogram over the entire search range, revealing a sharp peak at 211.5 s. An increase in the power of the periodogram at periods longer than 10 ks is due to the long-term rise of the lightcurve. We refine the modulation period with a follow-up search using the epoch folding (EF) and LS methods around the initial period. Both EF and LS periodograms peak at the same period of 211.49 0.42 s (Fig. 2b). The error of the modulation period is a 1-equivalent width (34%) of the peak in the periodogram, which tends to be a bit conservative, relative to the error estimate (0.13 s) based on Horne & Baliunas (1986). Nonetheless, the newly detected pulse period is not only significantly shorter than the previously reported period of 214.045 0.052 s by C11 from the XMM-Newton observation in 2009 November, but it is also against the long-term spin-down trend ( +0.12 s yr-1 with the average period of 213.7 0.1 s) measured by RXTE (Klus et al., 2014, hereafter K14). On the other hand, the individual period measurements by K14 show a large scatter ranging from 211 to 216 s, and two out of 17 RXTE measurements show the periods consistent with our result.
Fig. 2d illustrates the drastic spectral variation with pulse phase using the energy vs. phase distribution of the X-ray events. The energy-band selected pulse profiles in Fig. 2e show large peak-to-valley amplitudes ( 95%) and high pulse fractions ( 91%),111 is defined as 1–min/max where min and max are the minimum and maximum of the folded lightcurve. is defined as the ratio of the pulsating flux above the minimum to the total flux. i.e., , where is the rate of the folded bin . which contrasts with a somewhat marginal of 29% measured by XMM-Newton (C11). The Chandra pulse profile shows clear on- and off-phases of almost equal durations. The soft X-ray emission below 2 keV appears fully ‘eclipsed’ during the off-phase and exhibits a two-step rise during the on-phase, whereas the hard X-ray emission is more or less uniform during the on-phase with some trailing into the off-phase.
We divide the pulse phases into three segments based on the soft-band pulse profile: P1 for the off-phase covering 0.00 – 0.45, P2 for the first part of the rise covering 0.45 – 0.75, and P3 for the peak covering 0.75 – 1.00. Fig. 2c shows the best-fit joint model of the three segments with a common photon index and Table 1 lists the best-fit parameters for both joint and individual fits. When 0 (P1), the photon index becomes somewhat degenerate with the absorption, so the best-fit parameters can be misleading. On the other hand, in the joint fit and the phase-resolved quantile diagram in Fig. 2f there appears to be a clear trend that the spectral evolution over pulse cycles is also dominated by the changes in the local absorption. At the peak of the pulse profile (phase 0.9), the local absorption drops below H = 1020 cm-2, whereas during the off-phases ( 0.1 to 0.5) it rises well above 1023 cm-2. The quantile diagram in Fig. 2i compares the spectral types of the three phases of each time interval. The spectral evolution over the pulse phase within each interval is not dramatic, indicating that the spectral evolution seen in Figs. 2c and 2f is likely amplified by the temporal evolution.
Fig. 2g shows the time vs. pulse phase distribution of the X-ray events. The pulsation is present from the very beginning of the observation when no soft X-ray emission below 2 keV was observed. The apparent skewness in the distribution (e.g, at phase 0), which is usually an indication of an inaccurate period estimate (Hong et al., 2016), is an artifact due to the flux change with the time: i.e., the distribution, if renormalized at each time bin, would not be skewed (not shown). Fig. 2h shows the folded lightcurve of each time interval, and the strong pulsation is observed in all three intervals (mod 90%).
5. OGLE Lightcurve Analysis
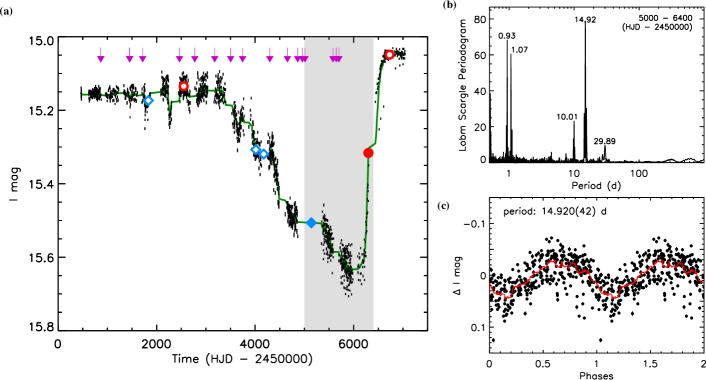
Fig. 3a shows the optical lightcurve in mag spanning over 20 years using the data from the OGLE-II, III, and IV surveys. The red circles and blue diamonds mark the three Chandra and four XMM-Newton observations, respectively. The X-ray pulsations (solid symbols) were detected when the optical lightcurve was experiencing a significant drop or recovering from the drop. RXTE also detected the X-ray pulsations from the source multiple times (purple arrows; K14).
Given the uncertainty in the orbital period of the system, we search for periodic modulation in the full OGLE lightcurve using the LS periodogram. The LS periodogram of the raw lightcurve shows three dominant periods of 0.5, 1, and 348 d. Detrending techniques eliminate these false periods to varying degrees but the final periodicity results are not sensitive to the detrending techniques. We use the moving average of 20 data points as the lightcurve trend.
We also calculate the LS periodogram of the OGLE lightcurve using sliding windows of 500 d to identify any changes in the periodicity. Indeed the periodicity transitions in about MJD 55000, and then the last 500 d of the lightcurve do not show any clear sign of periodicity. In the first 5000 days of the lightcurve 0.82 and 4.58 d periods are most dominant as reported by C11 and Schmidtke & Cowley (2011). We note that the 0.82 d period is a beat period among 0.5, 1, and 4.58 d periods. Fig. 3b shows the periodogram of the next 1400 days where a 14.92 d period is most prominent. Its second harmonic (29.89 d), which is consistent with the 29.91 d period reported by Schmidtke et al. (2013), is marginally significant. The 0.93 and 1.07 d periods are the beating periods among 0.5, 1, and 14.92 d. Fig. 3c shows the folded lightcurve at the 14.92 d period. The analysis of the full OGLE lightcurve did not reveal any other new periods. Given their instability, it appears premature to claim that any of the above periods is the orbital period
| (1) | (2) | (3) | (4) | (5) | (6) | (7) | (8) | (9) | (10) | |||||||||
|---|---|---|---|---|---|---|---|---|---|---|---|---|---|---|---|---|---|---|
| Data Segment | Net Count | H in 1022 cm-2 | / DoF | X | X | |||||||||||||
| 0.3–8 keV | joint fit | (indiv. fit) | Observed | Intrinsic | Observed | Intrinsic | ||||||||||||
| All (Fig. 1a) | 1511 | 39 | 2.1 | 1.00 | / 31 | 10.9 | 11.6 | 4.7 | 5.0 | |||||||||
| By elapsed time (Fig. 1d) | 0.5 | 0.90 | / 46 | |||||||||||||||
| 0 – 24 ks (L1) | 326 | 18 | ( | ) | 70.3 | (91.9 | ) | (1.43 | / 8) | 7.0 | 14.0 | 3.0 | 6.0 | |||||
| 24 – 39 ks (L2) | 567 | 24 | ( | ) | 4.9 | (5.0 | ) | (0.95 | / 17) | 12.7 | 14.8 | 5.5 | 6.4 | |||||
| 39 – 50 ks (L3) | 617 | 25 | ( | ) | 1.2 | (1.1 | ) | (0.72 | / 19) | 16.0 | 17.1 | 6.9 | 7.4 | |||||
| By folded phases (Fig. 2c) | 0.2 | 1.10 | / 40 | |||||||||||||||
| 0.00 – 0.45 (P1) | 224 | 15 | ( | ) | 29.0 | (0.0 | ) | (0.59 | / 6) | 4.5 | 6.3 | 1.9 | 2.7 | |||||
| 0.45 – 0.75 (P2) | 646 | 25 | ( | ) | 3.2 | (5.0 | ) | (1.06 | / 16) | 14.8 | 16.2 | 6.4 | 7.0 | |||||
| 0.75 – 1.00 (P3) | 641 | 25 | ( | ) | 1.4 | (0.4 | ) | (1.07 | / 16) | 16.3 | 17.2 | 7.0 | 7.4 | |||||
Notes– (3) The best-fit photon index and (4) & (5) the SMC local absorption with the metal abundances of = 0.2 following Wilms et al. (2000) for an absorbed power-law model. The fit parameters in the parentheses are from individual spectral fits instead of joint fits. (6) The reduced and the degree of freedom (DoF). (7) The absorbed and (8) unabsorbed 0.5–8 keV energy fluxes in 10-13 erg s-1 cm-2. (9) The absorbed and (10) unabsorbed 0.5–8 keV luminosities at 60 kpc in 1035 erg s-1. Errors in the table represent the 68% confidence (or 1 equivalent) interval.
6. Discussion
The typical orbital period of Be-XRBs with 200–300 s pulsations is 30 to 200 days based on the so-called “Corbet” diagram (e.g., Reig, 2007; Cheng et al., 2014). K14 assumed 4.58 d as the orbital period of SXP214, but according to their own orbital vs. spin period diagram, SXP214 is an outlier and 4.58 d appears too short for the orbital period. C11 detected weak H emission (equivalent width: 1.51.0 Å) on MJD 55716, when the optical flux was near its historical minimum. Since it is recognized that the continuum variations in Be stars trace the size of the circumstellar disk (e.g., Reig, 2011), the 14.92 or 29.89 d period, measured when the disk was relatively small, may represent the true orbital period. The observed historical maximum X-ray luminosity is less than erg s-1 (K14).222K14 assumed = 33% when converting the RXTE counts to the luminosity. Their luminosity value can be an overestimate by a factor of three if the pulsed fraction is close to 100% as seen in this analysis. On the other hand, K14 assumed = 1.5 for the spectral model, which can lower their luminosity estimates by 30% for a harder spectrum with = 0.5. Combining these two, the luminosity estimate by K14 for SXP214 can be an overestimate by about a factor of two. In fact, the system was detected only in two out of seven observations (three with Chandra and four with XMM-Newton), which is about 30% duty cycle. According to Reig (2007), these findings suggest that SXP214 is in a highly eccentric orbit ( 0.3) with a long orbital period ( 20 d) and should exhibit Type-I bursts (1037 erg s-1). Further they suggest that the circumstellar disk is likely only mildly perturbed (but not fully truncated) by the NS.
Our measurement of the spin period indicates that the system may have gone through sudden spin-up episodes recently. In a system with a highly elliptical orbit, accretion-induced spin up episodes are likely to occur regularly, often near periastron passages. The orbital speed () of the NS is
where , , , , , and are the gravitational constant, the masses of the primary and neutron stars, the eccentricity, the orbital phase, and the orbital period, respectively. Within about 120∘ of the periapsis (i.e., 120∘) which covers about 30% of the orbital period, for = 0.5, = 10 , and = 1.4 , 150 – 270 (/)1/3 km s-1 or 150 – 270 km s-1, where is the combined mass in units of 11.4 , is in units of 30 days, and is the semi-major axis in units of 0.43 AU. Therefore, the apparent change in the spin period due to the orbital motion-induced Doppler effect is less than 0.11 – 0.19 (/)1/3 s for = 0.5, which is too small to account for the observed period difference.
According to Cheng et al. (2014), accretion through a disk can be an efficient spin-up process for the NS whereas quasi-spherical or advection dominated accretion is relatively inefficient. Even in the case that the accretion is always through a disk, if the accretion disk around the pulsar is frequently reformed near periastron passages due to a highly eccentric orbit, it is not surprising to see the spin-up and spin-down torque reversal depending whether each newly formed disk is prograde or retrograde relative to the NS spin (Nelson et al., 1997). Given the long-term spin-down trend even with the two earlier RXTE measurements showing similarly short periods (K14), the spin-up and spin-down torque reversal may occur routinely in SXP214 in addition to the relatively slow spin-down trend due to the rotational energy loss when there is no accretion.
Roughly two years have passed between the last measurement of the spin period by K14 and our measurements. Indeed the last few measurements of the spin period by K14 already show a possible spin-up trend. If we assume the recent spin-up trend has lasted 1 – 3 yrs, then 0.56 – 1.7 s yr-1. For the accretion torque-induced spin-up model by Ghosh & Lamb (1979) under the assumption that the observed peak luminosity of 1036 erg s-1 is due to the accretion, the only possible solution for a NS with a mass of = 1.4 and a radius of = 106 cm is with 0.48 s yr-1 and a magnetic field of 1013 G. The matching accretion rate is g s-1 or yr-1. The observed luminosity and thus the accretion rate are a bit low for the estimated spin-up rate even with a strong field especially considering that the X-ray emission and thus the spin-up trend have likely been episodic. If we use the historical average of X-ray luminosities measured by RXTE ( erg s-1, K14), a solution for the model by Ghosh & Lamb (1979) is available for the full range of 0.56 – 1.7 s yr-1 with 0.03 – G and yr-1. With the duty cycle of 30%, the actual spin-up rate during the accretion has to be about three times higher, which effectively means 1.9 – 5.7 s yr-1 during the accretion. The solution for the model by Ghosh & Lamb (1979) exists for a partial range of 1.9 – 4.8 s yr-1 with 0.44 – G and yr-1 during the accretion (or yr-1 on average).
The anti-correlation between the observed flux and the absorption during pulsation as shown in Fig. 2f suggests that the pulsation might be modulated with the periodic occultation of the emission region by an intervening absorber (e.g., Suchy et al., 2008). The modulated absorption, however, cannot explain the missing soft X-ray component in the early time of the observation when the strong pulsation was present (Figs. 2g and 2h). This implies that in the beginning the pulsar must have been inside or behind a heavy absorber independent of the pulsation geometry. A natural candidate for such an absorber is the circumstellar disk of the companion. The soft X-ray emission at the later time, then, indicates that the NS came out of the circumstellar disk into view without obscuration by the disk. Coe et al. (2015) showed that a similar picture can explain the orbital eclipse in the long term X-ray lightcurve of SXP5.05. This analysis demonstrates for the first time the changes in the X-ray emission as the NS crosses the circumstellar disk.
Alternatively one can consider accretion wake or clumpy winds as an absorber. The stellar wind from a typical B2-B3 star, however, is not strong enough to trigger accretion wake or to generate clumpy winds. For instance, clumpy winds in 4U 1700–37, which cause an absorption of 1024 cm-1, are from an Of star with 10-5 – 10-6 yr-1 (Haberl et al., 1989), whereas the mass loss () for B0-B1 stars is already 10-9.5 yr-1 (Smith, 2014).
In fact, we have likely witnessed the NS crossing through (instead of behind) the circumstellar disk. The observed spin-up trend and associated torque reversal favor the accretion through a disk instead of quasi-spherical winds. The constant intrinsic X-ray luminosity in Table 1 indicates that the accretion was in a steady state during our observation. This appears to favor the NS crossing behind the circumstellar disk without contact during our observation. But then it implies a relatively long lifetime of the accretion disk and a sharply truncated circumstellar disk for the NS to emerge in a short time ( 30 ks). Feeding enough material for the lasting accretion disk would likely require a circumstellar disk with a high density, which in turn would lead to a high peak X-ray luminosity (1037 erg s-1; e.g., SXP5.05) and a long emission duty cycle, at odds with the long-term properties of SXP214.
On the contrary, the observed rare episodic X-ray emission and the likely long orbital period suggest a relatively short lifetime of the accretion disk and an only mildly perturbed circumstellar disk. A relatively low X-ray luminosity also implies that the NS crosses a low density region of the circumstellar disk (see below). The relatively low optical emission (Fig. 3a) during our observation also implies a small circumstellar disk. Thus, it is plausible that the accretion disk became stable while feeding through the circumstellar disk, and the intrinsic X-ray luminosity remained constant for a while after the NS just emerged from the circumstellar disk. Therefore, the NS crossing through the circumstellar disk provides a more consistent picture.
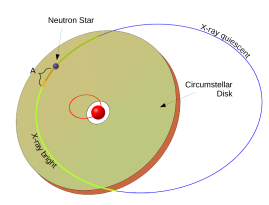
Fig. 4 illustrates a possible orbital configuration of SXP214 under the assumptions of 10 , 1.4 , 30 d. The radius of the circumstellar disk shown in the figure is about , and an inclination angle () between the disk and the orbital plane is about 15∘. In this picture, the NS crosses the circumstellar disk near the periastron passage once per orbit and for about 25% of the orbital period (depending on the orbital motion induced change in the disk: e.g., warping), the first Lagrangian point of the NS is on contact with the circumstellar disk, during which the NS is potentially X-ray bright (thicker green line). The interval marked by ‘A’ (orange line) can be the 50 ks observing period of Obs. ID 14670, where the NS emerges from the disk in about 20–30 ks into the observation.
While the above illustration provides a possible picture consistent with the observation including the X-ray emission duty cycle, note that how the accretion phase remains relatively short is not clearly understood. In particular, a caveat in the accretion disk for Type-I burst systems is that the viscous time scale of a standard thin disk is expected to be longer than the orbital period, which should produce somewhat persistent X-ray emission. Okazaki et al. (2013) invokes a radiatively inefficient accretion flow to explain relatively short X-ray emission duty cycle for Type-I burst systems, where the accretion flow is X-ray faint and the observed X-ray is mainly from the radiation at the poles. Relatively high modulation amplitude ( 90%) indeed suggests that the observed X-ray emission from SXP214 is from the poles, but regarding the exact accretion flow around the NS remains uncertain.
In our observation the soft X-ray component was hidden for at least 20 ks. Assuming the NS was already inside of the circumstellar disk in the beginning of the observation based on the constant intrinsic luminosity and the orbital path is locally straight, we can place a limit on the height () of the circumstellar disk using the travel distance of the NS in 20 ks. For an inclination angle () between the disk and the orbital plane,
If the majority of the observed extinction (1024 cm-2) at the early times is due to a simple slab-shape disk of a uniform density,333We use a simple model, given many unknown system parameters. Along with a possible density profile in the circumstellar disk, the orbital motion of the primary star (Fig. 4) can cause warping in the disk, generating additional density variation. the density () of the circumstellar disk is
where is the angle between the disk and the line of sight (i.e., = 0 for an edge-on view). The density of the circumstellar disk of Be stars lies in the range between about 10-12 to a few times 10-10 g cm-3 (Rivinius et al., 2013) and the disks of Be-XRBs are about 1.5 times denser (Reig et al., 2016), so the above estimate for SXP214 indicates that the section the NS crosses is of relatively low density.
The mass the NS accretes can be estimated using the volume swept by the NS under the Bondi accretion.
where is the orbital speed of the NS relative to the gas in the circumstellar disk, and is the accretion fraction relative to the circumstellar disk mass the NS disrupts as it crosses. Assuming the velocity of the gas in the circumstellar disk is in the same order of the NS’ orbital speed , . Therefore,
If the NS captures about 1–10% of the mass it disrupts (i.e., 0.01 – 0.1), the accretion rate meets what is required for the observed spin-up process ( yr-1).
The spectral variation during the pulsation can be understood by the periodic occultation of the emission region due to the NS rather than a separate absorber. It is because the phase-resolved spectral analysis of each interval in Fig. 2i shows that the local absorption is not likely the dominant factor for pulsation, and the apparent correlation between the absorption and the pulse phase seen in the full interval (Figs. 2c and 2f) is likely the results of the temporal evolution. For instance, the trailing hard X-ray component during the ingress to the off-phase can be due to Comptonized reflection from the accretion stream. Alternatively, the soft X-rays may be mainly from a halo around the bottom of the accretion column at the NS surface (e.g., Davidson & Ostriker, 1973; Lyubarskii & Syunyaev, 1988; Kraus et al., 2003), which can explain the total absence of the soft component during the off-phases in the pulse profile (red in Fig. 2e). A circular emission spot on the surface of a pulsar can produce the observed eclipse-like feature in the pulse profile when combined with general relativistic effects (e.g., Wang & Welter, 1981).
The remarkable variation in the X-ray emission from SXP214 indicates that the NS was caught while crossing the circumstellar disk of the companion Be star. X-ray observations provide a rare opportunity to study the properties of the circumstellar disk and the emission geometry of the NS surface.
7. Acknowledgement
VA acknowledges financial support from NASA/Chandra grants GO3-14051X, AR4-15003X, NNX15AR30G and NASA/ADAP grant NNX10AH47G. AZ acknowledges financial support from NASA/ADAP grant NNX12AN05G and funding from the European Research Council under the European Union’s Seventh Framework Programme (FP/2007-2013)/ERC Grant Agreement n. 617001. JD, PP, and TG acknowledge financial support from NASA contract NAS8-03060. MS acknowledges support by the the Deutsche Forschungsgemeinschaft through the Heisenberg Programme (SA 2131/3-1). SL acknowledges financial support from NASA/ADAP grant NNX14-AF77G. The OGLE project has received funding from the National Science Centre, Poland, grant MAESTRO 2014/14/A/ST9/00121 to AU. We thank the anonymous referee for helpful comments and suggestions.
References
- Antoniou et al. (2016) Antoniou, V. et al., 2016, in preparation
- Cheng et al. (2014) Cheng, Z.-Q., Shao, Y., & Li, X.-D. 2014, ApJ, 786, 128
- Coe et al. (2011) Coe, M. J., Haberl, F., Sturm, R., et al. 2011, MNRAS, 414, 3281 (C11)
- Coe et al. (2015) Coe, M. J., Bartlett, E. S., Bird, A. J., et al. 2015, MNRAS, 447, 2387
- Coe & Kirk (2015) Coe, M. J., & Kirk, J. 2015, MNRAS, 452, 969
- Davidson & Ostriker (1973) Davidson, K., & Ostriker, J. P. 1973, ApJ, 179, 585
- Dickey & Lockman (1990) Dickey, J. M., & Lockman, F. J. 1990, ARA&A, 28, 215
- Grindlay et al. (2005) Grindlay, J. E., Hong, J., Zhao, P., et al. 2005, ApJ, 635, 920
- Haberl & Sturm (2015) Haberl, F., & Sturm, R. 2015, arXiv:1511.00445
- Haberl et al. (1989) Haberl, F., White, N. E., & Kallman, T. R. 1989, ApJ, 343, 409
- Hong et al. (2004) Hong, J., Schlegel, E. M., & Grindlay, J. E. 2004, ApJ, 614, 508
- Hong et al. (2005) Hong, J., van den Berg, M., Schlegel, E. M., et al. 2005, ApJ, 635, 907
- Hong (2012) Hong, J. 2012, MNRAS, 427, 1633
- Hong et al. (2016) Hong, J. et al., 2016, in preparation
- Horne & Baliunas (1986) Horne, J. H., & Baliunas, S. L. 1986, ApJ, 302, 757
- Ghosh & Lamb (1979) Ghosh, P., & Lamb, F. K. 1979, ApJ, 234, 296
- Lyubarskii & Syunyaev (1988) Lyubarskii, Y. E., & Syunyaev, R. A. 1988, Soviet Astronomy Letters, 14, 390
- Kraus et al. (2003) Kraus, U., Zahn, C., Weth, C., & Ruder, H. 2003, ApJ, 590, 424
- Klus et al. (2014) Klus, H., Ho, W. C. G., Coe, M. J., Corbet, R. H. D., & Townsend, L. J. 2014, MNRAS, 437, 3863 (K14)
- Knigge, Coe & Podsiadlowski (2011) Knigge, C., Coe, M. J., & Podsiadlowski, P. 2011, Nature, 479, 372
- Laycock et al. (2010) Laycock, S., Zezas, A., Hong, J., Drake, J. J., & Antoniou, V. 2010, ApJ, 716, 1217
- Leahy et al. (1983) Leahy, D. A., Darbro, W., Elsner, R. F., et al. 1983, ApJ, 266, 160
- Narayan & Yi (1994) Narayan, R., & Yi, I. 1994, ApJ, 428, L13
- Narayan & Yi (1995) Narayan, R., & Yi, I. 1995, ApJ, 452, 710
- Nelson et al. (1997) Nelson, R. W., Bildsten, L., Chakrabarty, D., et al. 1997, ApJ, 488, L117
- Okazaki et al. (2013) Okazaki, A. T., Hayasaki, K., & Moritani, Y. 2013, PASJ, 65,
- Reig (2007) Reig, P. 2007, MNRAS, 377, 867
- Reig (2011) Reig, P. 2011, Ap&SS, 332, 1
- Reig et al. (2016) Reig, P., Nersesian, A., Zezas, A., Gkouvelis, L., & Coe, M. J. 2016, arXiv:1603.08327
- Rivinius et al. (2013) Rivinius, T., Carciofi, A. C., & Martayan, C. 2013, A&A Rev., 21, 69
- Russell & Dopita (1992) Russell, S. C., & Dopita, M. A. 1992, ApJ, 384, 508
- Scargle (1982) Scargle, J. D. 1982, ApJ, 263, 835
- Scargle et al. (2013) Scargle, J. D., Norris, J. P., Jackson, B., & Chiang, J. 2013, ApJ, 764, 167
- Schmidtke & Cowley (2011) Schmidtke, P. C., & Cowley, A. P. 2011, The Astronomer’s Telegram, 3305, 1
- Schmidtke et al. (2013) Schmidtke, P. C., Cowley, A. P., & Udalski, A. 2013, The Astronomer’s Telegram, 4936, 1
- Shakura & Sunyaev (1973) Shakura, N. I., & Sunyaev, R. A. 1973, A&A, 24, 337
- Sidoli et al. (2005) Sidoli, L., Mereghetti, S., Larsson, S., et al. 2005, A&A, 440, 1033
- Smith (2014) Smith, N. 2014, ARA&A, 52, 487
- Suchy et al. (2008) Suchy, S., Pottschmidt, K., Wilms, J., et al. 2008, ApJ, 675, 1487-1498
- Townsend et al. (2011) Townsend, L. J., Coe, M. J., Corbet, R. H. D., & Hill, A. B. 2011, MNRAS, 416, 1556
- Wang & Welter (1981) Wang, Y.-M., & Welter, G. L. 1981, A&A, 102, 97
- Wilms et al. (2000) Wilms, J., Allen, A., & McCray, R. 2000, ApJ, 542, 914