Detection of Lyman-Alpha Emission from a Triply-Imaged Galaxy Behind MACS J2129.40741
Abstract
We report the detection of Ly emission at Å in the Keck/DEIMOS and HST WFC3 G102 grism data from a triply-imaged galaxy at behind galaxy cluster MACS J2129.40741. Combining the emission line wavelength with broadband photometry, line ratio upper limits, and lens modeling, we rule out the scenario that this emission line is [O II] at . After accounting for magnification, we calculate the weighted average of the intrinsic Ly luminosity to be and Ly equivalent width to be Å. Its intrinsic UV absolute magnitude at 1600Å is mag and stellar mass , making it one of the faintest (intrinsic ) galaxies with Ly detection at to date. Its stellar mass is in the typical range for the galaxies thought to dominate the reionization photon budget at ; the inferred Ly escape fraction is high (%), which could be common for sub- galaxies with Ly emission. This galaxy offers a glimpse of the galaxy population that is thought to drive reionization, and it shows that gravitational lensing is an important avenue to probe the sub- galaxy population.
Subject headings:
galaxies: evolution — galaxies: high-redshift — methods: data analysis — gravitational lensing: strongE-mail: ]khhuang@ucdavis.edu
1. Introduction
Galaxy cluster fields have become popular survey fields for the high-redshift universe, because strong gravitational lensing boosts the number counts in the bright end of the UV luminosity function (LF) and probes fainter intrinsic luminosities than in blank fields (e.g., Coe et al. 2015). Intrinsically fainter galaxies at are also more likely to exihibit Ly in emission, a result of correlation between UV luminosity and dust attenuation (e.g., Schaerer et al. 2011). To constrain the properties of background galaxies, one needs a precise lensing map of the galaxy cluster, constructed using the positions and redshifts of multiply-imaged background galaxies (e.g., Bradač et al. 2009); in particular, when a background galaxy has multiple images, their positions can be used to constrain the galaxy’s redshift.
Several multiply-imaged galaxies have been discovered previously. Some have their redshifts confirmed by spectroscopy through the detection of their Ly emission (e.g., Richard et al. 2011; Balestra et al. 2013; Vanzella et al. 2014), while others are not confirmed by spectroscopy but have strong constraints from both photometry and lensing to be at redshifts up to (e.g., Zitrin et al. 2014, and references therein). For the latter group of objects, gravitational lensing gives credence to the high-redshift interpretation even when no spectral features are detected, something that is not available in blank fields.
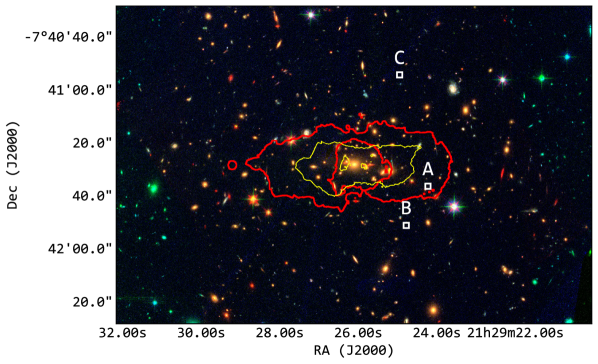
Here we report the detection of Ly emission, by both Keck/DEIMOS and HST WFC3/IR grism, from three sources lensed by the galaxy cluster MACS J2129.40741 (hereafter MACS2129; Ebeling et al. 2007) — the highest-redshift multiply-imaged system spectroscopically confirmed to date. Two of the three sources (Images A and B) are selected as Lyman Break Galaxies (LBGs) at by Bradley et al. (2014), and all three sources are considered multiple images of the same galaxy at in Zitrin et al. (2015). Based on their photometric, spectroscopic, and lensing constraints, the most natural explanation is that they are multiple images of the same galaxy at . We discuss the photometry in Section 2, the spectroscopy in Section 3, the lens modeling in Section 4, and their physical properties and implications for reionization in Section 5. We adopt the cosmological parameters , , and in our analyses, and all magnitudes are in the AB system.
| Image A | Image B | Image C | ||
|---|---|---|---|---|
| R.A. | (deg.) | 322.350936 | 322.353239 | 322.353943 |
| Decl. | (deg.) | -7.693322 | -7.697442 | -7.681646 |
| F225W | (mag) | |||
| F275W | (mag) | |||
| F336W | (mag) | |||
| F390W | (mag) | |||
| F435W | (mag) | |||
| F475W | (mag) | |||
| F555W | (mag) | |||
| F606W | (mag) | |||
| F625W | (mag) | |||
| F775W | (mag) | |||
| F814W | (mag) | |||
| F850LP | (mag) | ()bbThe F850LP data for Image A has some spurious flux that led to a nominal detection, and we exclude it from our SED fitting procedure, although including it does not change our results significantly. | ||
| F105W | (mag) | |||
| F110W | (mag) | |||
| F125W | (mag) | |||
| F140W | (mag) | |||
| F160W | (mag) | |||
| (mag) | ||||
| (mag) | ||||
| (mag) | ||||
| () | ||||
| () | ||||
| sSFR | (Gyr-1) | |||
| Age | (Myr) | |||
| ccAll three images have best-fit . | (mag) | |||
| ddEffective radii are measured in the stacked WFC3/IR images. | (kpc) | |||
| eeThe UV slope measured from the median-stacked HST images is . | ||||
| 6.5 | 5.1 | 1.4 | ||
| 9.4 | 22.1 | 5.0 | ||
| Keck DEIMOS Measurement | ||||
| (ks) | 21.6 | 40.2 | 40.2 | |
| ( erg s-1 cm-2) | ||||
| ( erg s-1) | ||||
| (Å) | ||||
| SFR | () | |||
| HST Grism Measurement | ||||
| ( erg s-1 cm-2) | ||||
| ( erg s-1 cm-2) | ||||
| (Å) | ||||
| (Å) | ||||
| (Å) | ||||
| (Å) | ||||
2. Photometric Constraints
We use deep HST and Spitzer imaging data for MACS2129 to derive photometric constraints for the three images. The HST imaging data were taken as a part of the Cluster Lensing And Supernova survey with Hubble (CLASH; Postman et al. 2012) program. We perform photometry in the same way as Huang et al. (2016): source detection is done in the coadded CLASH WFC3/IR image using SExtractor, and colors are measured in isophotal apertures. We do not match the PSFs of different HST bands because convolving each band with a PSF-matching kernel introduces additional noise and degrades the signal-to-noise ratios. We run a simple check of our HST photometry by fitting photometric redshifts () to all sources with S/N in at least three filters, and confirm that the distribution peaks within of the cluster redshift, (Postman et al. 2012).
The Spitzer/IRAC imaging data in and are obtained from SURFS UP (Bradač et al. 2014) supplemented with shallower data from The IRAC Lensing Survey (PI: Egami). The IRAC images reach a total integration time of hours in each band within the HST field of view. We follow the same procedure as in Huang et al. (2016) for IRAC photometry: the HST positions and morphologies are used as the high-resolution prior in the template-fitting code T-PHOT (Merlin et al. 2015), and IRAC PSFs are measured by stacking stellar objects found in both the main and flanking fields.
A summary of the photometric properties is listed in Table 1. We note that in the F850LP image, Image A has a nominal detection in the isophotal aperture that we think is likely spurious based on morphology. Therefore, we exclude the F850LP flux density of Image A in our analysis, although including it does not change our results significantly. Image A is also severely blended with its neighbor in the IRAC images, so we can only assign conservative upper limits to its IRAC flux densities. Both Images B and C are in relatively clean regions that are free from photometric foreground contamination, although neither has significant detections in the IRAC images.
3. Spectroscopic Constraints
3.1. Keck DEIMOS Data
We targeted MACS2129 with Keck DEIMOS on 2014 September 01, 2015 May 15–16, and 2015 October 16 (all dates are UT). All the exposures were taken under generally photometric conditions, with seeing . The slitmasks with wide slits were designed to include LBG candidates and, when slits were available, to also include targets whose photometric redshifts had considerable probability at .
The stacked 2D and 1D spectra from all observing runs are shown in Figure 2. After stacking, we obtain significant line detections around 9538Å: before correcting for slit loss, the measured line fluxes for Images A, B, and C are (, (, and ( erg s-1 cm-2, respectively. Even for Image C, we achieve a detection from the stacked 1D spectrum. We account for a slit throughput of 0.8 for a source with half-light radius of under seeing (Lemaux et al. 2009) with additional corrections made for conditions and bulk astrometric offsets. The slit loss-corrected line fluxes and Ly line luminosities are listed in Table 1.
We measure the Ly equivalent widths (EWs) of each image using the F105W magnitudes to estimate the continuum level. The EWs of each image are reported in Table 1, and the weighted average EW (by S/N) is Å. Because the S/N ratios are higher in DEIMOS data than in HST grism data (Section 3.2), we use the DEIMOS measurement as the fiducial values. The high EW, coupled with the blue rest-frame UV continuum slope (measured from the stacked HST images of the three sources), implies a high Ly escape fraction of 10% from local Ly-emitting galaxies (Hayes et al. 2014; Henry et al. 2015). The Ly escape fraction could also be crudely estimated by converting the Ly luminosity into star formation rate (SFR) and compared with the UV-derived SFR. With this method, we estimate the Ly escape fraction to be 50% assuming no dust correction for rest-frame UV flux.
We fit a truncated Gaussian profile to the stacked 1D spectrum of all images to estimate the line width and find the half width at half maximum (HWHM) on the red side of the line to be (random error only, after accounting for an instrumental resolution of 1.93Å). The emission lines for Images A and B are individually broad enough to be resolved by the 1200G grating of DEIMOS, so we measure their line asymmetries , where is the central wavelength of the emission, and () is the wavelength where the flux first exceeds 10% of the peak redward (blueward) of the peak. The line asymmetries for Images A and B are 0.35 and 0.71, consistent with the range of values for Ly emission showing depressed blue wings. Therefore, the line shapes also support the Ly interpretation.
3.2. HST Grism Data
HST WFC3/IR G102 and G141 grism data for MACS2129 were taken as part of the Grism Lens-Amplified Survey from Space (GLASS) program (Schmidt et al. 2014; Treu et al. 2015). GLASS obtained 10-orbit G102 data and 4-orbit G141 data for each cluster, aiming to probe the Ly LF at and reaching uniform sensitivity across the two grisms that continuously cover – . For each cluster field, grism data were taken in two independent position angles (PAs; 50∘ and 328∘ for MACS2129) to facilitate contamination removal.
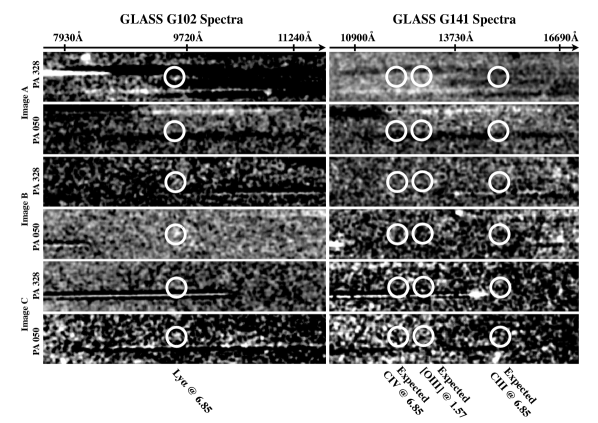
Schmidt et al. (2016) published the grism search on 159 LBGs from the first six clusters covered by GLASS, including MACS2129. They showed that 24 out of 159 LBGs have emission line detections consistent with being Ly, including Images B and C in this Letter; both sources have emission line detections around Å, corresponding to a Ly redshift . However, due to the wavelength uncertainty of the grism spectra ( Å), the Ly redshift cannot be determined to better than . We show the extracted grism spectra for all three images in Figure 3 and the measured Ly fluxes in Table 1.
Image A is not in the LBG sample of Schmidt et al. (2016) because it was not selected as an LBG at by multiple groups due to the spurious F850LP flux. But extraction of the grism spectra for Image A also shows an emission line at Å ( detection). This is observed in the ∘ spectrum not affected by contamination, consistent with being Ly emission at the same redshift as Images B and C.
Any (or all) of the three emission lines detected in grism spectra could also be the (unresolved) [O II] line at , but our Keck DEIMOS spectra do not show any signs of resolved [O II] doublets even though the spectral resolution is sufficient. Furthermore, the G141 grism data provide the wavelength coverage to detect (or rule out) [O III] emission lines at . We do not find significant detections at the expected [O III] wavelength in the G141 spectra, and the upper limits for range between 0.23 and 0.61, with a median . At , this galaxy would have had a stellar mass of and a sub-solar metallicity according to the mass-metallicity relation derived at , which implies (Henry et al. 2013). Therefore, we rule out the [O II] interpretation of the emission lines.
Other rest-frame UV nebular emission lines like C IV 1549 and C III] 1909 have been proposed as alternative features for redshift confirmation at because they are not attenuated by the intergalactic medium (e.g., Stark et al. 2015a). Detections of C IV and C III] would also allow photoionization modeling to constrain the ionization parameter and metallicity (e.g. Erb et al. 2010). The GLASS G141 spectra cover the wavelengths of both C IV and C III] at , but we do not detect any C IV or C III] emission. The expected locations of C IV and C III] in the G141 spectra are marked by white circles in Figure 3, and we list the EW limits for C IV and C III] in Table 1. The most stringent limit on the rest-frame C IV and C III] EW is Å (measured from Image A with ), still not quite sufficient to detect the typical EWs of C IV and C III] emission (Å) from low-metallicity galaxies (e.g., Stark et al. 2014; Rigby et al. 2015; Stark et al. 2015a, b). Schmidt et al. (2016) also derived a upper limit of C IV (C III]) to Ly flux ratio of () from a stack of eight Ly-emitting galaxies. Therefore, detecting the C IV and C III] emission at is still quite challenging from the available HST grism spectra.
4. Gravitational Lens Modeling
Gravitational lens modeling of MACS2129 is made difficult by the sparsity of known multiple image systems with spectroscopic redshifts. Zitrin et al. (2015) presented the first two lens models of the cluster using the CLASH photometry. While both models are constrained using 8 multiple image systems, only one of them (system 1 in Zitrin et al. 2015) was spectroscopically confirmed (see also Christensen et al. 2012). Moreover, system 1 is a rare example of a sextuply-imaged galaxy with a spectroscopic redshift ; the unusual configuration and multiplicity of this system makes the modeling challenging, and neither model reproduces the multiplicity of system 1. The Zitrin et al. (2015) models do reproduce the positions of the triple-image system accurately, but they predict that Image B is roughly twice as magnified as Image A, in disagreement with the observed ratio.
To improve the estimates of the absolute magnifications of the triply-imaged galaxy, we create a new lens model of MACS2129 using additional spectroscopic redshifts from GLASS and from CLASH-VLT (186.A-0798; PI: P. Rosati; Monna et al. in prep.). We identify a new multiple-image system that is not identified by Zitrin et al. (2015), and while we have spectroscopic redshifts for parts of other multiple-image systems, we are not confident enough in any other system as a whole. To be conservative, we model the cluster using system 1, the aforementioned new system at , and the triply-imaged system at . We employ the lens modeling method SWUnited (Bradač et al. 2005, 2009), which constrains the gravitational potential of the cluster on a grid via an iterative minimization algorithm. We find that our lens model is able to reproduce the positions and relative magnifications of the three images at , while also consistently fitting the other two systems used in the model. We therefore adopt the absolute magnifications of , , and for Images A, B, and C, respectively.
5. Discussion
We model the physical properties of the three images following the procedure outlined in Huang et al. (2016). In short, we adopt the Bruzual & Charlot (2003) (BC03) templates with and a constant star formation history (SFH), motivated by the good recovery of SFRs and stellar masses of simulated galaxies (Salmon et al. 2015). We also account for dust attenuation internal to the galaxy following the prescription in Calzetti et al. (2000), parameterized by from 0 to 1. The templates also include strong nebular emission lines, whose fluxes are determined by the Lyman continuum flux of BC03 models and nebular line ratios from Anders & Fritze-v. Alvensleben (2003). The fitting is done using the photometric redshift code EAZY (Brammer et al. 2008). In Figure 4 we show the best-fit templates at the Ly redshift and at the [O II] redshift . In the bottom right panel, we also show the photometric redshift probability distribution for each image. All three images have more consistent with the Ly redshift than with the [O II] redshift based on the total values.
The modeling results are summarized in Table 1, where we report the best-fit values, 68% confidence intervals (and 84 percentile upper limits where they apply). After accounting for lens magnification, we find that this galaxy has rest-frame 1600Å absolute magnitude (converted from the observed F125W magnitudes) of mag, stellar mass of , SFR of , and specific SFR (sSFR) of (all are S/N-weighted averages). The galaxy is also best fit by a very young ( old), dust-free template. The rest-frame UV slope —measured from the median-stacked images—is , although the errors are large due to low S/N in the WFC3/IR filters. The results suggest that this galaxy is one of the intrinsically faintest Ly-emitting galaxy confirmed at to date; its rest-frame UV luminosity is roughly (adopting ; Bouwens et al. 2015), well into the faint end of the UV LF. With the detection of Ly emission from this galaxy (and from other similar galaxies), we start to probe the likely sources that dominated reionization: the low-mass, young, and (almost) dust-free galaxies (e.g., Robertson et al. 2015).
Recently, several galaxies at have been confirmed via their Ly emission (e.g., Oesch et al. 2016, Song et al. 2016, and references therein). Most of these galaxies are surprisingly bright, with ranging from to mag; some of the aforementioned galaxies are selected based on their unusual Spitzer/IRAC colors, which imply very high [O III] or H EWs. Due to the depths of the available Spitzer imaging data, galaxies identified this way are mostly the bright ones (e.g., Roberts-Borsani et al. 2015). It is possible that these bright galaxies are sitting in overdense regions inside local HII bubbles that enhance Ly transmission (Dijkstra 2014, and references therein) and offer a biased view of the reionization due to cosmic variance (Trenti & Stiavelli 2008). On the other hand, fainter galaxies hosted by halos with mass are more likely to dominate the ionizing photon budget, the details of which will depend on a few factors like gas cooling, supernovae feedback, and ionizing photon escape fraction (e.g., Mesinger et al. 2016). So far all of the sub- galaxies at confirmed via their Ly emissions are detected behind galaxy clusters (see also Bradač et al. 2012 and Balestra et al. 2013); a larger sample of spectroscopically confirmed galaxy will be valuable for understanding the reionization process, e.g., through the Ly fraction among LBGs (Pentericci et al. 2014).
In several ways, the galaxy probed here is similar to the galaxy detected behind MACS07173745 (Vanzella et al. 2014). Both galaxies have faint UV luminosities (), low stellar masses (), Ly HWHM of – km s-1, and possibly high Ly escape fractions (%). Perhaps the best local analogs of both galaxies are the Green Pea galaxies (e.g., Henry et al. 2015), which have high Ly EWs (–Å), low stellar masses (–), and blue UV slopes ( to ) that suggest very low dust content. The detections of these sub- galaxies at are made possible due to gravitational lensing, which will be the most efficient way to detect galaxies even in the JWST era.
We thank the referee for constructive feedback of this work. We also thank Piero Rosati and Anna Monna for providing spectroscopic redshifts from the CLASH-VLT program. This work is based on observations made with the NASA/ESA Hubble Space Telescope, obtained at the Space Telescope Science Institute, which is operated by the Association of Universities for Research in Astronomy, Inc., under NASA contract NAS5-26555 and NNX08AD79G and ESO-VLT telescopes. Observations were carried out using Spitzer Space Telescope, which is operated by the Jet Propulsion Laboratory, California Institute of Technology under a contract with NASA. Support for this work is provided by NASA through a Spitzer award issued by JPL/Caltech, HST-AR-13235, HST-GO-13459, and HST-GO-13177. AH acknowledges support by NASA Headquarters under the NASA Earth and Space Science Fellowship Program Grant ASTRO14F-0007.
References
- Anders & Fritze-v. Alvensleben (2003) Anders, P., & Fritze-v. Alvensleben, U. 2003, A&A, 401, 1063
- Balestra et al. (2013) Balestra, I., Vanzella, E., Rosati, P., et al. 2013, A&A, 559, L9
- Bouwens et al. (2015) Bouwens, R. J., Illingworth, G. D., Oesch, P. A., et al. 2015, ApJ, 803, 34
- Bradač et al. (2005) Bradač, M., Erben, T., Schneider, P., et al. 2005, A&A, 437, 49
- Bradač et al. (2009) Bradač, M., Treu, T., Applegate, D., et al. 2009, ApJ, 706, 1201
- Bradač et al. (2012) Bradač, M., Vanzella, E., Hall, N., et al. 2012, ApJ, 755, L7
- Bradač et al. (2014) Bradač, M., Ryan, R., Casertano, S., et al. 2014, ApJ, 785, 108
- Bradley et al. (2014) Bradley, L. D., Zitrin, A., Coe, D., et al. 2014, ApJ, 792, 76
- Brammer et al. (2008) Brammer, G. B., van Dokkum, P. G., & Coppi, P. 2008, ApJ, 686, 1503-1513
- Bruzual & Charlot (2003) Bruzual, G., & Charlot, S. 2003, MNRAS, 344, 1000
- Calzetti et al. (2000) Calzetti, D., Armus, L., Bohlin, R. C., et al. 2000, ApJ, 533, 682
- Christensen et al. (2012) Christensen, L., Richard, J., Hjorth, J., et al. 2012, MNRAS, 427, 1953
- Coe et al. (2015) Coe, D., Bradley, L., & Zitrin, A. 2015, ApJ, 800, 84
- Dijkstra (2014) Dijkstra, M. 2014, PASA, 31, e040
- Ebeling et al. (2007) Ebeling, H., Barrett, E., Donovan, D., et al. 2007, ApJ, 661, L33
- Erb et al. (2010) Erb, D. K., Pettini, M., Shapley, A. E., et al. 2010, ApJ, 719, 1168
- Hayes et al. (2014) Hayes, M., Östlin, G., Duval, F., et al. 2014, ApJ, 782, 6
- Henry et al. (2013) Henry, A., Scarlata, C., Domínguez, A., et al. 2013, ApJ, 776, L27
- Henry et al. (2015) Henry, A., Scarlata, C., Martin, C. L., & Erb, D. 2015, ApJ, 809, 19
- Huang et al. (2016) Huang, K.-H., Bradač, M., Lemaux, B. C., et al. 2016, ApJ, 817, 11
- Lemaux et al. (2009) Lemaux, B. C., Lubin, L. M., Sawicki, M., et al. 2009, ApJ, 700, 20
- Merlin et al. (2015) Merlin, E., Fontana, A., Ferguson, H. C., et al. 2015, A&A, 582, A15
- Mesinger et al. (2016) Mesinger, A., Greig, B., & Sobacchi, E. 2016, arXiv:1602.07711
- Monna et al. (2014) Monna, A., Seitz, S., Greisel, N., et al. 2014, MNRAS, 438, 1417
- Oesch et al. (2016) Oesch, P. A., Brammer, G., van Dokkum, P. G., et al. 2016, ApJ, 819, 129
- Pentericci et al. (2014) Pentericci, L., Vanzella, E., Fontana, A., et al. 2014, ApJ, 793, 113
- Postman et al. (2012) Postman, M., Coe, D., Benítez, N., et al. 2012, ApJS, 199, 25
- Richard et al. (2011) Richard, J., Kneib, J.-P., Ebeling, H., et al. 2011, MNRAS, 414, L31
- Rigby et al. (2015) Rigby, J. R., Bayliss, M. B., Gladders, M. D., et al. 2015, ApJ, 814, L6
- Robertson et al. (2015) Robertson, B. E., Ellis, R. S., Furlanetto, S. R., & Dunlop, J. S. 2015, ApJ, 802, L19
- Roberts-Borsani et al. (2015) Roberts-Borsani, G. W., Bouwens, R. J., Oesch, P. A., et al. 2015, arXiv:1506.00854
- Salmon et al. (2015) Salmon, B., Papovich, C., Finkelstein, S. L., et al. 2015, ApJ, 799, 183
- Schaerer et al. (2011) Schaerer, D., de Barros, S., & Stark, D. P. 2011, A&A, 536, A72
- Schmidt et al. (2014) Schmidt, K. B., Treu, T., Brammer, G. B., et al. 2014, ApJ, 782, L36
- Schmidt et al. (2016) Schmidt, K. B., Treu, T., Bradač, M., et al. 2016, ApJ, 818, 38
- Song et al. (2016) Song, M., Finkelstein, S. L., Livermore, R. C., et al. 2016, arXiv:1602.02160
- Stark et al. (2014) Stark, D. P., Richard, J., Siana, B., et al. 2014, MNRAS, 445, 3200
- Stark et al. (2015a) Stark, D. P., Richard, J., Charlot, S., et al. 2015, MNRAS, 450, 1846
- Stark et al. (2015b) Stark, D. P., Walth, G., Charlot, S., et al. 2015, MNRAS, 454, 1393
- Trenti & Stiavelli (2008) Trenti, M., & Stiavelli, M. 2008, ApJ, 676, 767-780
- Treu et al. (2015) Treu, T., Schmidt, K. B., Brammer, G. B., et al. 2015, ApJ, 812, 114
- Vanzella et al. (2014) Vanzella, E., Fontana, A., Zitrin, A., et al. 2014, ApJ, 783, L12
- Zitrin et al. (2014) Zitrin, A., Zheng, W., Broadhurst, T., et al. 2014, ApJ, 793, L12
- Zitrin et al. (2015) Zitrin, A., Fabris, A., Merten, J., et al. 2015, ApJ, 801, 44
- Zitrin et al. (2015) Zitrin, A., Ellis, R. S., Belli, S., & Stark, D. P. 2015, ApJ, 805, L7