A model for the clustered distribution of SNPs in the human genome
Abstract
Motivated by a non-random but clustered distribution of SNPs, we introduce a phenomenological model to account for the clustering properties of SNPs in the human genome. The phenomenological model is based on a preferential mutation to the closer proximity of existing SNPs. With the Hapmap SNP data, we empirically demonstrate that the preferential model is better for illustrating the clustered distribution of SNPs than the random model. Moreover, the model is applicable not only to autosomes but also to the X chromosome, although the X chromosome has different characteristics from autosomes. The analysis of the estimated parameters in the model can explain the pronounced population structure and the low genetic diversity of the X chromosome. In addition, correlation between the parameters reveals the population-wise difference of the mutation probability. These results support the mutational non-independence hypothesis against random mutation.
keywords:
single nucleotide polymorphism , mutation , human genome , probability distribution , Hapmap1 INTRODUCTION
The most common type of genetic variants in the human genome is the single nucleotide polymorphism (SNP), which, as a result of mutation, has a difference in a single nucleotide within a population of samples [1]. SNP data, together with gene expression and other biological information, are an important resource to answer various biological questions regarding the genetic variation, such as the mutational pattern of the genome, the phylogenetic classification, and the association with phenotype data.
In recent years, as the cost of genotyping has dropped dramatically due mainly to the advance in the genotyping technology [2, 3], much effort has been put into the identification of SNPs in the human genome [4, 5]. Notably, the International HapMap project [4] (hereafter, Hapmap) is an international effort to identify the genetic variation in the human genome to develop a haplotype map. Although Hapmap includes some datasets on the copy number variation, SNP data are the main resource not only for understanding and characterizing the differences in genome structure but for association studies with diseases and/or environmental factors.
It has been known that SNPs in the human genome are not distributed randomly but clustered across the genome [6, 7, 8, 9, 10]. This clustering property suggests that mutations tend to occur not randomly but preferentially to the proximity of existing mutations. In addition to the interpretation of the clustering as the reflection of mutational hotspots [11], clustered SNPs can emerge in various ways. Natural and balancing selections can modulate local variability and tend to create regions of increased variability that results in non-randomness [12]. A high variance of genes within a population of samples in the time to the most recent common ancestor causes different recombination rates in a chromosome [13]. It was also proposed that microsatellites can also generate mutational biases in their flanking regions by expansion and erosion from the perspective of microsatellite evolution [14, 15, 16]. Clustered SNPs can also arise from ascertainment biases in the SNP discovery process [17]. Examples include the SNP identification based on maximally dissimilar sequences, the usage of not enough samples, and finding all possible SNPs not on a whole genome but on a given region of a chromosome.
However, when SNP clusters are found throughout a whole genome with a large number of samples from different global populations, it is unlikely that the observed clusters would be due to ascertainment biases. Thus, as pointed out in Ref. [6], the majority of SNP markers along a whole genome should reflect the underlying mutation pattern. In this respect, a non-random mutation process was proposed and tested against the random mutation by generating a semi-realistic population of chromosomes from stochastic computer simulations that implements the concept of ‘the sphere of influence’ [6]. As millions of SNPs on a whole genome are now available in public domains, the mutation pattern can be systematically investigated.
In this paper, we propose a probabilistic model for the clustered distribution of SNPs. The proposed model assumes non-independent mutations in which subsequent mutations occur not randomly but preferentially to near mutated sites. Within the model, SNP clusters could form mainly through a non-negligible tendency of the mutation process in the closer proximity of existing SNPs. The proposed model was tested against Hapmap SNP data and the proposed model was confirmed as suitable to explain empirical SNP distributions of the human genome. We also tested the proposed model against the random mutation model in which all mutations occur independently, and we confirm that the proposed model explains the distribution more appropriately than the random model.
As the X chromosome is a haploid in males, its SNP distribution may have characteristics different from the distributions of the autosomes. With the estimated parameters in the proposed model, we characterized the clustered SNP distributions obtained from different chromosomes, including the X chromosome. Whereas the proposed model is valid irrespective of the ploidy (i.e., either diploid or haploid), our analysis of estimated parameters accounts for the characteristics, such as the pronounced population structure and the low mutation rate, specific to the X chromosome.
2 MATERIALS AND METHODS
2.1 Data
We use the genome-wide Hapmap SNP data of Phase III, which consists of 1,440,616 SNPs in 1184 reference individuals from 11 global ancestry groups of three continental regions. The data are publicly available and can be downloaded at http://hapmap.ncbi.nlm.nih.gov/. To investigate the population-specific differences, we extracted SNPs that are polymorphic within each of a single population. For each of 11 global populations, we analyzed SNP distributions on 22 autosomes and the X chromosome. Generally, the number of SNPs depends on the number of samples, the chromosome, and the genetic diversity of the population. Thus, the number of identified SNPs may fluctuate with populations and chromosomes.
Table 1 shows the number of SNPs identified in each population summed over all chromosomes and each chromosome averaged over 11 global populations. The number of SNPs for each population in Table 1 roughly illustrates the regional difference in the genetic diversity. The populations that originated from Africa (ASW, LWK, MKK, YRI) have a larger number of SNPs than other continental regions, indicating a higher genetic diversity. On the other hand, the population from Asia (CHB, CHD, JPT) have a smaller number of SNPs and a lower genetic diversity than others.
| pop. name | chr. | chr. | |||
|---|---|---|---|---|---|
| ASW | 1,399,533 | 1 | 102,848 | 13 | 46,752 |
| CEU | 1,269,095 | 2 | 103,994 | 14 | 40,899 |
| CHB | 1,181,090 | 3 | 86,600 | 15 | 37,884 |
| CHD | 1,173,514 | 4 | 77,006 | 16 | 39,392 |
| GIH | 1,260,550 | 5 | 79,132 | 17 | 33,734 |
| JPT | 1,154,331 | 6 | 82,545 | 18 | 36,802 |
| LWK | 1,366,422 | 7 | 67,937 | 19 | 23,092 |
| MEX | 1,324,625 | 8 | 67,576 | 20 | 32,426 |
| MKK | 1,385,579 | 9 | 57,444 | 21 | 17,557 |
| TSI | 1,266,622 | 10 | 66,389 | 22 | 17,826 |
| YRI | 1,340,306 | 11 | 63,333 | X | 41,408 |
| 12 | 61,202 | total | 1,283,778 |
The clustering property of SNPs can be represented by taking the ordered locations of all SNPs and examining how proximate they are located. We quantify the proximity of SNPs in terms of the SNP space, which is defined as the number of nucleotides between two adjacent SNPs in their ordered locations. Specifically, let be the location, in the number of nucleotides counting from of a sequence, of the th SNP in a chromosome. Then, the th SNP space is defined as
| (1) |
2.2 Random model
An SNP is the result of a mutation and it is commonly assumed that the mutation arises randomly in DNA sequence. Under this assumption, we tested the hypothesis that SNPs are distributed randomly in a sequence. In the random mutation model, mutations occur independently of each other with a constant probability of . With the random model, the probability distribution of the SNP space defined in Eq. (1) can be derived as follows. Suppose that an SNP is found at the location . Then, the probability of finding a subsequent SNP at the location is given as
| (2) |
Note that Eq. (2) is the probability mass function of a geometric distribution [18]. The geometric distribution is the discrete analogue of the exponential distribution and has a property of being memoryless. The distribution is often used for modeling the number of trials until the first success, in our case, an SNP.
By taking a logarithm on the both sides of Eq. (2), we get
| (3) |
This illustrates that is linear in with being the proportionality, or a slope. The parameter can be estimated, for example, by the maximum likelihood estimation (MLE). Thus, if mutations occur randomly, we expect that should be a straight line in with a negative slope of .
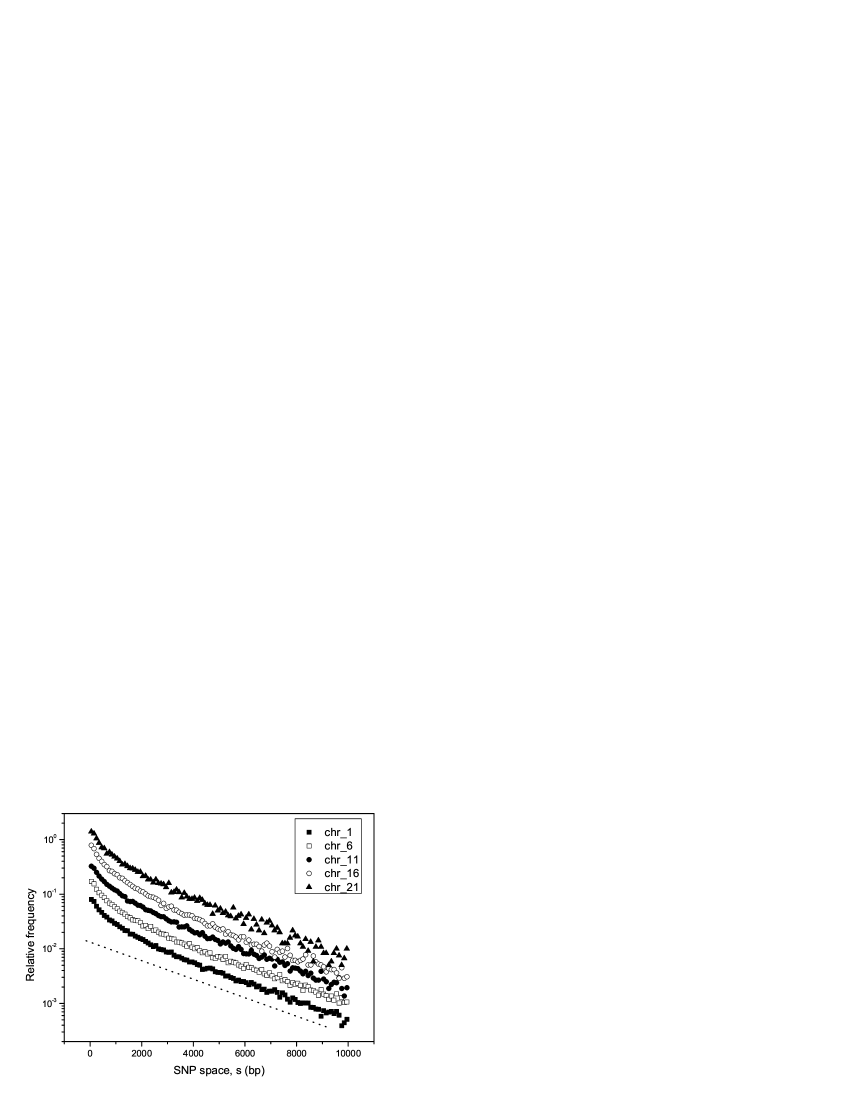
In Fig. 1, we plot the empirical distribution of the SNP spacing for different chromosomes of ASW. A comparison with the random model reveals that the empirical distributions do not follow a geometric distribution (the dotted line), especially for small values of in which the major deficiency of the model occurs. In particular, Fig. 1 shows that the probability increases sharply and non-linearly as becomes small which suggests that the SNPs are clustered. This tendency of the distribution is more or less independent of the chromosome. This reflects that SNPs are distributed not randomly, but clustered. From these we can infer that the random mutation hypothesis is inadequate to explain the clustering property of SNPs.
2.3 Proposed model
The clustered SNPs imply that when a mutation occurs, another mutation is more likely to occur as they are closer in their locations. This suggests that the mutation probability is not independent of the location but dependent on how close the mutations are in their locations. This non-independent mutation can be modeled after the mutation probability being inversely proportional to some power of the separation in nucleotides between two consecutive mutations. Formally, given that a mutation occurs at the location , the probability of the next mutation at can be expressed as
| (4) |
with and .
The proposed model contains two parameters, and , to be estimated. The is the probability of two mutations occurring consecutively in genomic locations, and the is the strength of the mutational non-independence. The larger is , the smaller mutation probability as increases. In particular, when , the proposed model reduces to the random model of Section 2.2.
It should be noted that the proposed model is a phenomenological model to account for the observed clustered SNP distributions, rather than a model based on molecular mechanism. That is, the phenomenological model does not implement any biological mechanism of mutation, such as the heterozygote instability. Rather, this model is based on the fact that if the mutation does not occur randomly, there must be some dependence on the SNP space.
With the proposed model, the probability of SNP space is given, for , as
| (5) | |||||
Or, by taking a logarithm of Eq. (5), we have
| (6) |
As the right hand side of Eq. (6) is intractable analytically and even computationally, we resort to an approximate expression.
It is known that there is one SNP in roughly every 1,000 base pairs. Thus, we assume and expand around to the first order in to get
| (7) |
Using an integral approximation of
| (8) |
and the Stirling’s formula of , Eq. (6) can be expressed approximately as
| (9) |
To show that the probability of in the random model [Eq. (3)] is a special case of Eq. (9), we expand Eq. (3) to the first order in to get
| (10) |
The parameters and in the proposed model can be estimated, for example, by MLE. Under the assumption that empirical SNP space data are independent and identically distributed samples, we consider the log-likelihood . It is given as
| (11) |
With the log-likelihood and MLE, we can estimate the parameters of and by solving two equations,
| (12) |
simultaneously using, for instance, an iterative method [19].
Although the phenomenological model that we used in this study is much simpler and unrealistic than the heterozygote instability model, the phenomenological model is intractable mathematically unless we make approximations. Thus, more realistic model such as the heterozygote instability model is not easy to implement mathematically and/or analytically. This is one of reasons why any biologically plausible process hardly be modeled mathematically.
3 RESULTS AND DISCUSSION
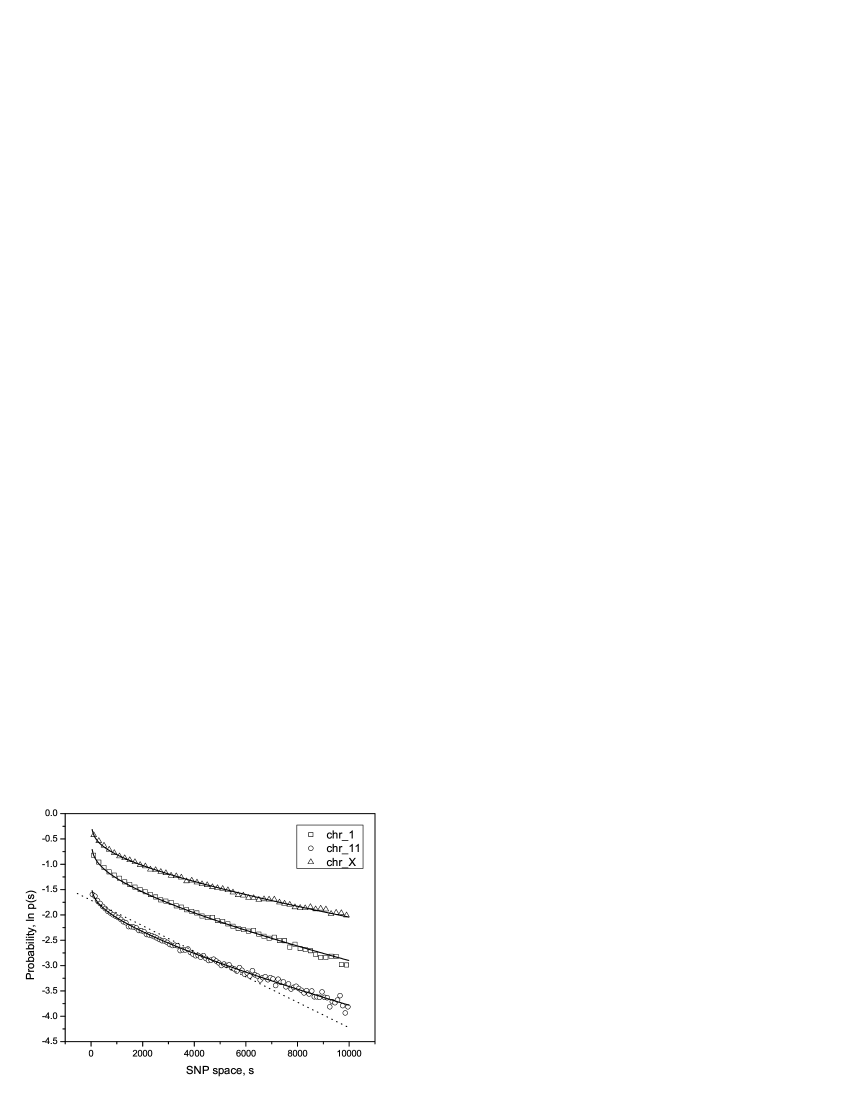
Using Hapmap SNP data, we estimate two parameters and for all chromosomes of each single population. With the estimated parameters, we present a few , together with the corresponding empirical distributions in Fig. 2. As shown in Fig. 2, the model distribution fits well to the empirical distribution, especially to small of non-linearly increasing region representing clustered SNPs. Moreover, Fig. 2 demonstrates that the proposed model is equally applicable not only to the autosomes but to the X chromosome. We also see that the proposed model is more adequate than the random model (dotted line in Fig. 2). This result supports, at least partially if not entirely, the non-independent mutation hypothesis.
As the X chromosome is haploid in males, it has smaller population size than the autosome has. Thus, we may expect that the clustering property of SNPs on the X chromosome may differ from that on the autosomes [6]. A consequence of a smaller population size of the X chromosome is a low abundance in SNPs. It is known that the nucleotide mutation rate in females is much lower than in males [20]. The smaller population size and low mutation rate result in the genetic diversity of the X chromosome about a half of that of the autosomes [21]. Thus, we expect that SNPs on the X chromosome to be about half abundance that of the autosomes [6, 21]. From the clustering perspective, this implies that SNPs on the X chromosome are less clustered than those on the autosomes in the sense that the average of SNP space over the X chromosome is larger than that over the autosomes. That is, larger is more probable on the X chromosome than on the autosomes. This characteristic can also be seen by the visual inspection of Fig. 2.
To measure the abundance in SNPs, we fit the empirical distribution of in terms of a linear function (i.e., the random model of Eq. (3)) in so that the slope of the fitted function approximately quantify the degree of clusteredness. We estimated the slope for all chromosomes, and found that the slopes were in the range of for the autosomes and for the X chromosome. The fact that the slope for the X chromosome is less steep than that for the autosomes quantitatively supports the low abundance and fewer clusters of SNPs on the X chromosome.
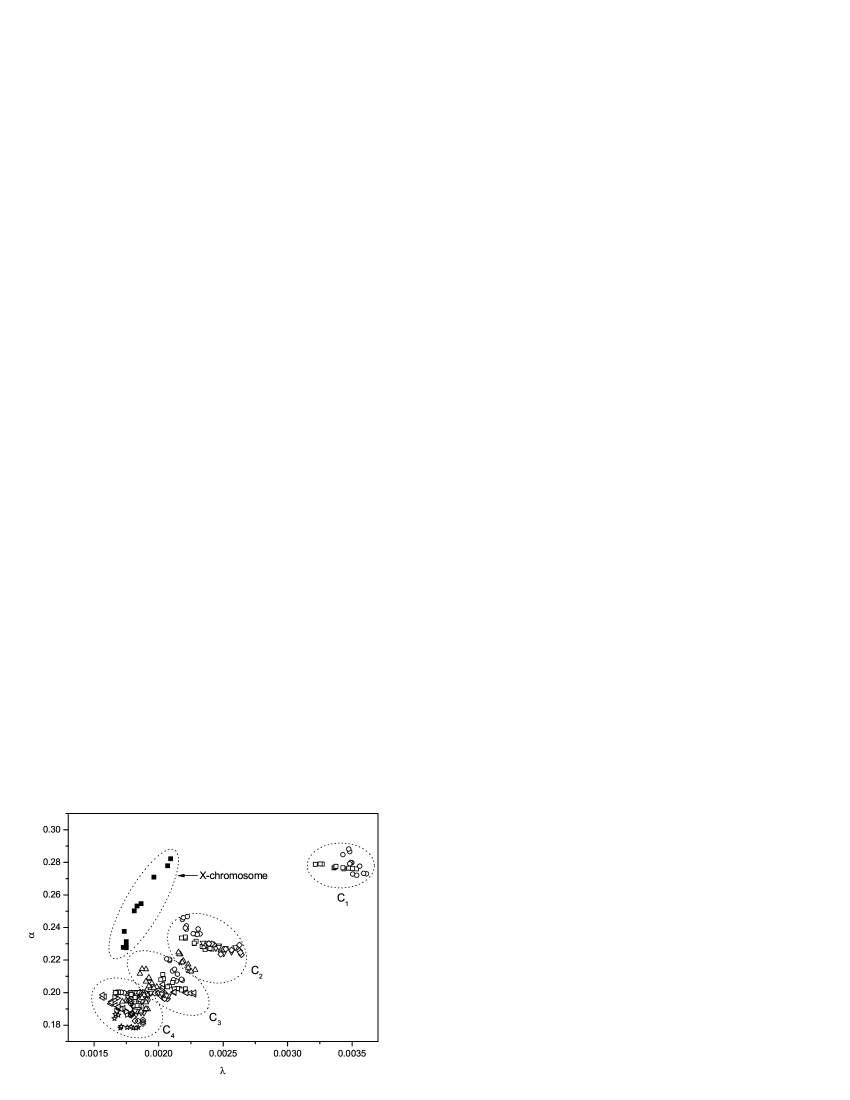
Based on the finding that the proposed model can explain the clustering property of SNPs, we further analyze the estimated parameters of the proposed model. Figure 3 plots estimated versus using SNP data on 23 chromosomes from each of 11 global populations. From Fig. 3, we see that the parameters for the X chromosome exhibits a larger variation across 11 global populations than those for the autosomes. Being a haploid, the smaller population size of the X chromosome has a faster genetic drift than the autosomes. Consequently, the population structure (or population stratification) of the X chromosome should be more pronounced than that of the autosomes [21]. Given that the population structure implies the presence of a systematic difference in allelic frequencies between global populations, we expect that chromosomes having pronounced population structure should have higher dissimilarity in their allele between populations, which, in turn, induces higher variability in clustered SNP distribution. Thus, the comparatively large variation of the X chromosome across the populations is evidence of its pronounced population structure.
We also clustered autosomes according to their estimated parameters of by using the k-means algorithm [22] with the number of clusters , suggested by the method for determining [23]. The result of cluster analysis of 22 autosomes are shown in Fig. 3. The cluster analysis result demonstrates that chromosomes in the same cluster (for instance, chromosomes 9 and 16 in ) have similar degree of clustered SNPs in terms of their probability distribution of the SNP space.
From the finding that , we can further approximate Eq. (9) to investigate the mutational non-independence. By expanding Eq. (9) to the first order in , it can be approximated as
| (13) |
One way to express the mutational non-independence part is the difference between logarithmic probabilities of Eq. (13) and Eq. (10). By identifying , we have
| (14) |
Note that the non-random part depends not only on the parameters and , but also the SNP space . Since as we have seen in Fig. 3, we can approximate the behavior of for both large and small values of . When , we have , and . This indicates that the non-random part is insensitive to for , which implies that the mutational non-independence is negligible. Whereas, when , we have . This suggests that as becomes smaller, the non-random part increases, which is consistent with the results that can be found, for instance, in Fig. 1.
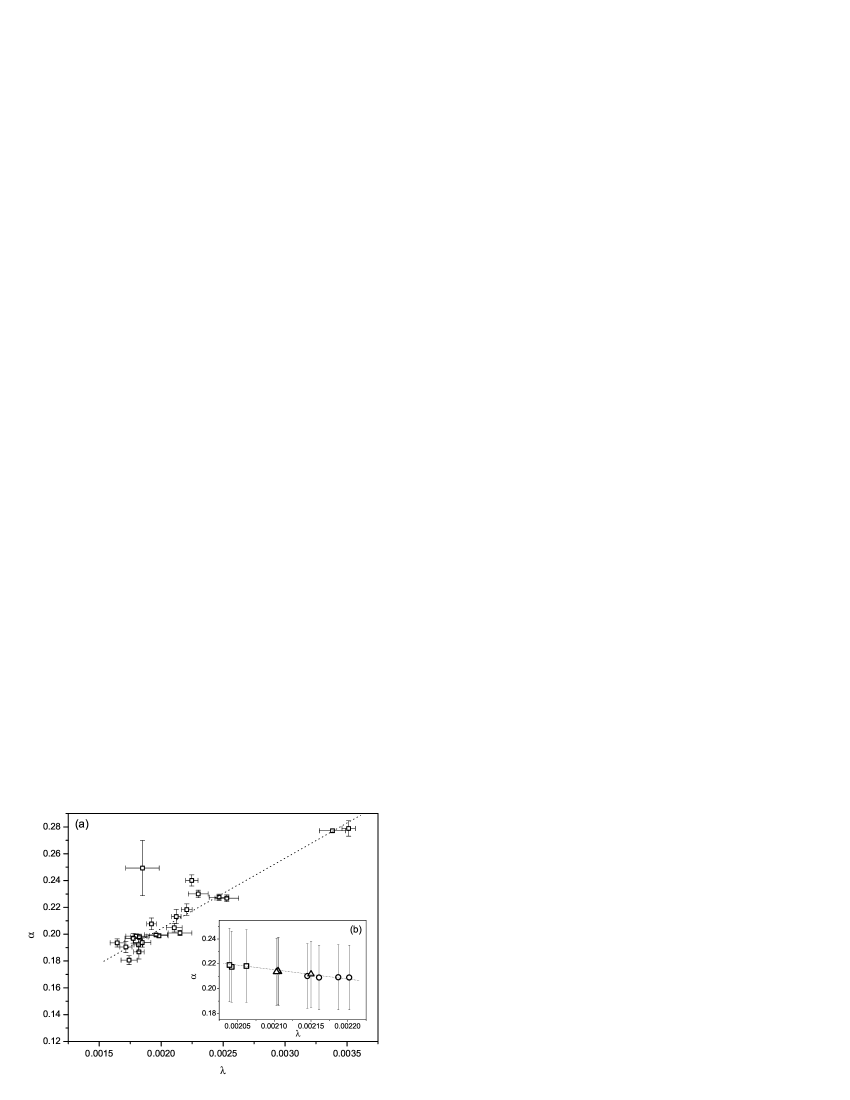
To investigate the chromosome and population specific characteristics, we represent the estimated parameters that are averaged over 11 global populations for each chromosome in Fig. 4 (a), and those that are averaged over 23 chromosomes for each single population in Fig. 4 (b). We found that the estimated parameters have smaller variation across the chromosomes [Fig. 4 (a)] than across the populations [Fig. 4 (b)]. This implies that the clustering property depends more on the chromosome than on the population. In particular, among the variations across chromosomes, Fig. 4 (a) shows that the chromosome X has higher variability than the autosomes whose cause was discussed before.
Aside from the deviations, we uncovered that the two parameters are positively correlated over all autosomes, whereas they are negatively correlated over the global populations. The mutation probability of Eq. (4) increases (or decreases) as (or ) increases. This implies that, when the parameters are positively correlated, the increase in is compensated for by the increase in , and vice-verse. Thus, the positive correlation over autosomes demonstrates that the mutation probability stays more or less the same for all autosomes.
On the other hand, the negative correlation over the global populations illustrates that the mutation rate depends on the estimated values of (or ) of the population. That is, as increases, a negatively correlated decreases; as a result, the mutation probability of Eq. (4) increases. Thus, the larger the (or the smaller ) with a single population, the higher its mutation probability. It turns out that the populations that originated from Africa have a larger than those from Asia as indicated in Fig. 4 (b).
4 SUMMARY AND CONCLUSION
In this study, we proposed a non-random mutation model to explain the clustered distribution of SNPs in the human genome. The proposed model takes into account the dependence of the mutation probability on the space between two adjacent SNPs. The proposed model was tested against Hapmap data by deriving the SNP space distribution from the model. The probability distribution derived from the proposed model was in good agreement with empirical distributions. Furthermore, the proposed model was comprehensive in the sense that it explains the clustered distribution of SNPs not only on the autosomes but on the X chromosome. This suggests that the observed SNP distributions of all chromosomes are different realization of the same model. We also showed that the proposed model was more adequate than the random mutation model.
The parameters in the proposed model are used to demonstrate the chromosome- and population-wise different characteristics of the SNP distribution. From the fact that the X chromosome is haploid in males, the X chromosome has a more pronounced population structure and a lower abundance in SNPs than the autosomes. These characteristics were understood by a comparison of the parameters for the X chromosome with those for the autosomes. The correlation between and can be used to illustrate the dependence of the mutation probability and genetic diversities on the different populations.
This study introduces a phenomenological model for the clustered SNP distribution in the human genome. Further investigations, such as the feature of evolutionary transience of SNP clusters and phylogenetic reconstruction, are desirable and should be carried out as a future direction of study.
Acknowledgments
This work was supported by the Korea Research Foundation Grant funded by the Korean Government (MOEHRD) (KRF-2015018708).
References
- Barreiro et al., [2008] Barreiro,L. et al (2008) Natural selection has driven population differentiation in modern humans, Nat. Genet., 40, 340-345.
- Metzker, [2010] Metzker,M. (2010) Sequencing technologies-the next generation, Nat. Rev. Genet., 11, 31-46.
- LaFramboise, [2009] LaFramboise,T. (2009) Single nucleotide polymorphism arrays: a decade of biological, computational and technological advances, Nucleic Acids Res., 37, 4181-4193.
- International HapMap Consortium, [2010] International HapMap Consortium (2005) A haplotype map of the human genome, Nature, 437, 1299-320; International HapMap Consortium (2007) A second generation human haplotype map of over 3.1 million SNPs, Nature, 449, 851-861; The International HapMap 3 Consortium (2010) Integrating common and rare genetic variation in diverse human populations, Nature, 467, 52-58.
- The 1000 Genomes Project Consortium, [2012] The 1000 Genomes Project Consortium (2010) A map of human genome variation from population-scale sequencing, Nature, 467, 1061-1073; The 1000 Genomes Project Consortium (2012) An integrated map of genetic variation from 1,092 human genomes, Nature, 491, 56-65.
- Amos, [2010] Amos,W. (2010) Even small SNP clusters are non-randomly distributed: is this evidence of mutational non-independence?, Proc. R. Soc. B, 277, 1443-1449.
- Tenaillon et al., [2008] Tenaillon,M.I. et al (2008) Apparent mutational hotspots and long distance linkage disequilibrium resulting from a bottleneck, J. Evol. Biol., 21, 541-550.
- Koboldt et al., [2006] Koboldt,D. et al (2006) Distribution of Human SNPs and Its Effect on High-Throughput Genotyping, Hum. Mutat., 27, 249-254.
- Hellmann et al., [2005] Hellmann,I. et al (2005) Why do human diversity levels vary at a megabase scale?, Genome Res. 15, 1222-1231.
- Lindblad-Toh et al, [2000] Lindblad-Toh,K. et al (2000) Large-scale discovery and genotyping of single-nucleotide polymorphisms in the mouse, Nat. Genet., 24, 381-386.
- Rogozin and Pavlov, [2003] Rogozin,I.B. and Pavlov,Y.I. (2003) Theoretical analysis of mutation hotspots and their sequence context specificity, Mut. Res., 544, 65-85.
- Bubb et al., [2006] Bubb,K.L. et al (2006) Scan of human genome reveals no new loci under ancient balancing selection, Genetics, 173, 2165-2177.
- Eriksson et al., [2002] Eriksson,A. et al (2002) Clustering of SNPs along a chromosome: can the neutral model be rejected? (http://arxiv.org/abs/physics/0207024)
- Vowles et al., [2004] Vowles,E.J. and Amos,W. (2004) Evidence for widespread convergent evolution around human microsatellites, PLoS Biol, 2, 1157-1167.
- Webseter et al., [2007] Webster,M.T. and Hagberg,J. (2007) Is there evidence for convergent evolution around human microsatellites?, Mol Biol Evol, 24, 1097-1100.
- Varela et al., [2008] Varela,M.A. et al (2008) Heterogeneous nature and distribution of interruptions in dinucleotides may indicate the existence of biased substitutions underlying microsatellite evolution, J Mol Evol, 66, 575-580.
- Kuhner et al., [2000] Kuhner,M.K. et al (2000) Usefulness of single nucleotide polymorphism data for estimating population parameters, Genetics, 156, 439-447.
- Pitman, [1993] Pitman,J. (1993) Probability. Springer Publishers, New York.
- Kelley, [1995] Kelley,C. (1995) Iterative Methods for Linear and Nonlinear Equations. SIAM, Philadelphia.
- Li et al., [2002] Li,W. et al (2002) Male-driven evolution, Curr. Opin. Genet. Dev., 12, 650-656.
- Schaffner, [2004] Schaffner,S. (2004) The X chromosome in population genetics, Nat. Rev. Genet., 5, 43-51.
- Hartigan et al., [1979] Hartigan,J.A. and Wong,M.A. (1979) Algorithm AS 136: A K-Means Clustering Algorithm, J Roy Stat Soc C, 28, 100-108.
- Charrad et al., [2014] Charrad,M. et al (2014) NbClust: An R Package for Determining the Relevant Number of Clusters in a Data Set, J Stat Softw, 61, 1-36.