Non-thermal line-broadening in solar prominences
Abstract
Aims. We show that the line broadening in quiescent solar prominences is mainly due to non-thermal velocities.
Methods. We have simultaneously observed a wide range of optically thin lines in quiescent prominences, selected for bright and narrow Mg b emission without line satellites from macro-shifts.
Results. We find a ratio of reduced widths, , of H and H of , which can hardly be attributed to saturation, since both are optically thin for the prominences observed: , . We confirm the ratio of reduced widths of He 4772 (triplet) and He 5015 (singlet) of at higher significance and detect a width ratio of Mg b2 and Mg 4571 (both from the triplet system) of .
Conclusions. The discrepant widths of lines from different atoms, and even from the same atom, cannot be represented by a unique pair [Tkin ; Vnth]. Values of Tkin deduced from observed line radiances using models indicate low temperatures down to T K. Non-thermal velocities, related to different physical states of the respective emitting prominence region, seem to be the most important line broadening mechanism.
Key Words.:
Sun: filaments, prominences1 Introduction
An essential parameter for the description of a prominence plasma is its temperature, usually derived from the widths of optically thin lines. Widths can be observed with high accuracy and are independent of the calibration in absolute units, unlike an analysis using line radiance data. The large spectral resolution of ground-based spectrographs (typically ) assures a negligible influence of the instrumental profile on the narrow prominence emission lines. In contrast, existing space-born spectrographs (as e.g. SUMER on-board SOHO), designed for broad coronal emissions, strongly affect the widths of prominence lines (cf. Stellmacher, Wiehr, Dammasch 2003).
Prominence emission lines are generally assumed to be broadened by Doppler motions resulting from thermal (V) and non-thermal (Vnth) velocities. The separation of both requires (at least two) lines from atoms of different mass originating in the same prominence volume. Clearly, it is advantageous to use as broad a range of lines as possible. However, apart from the first Balmer and the Ca ii lines, prominence emissions in the visible spectrum are faint and thus difficult to observe at sufficiently high spectral resolution. Extended ground-based observations of faint metallic lines at high spectral resolution have been almost exclusively published by Landman and collaborators (e.g. Landman 1985).
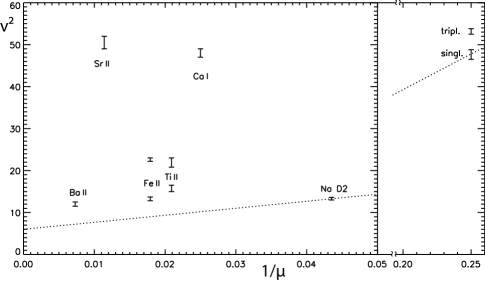
Comparing the Doppler widths of Na D1,2 with those of He D3 and Ca ii 8498, Landman (1981) found that ”the assumption of a common emission region for these lines appears to have limited validity”. Recently, Ramelli et al. (2012) and Wiehr et al. (2013) resumed such observations and found that ’cool’ emissions (e.g. of Na D or Mg b) are accompanied by rather broad H lines of widths corresponding to T K, and conclude that observed Doppler widths cannot simply be described by a unique pair [Tkin; Vnth]. In Fig. 1 we summarize the data by Ramelli et al. (2012; listed in their Table 3, but here with error bars) as a diagram of versus the inverse atomic mass, showing the large deviation from a linear relation expected for a unique [Tkin; Vnth]. These observations were taken consecutively and might thus be influenced by time evolution or drifts of the prominence over the spectrograph slit.
2 Observations
2.1 THEMIS data
We obtained simultaneous spectra of the prominence emissions H, He 5015 (singlet) with Fe ii 5018, He 4472 (triplet) with Ti ii 4468, He ii 4686 and Mg b1 (replacing the former Mg b2 line for technical reason) with five CCD cameras and 10 sec exposure time with the 90 cm THEMIS telescope on Tenerife in June 2013. As for the former observations at the Locarno observatory, IRSOL (cf. Ramelli et al. 2012), we selected quiescent prominences with bright but narrow Mg b emissions without marked macro shifts, thus assuring a ’spectral photon concentration’. The positions of the observed prominences are listed in Table 1.
| THEMIS | |||
| 1 | June, 06 | 2013 | west limb, N |
| 2 | June, 07 | west limb, N | |
| 3 | June, 10 | west limb, N | |
| 4 | June, 10 | west limb, S | |
| 5 | June, 11 | west limb, N | |
| 6 | June, 11 | east limb, S | |
| 7 | June, 12 | west limb, N | |
| 8 | June, 12 | west limb, N | |
| 9 | June, 12 | west limb, S | |
| IRSOL | |||
| 10 | Oct, 09 | 2013 | west limb, S |
| 11 | Oct, 11 | west limb, N | |
| 12 | Oct, 16 | west limb, N | |
| 13 | Oct, 16 | east limb, N | |
| 14 | Oct, 17 | west limb, S | |
| 15 | June, 30 | 2014 | west limb, S |
For a sufficiently high signal-to-noise ratio, we chose a slit with of 1.5 arcsec corresponding to 1000 km on the sun. The slit was oriented in the direction of atmospheric refraction, i.e. perpendicular to the horizon. Wavelength dependent refraction in the earth’s atmosphere ( arcsec through our spectral range 4340 Å Å) then moves the prominence structures along the slit, thus preserving them in the different spectra, where they can readily be considered by suitable spatial shifts of the respective scans.
We took spectra of the close (emission free) prominence neighbourhood immediately after each exposure for a determination of stray light, mainly originating from the telescope mirrors (rather than the earth’s atmosphere; cf. Stellmacher & Wiehr, 1970). Additional stray light from the spectrograph mirrors was minimized by excluding light from the solar disk.
For a determination of absolute spectral radiance values, we took spectra of the disk centre with an integration time of 1 sec. Ramelli et. al. (2012) describe the reduction procedure. We integrated the line profiles over 15 pixels in the spatial direction, corresponding to 3.4 arcsec, i.e. 2500 km on the sun. The final emission line profiles were fitted by Gaussians.
2.2 Further IRSOL data
Since THEMIS restricts the combination of lines to Å and to appropriate grating orders and since the THEMIS data confirmed the former sequential results (see section 3), we took further spectra at IRSOL that allowed us to extend existing observations to more than one line from the same atom: Additionally to the lines taken with THEMIS, we observed H for comparison with H (in October 2013) and Mg 4571 for comparison with Mg b2 (in June 2014, cf. Table 1).
2.3 Accuracy of the line widths
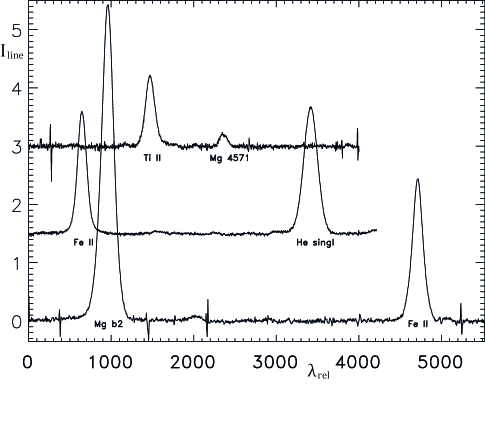
The errors of the emission line widths arise (a) from the apparent continuum level between the emission lines and (b) from the quality of the fit. The spurious rest of the stray light (a) depends on the correct subtraction of a spectrum from the (emission free) vicinity of the prominence. We determine zero as mean (count) level between the emissions. For the noisiest profile, Mg 4571 (see Fig. 2), the rms of this zero level amounts to typically 1% of the counts in the emission maximum. This leads to an error of the Mg 4571 widths of %. The other emission line widths are of much higher accuracy (near 1%). For the strong Balmer emissions the zero-level uncertainty yields a width error well below 1%.
In contrast with the accuracy of the zero-level (a), that of the fit (b) is one order of magnitude higher, since the optically thin profiles appear to be well-defined Gaussians. Figure 2 gives three spectral scans, each covering two neighbouring prominence emissions, showing the high signal-to-noise ratio.
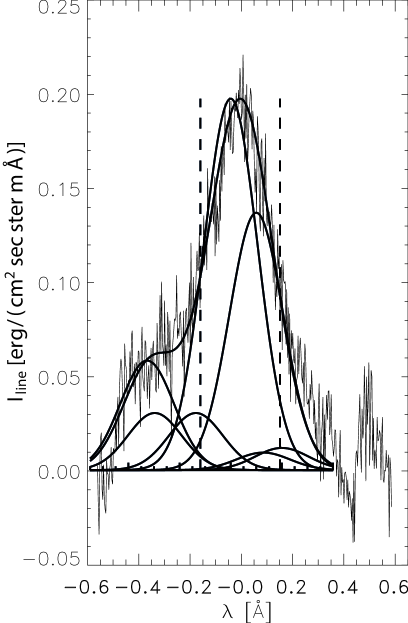
Besides Mg 4571, the lowest signal-to-noise ratio is found for the profile of He ii 4686 Å, which is only measurable in extremely bright (and rare) prominences. Figure 3 shows that even this line profile can be fitted to an accuracy of %.
3 Results
The results from the simultaneous THEMIS observations fully confirm those from IRSOL in 2011 and 2012, demonstrating that the widths discrepancies found from sequential data at IRSOL are not an artifact of short-time evolution or drifts of the prominences over the spectrograph slit. Comparing the observed widths of the various emissions from different atoms, we again find with THEMIS that none of the sets of lines observed in a given prominence can be represented by a unique pair of [T] in the well-known relation for Doppler broadening, i.e.
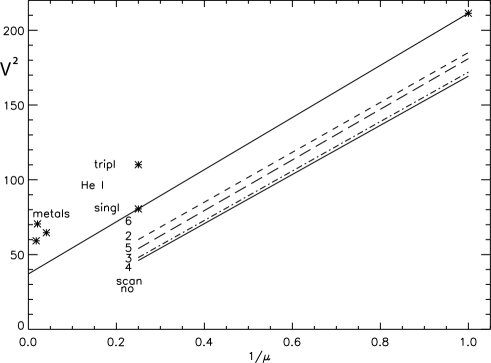
where is the atomic mass and the non-thermal line broadening parameter. We establish the ambiguity of Tkin and Vnth shown in Fig. 1. This finding is even more impressively seen in Fig. 4, where we attribute to each reduced width, , a possible combination [], i.e.
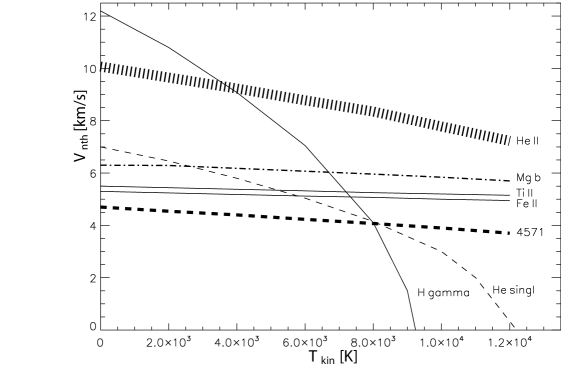
Figure 4 shows that line widths of atoms with high mass, , are largely insensitive to Tkin, in contrast to the Balmer lines. The variety of curves excludes a unique pair fitting the various emission line widths. The apparent coincidence of H, He singlet and Mg 4571 is rather fortuitous and does not occur in similar diagrams for other prominences. Evidently, combinations of lines from atoms of different mass, , required to separate thermal and non-thermal broadening, give contradicting pairs of [; ], which cannot unambiguously relate to corresponding common emission regions within the respective prominence.
3.1 Balmer lines
The quiescent prominences selected for bright but narrow Mg b emission persistently show broad H emissions with reduced widths . For purely thermal broadening (i.e. km/s), this would correspond to K.
To get more information about the broadening of Balmer lines, we observed H together with H in Oct. 2013 at IRSOL and confirm the large widths of these two optically thin lines. The analysis shows that the ratio of the reduced Doppler widths of H and H is larger than 1.0 and does not systematically vary with the H radiance (Fig. 5).
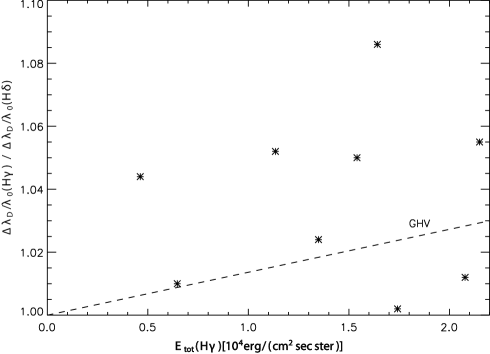
The isothermal model calculations by Gouttebroze, Heinzel, Vial (1993; hereafter referred to as GHV) yield a width ratio of H/H which increases to 1.03 through our observed radiance erg/(s cm2 ster). For this range, the models give a total optical thickness in the respective emission line centres of , , (), and predict an increase of the mean-width excess H/H with brightness (dashed line in Fig. 5) independent of the assumed model temperature (T, 6000 and 8000 K; all V km/s). Our observed width ratios deviate from these model calculations and cannot be explained by saturation effects.
3.2 Helium lines
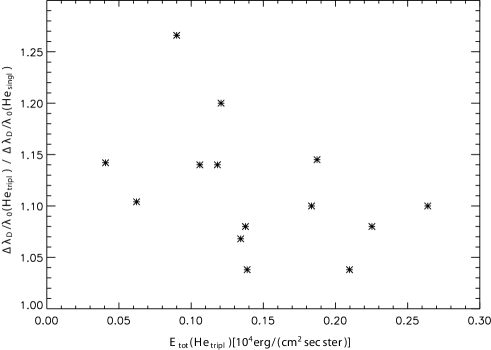
The simultaneous observations with THEMIS confirm those, which have been taken consecutively at IRSOL. For the reduced widths , the mean ratio of He ii 4686 Å and He i 4472 Å is found to be (former value 1.5) and that of He i 4472 Å (triplet) and He i 5015 Å (singlet) remains (at higher significance). There is no marked dependence on the brightness of the respective prominence, e.g. on the line radiance of He i triplet (Fig. 6). Thus the variety of the width ratios of He triplet and He singlet cannot be explained by saturation effects, (just like the two Balmer lines). Ramelli et al. (2012) suggest that the line from the triplet system reflects a hotter origin than the singlet line, and is populated via ionization and recombination.
For the line radiance, we obtain a slightly smaller ratio of He i 4472 (triplet) and He ii 4686 of 45 (formerly 50), whereas that of He (triplet) and He (singlet) of 9.4 (Wiehr et al. 2013) remains unchanged.
3.3 Magnesium lines
The faint triplet-to-singlet inter-combination line Mg 4571 Å, observed by Sotirovski (1985) during eclipse, can only be measured in very bright prominences at high spectral resolution. Ramelli et al. (2012) find a small reduced width of . We verified this at Locarno in Oct. 2013 and again find . On June, 30, 2014 we observed an exceptionally bright prominence at W/13S ( erg/(s cm2 ster), i.e. in the GHV tables), where Mg 4571 had the high line radiance of 50 erg/(s cm2 ster). We found that the Mg b2 line is times broader than Mg 4571. This cannot be due to saturation, since our radiance value of Etot(Mg b erg/(s cm2 ster) is much smaller than the 6700 erg/(s cm2 ster) observed by Landman (1985), for which he estimates (Mg b; besides, our Mg b2 profile is perfectly Gaussian.
The width excess of Mg b2 over Mg 4571 cannot be explained in the same way as that of He triplet over He singlet, since both upper Mg levels belong to the triplet system. The upper level of Mg 4571 () is populated by the Mg b2 transition; the large width excess of Mg b2 over Mg 4571 is thus hard to understand. On the other hand, the level is meta-stable and can be populated from the lowest Mg level (; singlet) by collisions. In that case, the narrow Mg 4571 width might indicate that these collisions only occur in prominence regions with small line broadening.
4 Discussion
We have analysed a comprehensive set of faint metallic lines in quiescent prominences, which hitherto have rarely been observed at high spectral resolution. A sufficiently high signal-to-noise ratio requires prominences that show narrow, but bright emissions largely free from macro-shifts (assuring a ’spectral photon concentration’). From our former search of measurable He ii 4686 Å emission, we know that suitable prominences are massive, poorly structured and show pronounced Na D emission. The simultaneous appearance of ’hot’ He ii and ’cool’ Na i lines already indicates emissions from different prominence volumes. Our various observations with different telescopes, spectrographs and line combinations indeed show that the line widths do not allow one to unambiguously separate thermal and non-thermal line broadening. A determination of kinetic temperatures in quiescent prominences from widths analyses thus remains highly uncertain. Given the limits and uncertainties (e.g. Figs. 1 and 4), we are not surprised by the large ranges deduced from widths observed in ’cool parts of prominences’: K (Jejcic et al., 2014) and even K (Park et al., 2013).
4.1 Tkin from line radiances
Line radiances offer another way to get information about physical conditions in prominences. A remarkably tight relation of H and H emissions over a large brightness range up to E erg/(s cm2 ster) is found when superposing observations at Tenerife with the VTT-spectrograph (Fig.2 in Stellmacher & Wiehr, 1994), from 2-D imaging at the VTT (Fig. 4 in Stellmacher & Wiehr, 2000), and from spectra with THEMIS (Fig. 3a in Stellmacher & Wiehr, 2005). That relation (shown in Wiehr & Stellmacher, 2015) is at best represented by the GHV models with T K and T K (both V km/s) Gunár et al. (2012) use 2D multi-thread models with prominence-corona transition region, PCTR, to reproduce observed H radiances and widths, and deduce similar low temperatures down to T K.
Since none of our various V versus diagrams (e.g. Fig. 1) gives gradients corresponding to such low Tkin, the lines will be broadened mainly by non-thermal velocities. Adopting the above 5000 K, the observed H widths would give km/s and the 5% smaller H widths km/s; assuming T=5000 K for the observed Mg lines, the Mg b2 widths would yield km/s, and the 1.3-times narrower Mg 4571 line km/s.
4.2 Non-thermal velocities
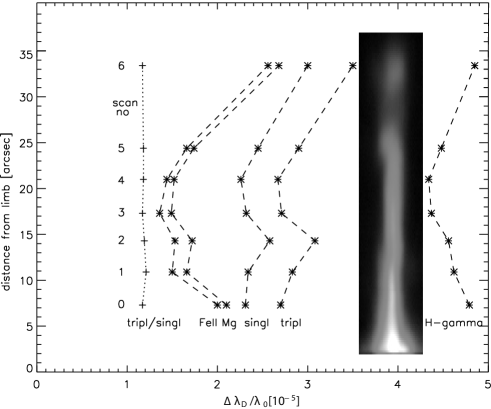
This strong and variable influence of Vnth on the prominence emission line widths is also supported by the spatial variation of line broadening (along the slit; Fig. 7). If we plot a diagram for each spatial location (scan-no.), we find nearly parallel curves (Fig. 8). Although their steepness of correspondingly T K is certainly unrealistic, their different ordinate shifts (corresponding to km/s) indicate a spatial variation of non-thermal line broadening. This variation of physical states within prominences is also seen from the observed relations of He D3 and H (Stellmacher & Wiehr 1995) showing characteristic mean ratios for individual prominences which, however, noticeably vary within the same prominence (Stellmacher, Wiehr, Hirzberger 2007).
A unique pair [T] cannot characterize a mean of prominence regions with individual physical state, averaged to assure a sufficiently high observational accuracy for the faint (metallic) lines. In our data we average over 3.4 arcsec (in the slit direction). If we also assume 3.4 arcsec for the influence of seeing during our (typically 10 sec) exposure, the effective spatial area contributing to the line profiles is 2500 km2500 km. If we assume that prominence structures have widths of km, separated by spaces of similar widths (see e.g. the speckle reconstructed H image in Wiehr, Stellmacher, Hirzberger, 2007; Fig. 8); our resolution area would contain at least 60 of such structures.
The number of threads along the line of sight may be estimated from calculations by GHV: their coolest model with T K does not reach our highest emission E erg/(s cm2 ster), observed in a massive prominence; their model with T K matches this emission assuming D=8000 km. Adopting this value, one obtains threads plus inter-threads (of totally 300 km) along the line of sight, which fairly agrees with Gunár et al. (2012). The total prominence volume emitting our observed optically thin lines will then represent an integration over condensations.
Line-specific non-thermal broadening would thus indicate that the condensations have different physical states, since a temperature stratification (plus PCTR) within clumps of km, even when adding 27 of them along the line of sight, may hardly provide sufficient thickness to emit the observed radiance of Na i through He ii to ’hot’ EUV lines (e.g. Stellmacher, Wiehr, Dammasch 2003). Hence, each spectral line originates from a sub-entity of the condensations, which exhibits appropriate conditions for its emission and causes a clump-specific non-thermal broadening. This is supported by the hierarchy of Vnth for H, H, Mg b and Mg 4571 (see end 4.1). Threads of individual temperature and PCTR have already been proposed by Pojoga (1994), which differs from macro-shifted isothermal threads with equal PCTRs assumed by Gunár et al. (2008).
4.3 Downdraft motions
A scenario that predicts plasma clumps at various physical states has been modelled by Low et al. (2012). Their calculations show that condensations of cool gas must occur in prominences ”as a consequence of the non-linear coupling of force balance and energy transport”. The ”catastrophic radiative cooling” causes the gas to become largely neutral, and the frozen-in state breaks down. The clump then sinks and progressively ”warms up by resistive heating” (Low et al. 2012) until, at sufficient re-ionization, the clump is eventually again frozen-in and stops sinking. This ”recurrent break-down of the frozen-in condition” (Low et al. 2012) thus causes a relation between (sink) velocity and temperature.
If we reasonably assume that some fraction of the vertical falling motion shows up as non-thermal velocity (due to turbulence and/or shocks; cf. Hillier et al. 2012), a sub-entity of the 1600 clumps averaged in our spectra, which has the appropriate physical conditions for a specific line emission, causes a line-specific non-thermal broadening.
Downdraft motions in quiescent prominences have been observed with the HINODE instrument by Berger et al. (2010) from H and Ca ii H images. These, however, primarily show the spatial variation of local brightenings rather than actual motions. We cannot a priori exclude that a change of their location reflects a spatial variation of locally optimal excitation conditions. Our line widths data, in turn, give strong indication for real plasma velocities and can then be considered as an additional support for flows in quiescent prominences.
4.4 Future modelling
Prominence models may then consider a variety of clumps (of e.g. 150 km diameter) each with individual temperature and non-thermal broadening and sum them up along the line of sight (as e.g. done by Gunár et al. 2008) and over an area corresponding to the spatial resolution achieved in spectra (e.g. our 2500 km2500 km). The observed mean ratios of widths and radiance, listed in Table 2, may be used to scale these models.
| emission lines | ratios | |
| H / H | ||
| He i 4472 (tripl) / He i 5015 (singl) | ||
| He ii 4686 / He i 4472 (tripl)) | ||
| Mg b2 5172 / Mg 4571 | ||
| He i 4472 (tripl) / He i 5015 (singl) | ||
| Etot | He i 4472 (tripl) / He ii 4686 | |
| Mg b2 5172 / Mg 4571 |
These ratios do not markedly vary through a prominence (here along the slit) although the absolute values do (cf. Fig. 7). We note that the ratios are valid for an H radiance range of erg/(s cm2 ster), for which the GHV models give . It is still unknown how these ratios will behave in faint prominences with pronounced structuring and .
Acknowledgements.
We are very indebted to F. Hessman for fruitful discussions; C. Le Men contributed valuable support with the THEMIS and M. Bianda and R. Ramelli with the IRSOL observations. We thank an unknown referee for helpful suggestions. J. Hirzberger (MPS) kindly put his reduction software to our disposal. SOLARNET provided financial support.References
- (1) Berger, T., Slater, G., Hurlburt, N., Shine, R., et al. 2010, ApJ 716, 1288
- (2) Guttebroze, P., Heinzel, P., Vial, J.-C., 1993, A&AS 99, 513
- (3) Gunár, S., Heinzel, P., Anzer, U., Schmieder, B., 2008, A&A 490, 307
- (4) Gunár, S., Mein, P., Schmieder, B., Heinzel, P., Mein, U., 2012, A&A 543, 93
- (5) Hillier, A., Isobe, H., Shibata, K., Berger, T. 2012, ApJ 756, 110
- (6) Jejcic, S., Heinzel, P., Zapiór, M., Druckmüller, M., Gunár, S., Kotrc. P. 2014, Solar Phys. 289, 2847
- (7) Landman, D.A. 1981, ApJ 251, 768
- (8) Landman, D.A. 1985, ApJ 295, 220
- (9) Low,B. C., Liu, W., Berger, T., Casini, R. 2012, ApJ 757, 21L
- (10) Park, H., Chae, J., Song, D, and 10 coauthors 2013, Solar Phys. 288, 105
- (11) Pojoga, S., 1994, in V. Rusin, P. Heizel and J. C. Vial (eds) ’Solar Coronal Structures’, Proc. IAU Coll. 144, p. 357
- (12) Ramelli, R., Stellmacher, G., Wiehr, E., Bianda, M., 2012, Solar Phys. 281, 697
- (13) Sotirovski,P. 1965, Ann. d’Astrophys. 28, 1065
- (14) Stellmacher, G., Wiehr, E. 1970, A&A 7, 432
- (15) Stellmacher, G., Wiehr, E. 1994, A&A 290, 655
- (16) Stellmacher, G., Wiehr, E. 1995, A&A 299, 921
- (17) Stellmacher, G., Wiehr, E. 2000, Sol. Phys. 196, 357
- (18) Stellmacher, G., Wiehr, E. 2005, A&A, 431, 1069
- (19) Stellmacher, G., Wiehr, E., Dammasch, I. E. 2003, Sol. Phys. 217, 133
- (20) Stellmacher, G., Wiehr, E., Hirzberger, J. 2007, Sol. Phys. 240, 25
- (21) Wiehr, E., Stellmacher, G., Ramelli, R., Bianda, M.: 2013, Cent. Eur. Astrophys. Bull., Vol. 37, 487
- (22) Wiehr, E., Stellmacher, G.: 2015, Cent. Eur. Astrophys. Bull. (in press)