Corresponding author: ]ivan.vartaniants@desy.de
Revealing three-dimensional structure of individual colloidal crystal grain by coherent x-ray diffractive imaging
Abstract
We present results of a coherent x-ray diffractive imaging experiment performed on a single colloidal crystal grain. The full three-dimensional (3D) reciprocal space map measured by an azimuthal rotational scan contained several orders of Bragg reflections together with the coherent interference signal between them. Applying the iterative phase retrieval approach, the 3D structure of the crystal grain was reconstructed and positions of individual colloidal particles were resolved. As a result, an exact stacking sequence of hexagonal close-packed layers including planar and linear defects were identified.
pacs:
87.59.-e, 42.30.Rx, 82.70.Dd, 61.72.DdColloidal crystals nowadays are actively exploited as an important model system to study nucleation phenomena in freezing, melting and solid-solid phase transitions Qi et al. (2015); Wang et al. (2015); Statt et al. (2015); Peng et al. (2015), jamming and glass formation DeGiuli et al. (2014); Jacob et al. (2015). In addition, colloidal crystals are attractive for multiple applications since they can be used as large-scale templates to fabricate novel materials with unique optical properties such as the full photonic bandgap, ’slow’ photons and negative refraction, as well as materials for application in catalysis, biomaterials and sensorics Kim et al. (2011); Kuzyk et al. (2012); Henry et al. (2011); Zhang et al. (2013a). Colloidal crystals provide a low cost large-scale alternative to lithographic techniques, which are very effective for producing high-quality materials with a desired structure, but are limited in building up a truly three-dimensional (3D) structures and bring high production costs Painter et al. (1999). Recently, significant progress is achieved in engineering materials with tunable periodic structure on the mesoscale by functionalizing colloids with DNA Zhang et al. (2013b), applying external fields Yethiraj and van Blaaderen (2003); Pal et al. (2015) or varying the particle shape Glotzer and Solomon (2007); Petukhov et al. (2015).
Understanding the real structure of colloidal crystals and disorder of different types is an important aspect from both fundamental and practical points of view. Even at equilibrium colloidal crystals can have a finite density of defects, which can be anomalously large for certain colloidal lattices Smallenburg et al. (2012). The opposite can also happen as defects can play a decisive role in the choice of the crystal structure Mahynski et al. (2014); Hilhorst et al. (2010). For applications such as photonic crystals most of growth-induced defects can deteriorate their optical properties. On the other hand, controlled incorporation of certain defects can be desirable to enhance the functionality such as creating waveguides Johnson and Joannopoulos (2002); Hilhorst et al. (2009), trapping photons Vlasov et al. (2001); Painter et al. (1999) and developing optical chips Soljačić et al. (2003). In these studies monitoring an internal 3D structure of colloidal crystals including defects in real time is an important aspect, which remains a challenge Sulyanova et al. (2015).
Among widely used techniques of the colloidal crystals structure investigation are optical microscopy Dinsmore et al. (2001); Schall et al. (2004) and confocal laser scanning microscopy Schall (2009). However, the range of applications of these methods is strongly reduced by the limited resolution (at best about ) and the need of a careful refractive index matching, which is not always possible. Furthermore, some of the materials are opaque for visible light which complicates imaging of their internal structure. Electron microscopy (EM) can provide high-quality images of the material surface with an exceptional resolution Jiang et al. (1999), but fails to probe the bulk, because of the short penetration depth of electrons. In addition, imaging in EM typically involves elaborate and destructive sample preparation Ye et al. (2002), such as drying or coating. In this respect, high-resolution x-ray microscopy Bosak et al. (2010); Hilhorst et al. (2012); Byelov et al. (2013); van Schooneveld et al. (2011), small-angle x-ray scattering (SAXS) Sirota et al. (1989) and small-angle neutron scattering (SANS) Chen et al. (1994) represent complementary methods offering the advantage of high penetration depth for nondestructive studies of colloidal systems.
Here we present results of coherent x-ray diffractive imaging (CXDI) approach Miao et al. (1999); Robinson et al. (2001) (see also for review Vartanyants and Yefanov (2015)) which allows to visualize the internal 3D structure of an individual colloidal crystal grain with high resolution.
The original idea was proposed more than half a century ago in a seminal work of Sayre Sayre (1952), where he suggested to phase crystallographic data by measuring information between the Bragg peaks in reciprocal space 111Demonstration of this approach to reveal the structure of a single protein was given in a recent work performed at x-ray free-electron lasers Ayyer et al. (2016). In the context of CXDI technique this concept can be applied for three-dimensional imaging of the internal structure of crystalline samples and, in principle, can provide information about the positions of individual scatterers in the crystalline structure Vartanyants and Yefanov (2015). We have demonstrated in simulations that such approach can be applied to atomic resolution imaging of nanocrystals illuminated with high energy coherent x-rays by mapping several Bragg peaks on the detector Gulden et al. (2011) (similar to high energy electron scattering Zuo et al. (2003); Dronyak et al. (2010); Chen et al. (2013)). However, lack of coherent flux as well as low scattering efficiency at these energies are strong limiting factors to reach these goals presently.
At the same time, colloidal crystals with the unit cell on the order of few hundred nanometers are an ideal objects for developing these high resolution imaging methods. First experimental demonstration of applying two-dimensional (2D) CXDI method for visualization of a single stacking fault in a thin colloidal crystalline film was presented in Ref. Gulden et al. (2010). Due to experimental challenges attempts to generalize this approach to 3D were not successful up to now Gulden et al. (2012). Here we present first successful results of a detailed reconstruction, which visualize three-dimensional positions of individual particles in a single colloidal crystal grain.
The experiment was performed at the Coherence Beamline P10 at PETRA III in Hamburg (see for experimental details also Appendix I). A monochromatic coherent x-ray beam of photon energy was focused at the sample at from the undulator source using the transfocator optics Zozulya et al. (2012) based on compound refractive lenses (CRLs) positioned at distance upstream from the sample (see Figure 1).
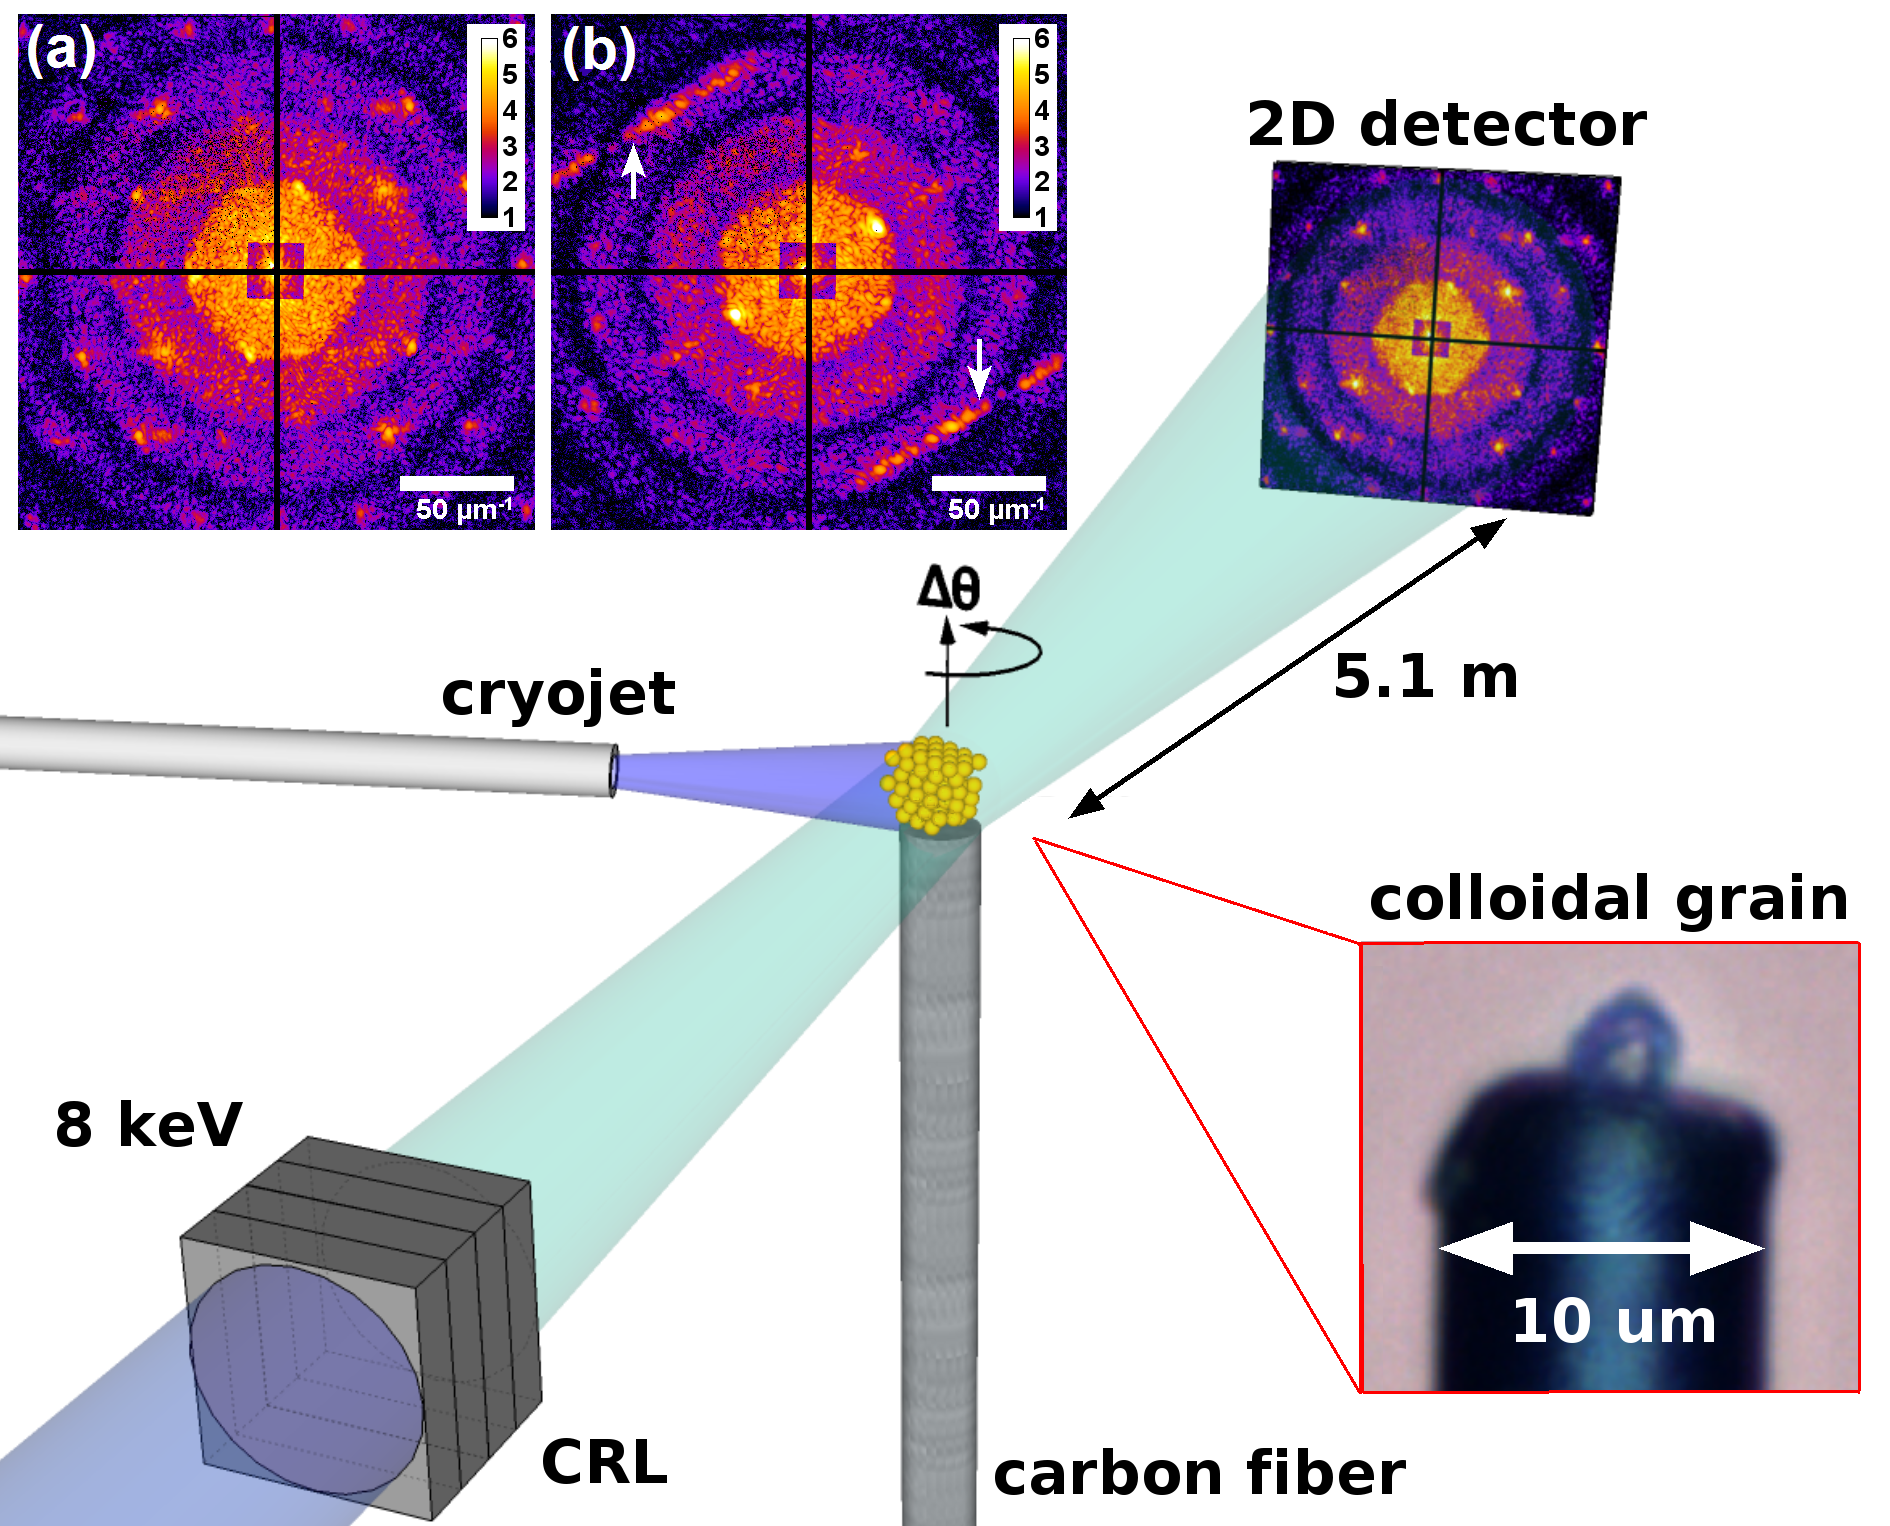
A set of horizontal and vertical guard slits in size, located at distance in front of the CRLs, was used to select a coherent portion of the beam. The size of the focal spot at the sample position was by full width at half maximum (FWHM) in horizontal and vertical directions, with the total intensity about photons per second Zozulya et al. (2012). To inhibit the radiation damage the sample was cryo-cooled with the flow of nitrogen (about ). The sample holder was mounted on a goniometer, which allows azimuthal rotation around the vertical axis. The diffraction data were recorded using a photon-counting pixel detector MAXIPIX positioned in transmission geometry at distance downstream from the sample. In order to reduce air scattering an evacuated tube was inserted between the sample and the detector covering the major part of the optical path. The total number of pixels of the detector was and a pixel size was . For the selected photon energy and sample-to-detector distance resolution in reciprocal space was per pixel and allowed to have four times sampling rate per speckle.
Samples were prepared from dried sediments of colloidal crystals that showed characteristic optical Bragg reflections Gulden et al. (2012). The specimen studied in this work consisted of sterically stabilized silica spheres with a diameter of dried from cyclohexane over several months. Small grains were obtained by mechanically crushing a piece of the ordered sediment. Individual grains were picked up using a micromanipulator and connected to the tip of a thick carbon fiber, which was glued to a glass holder beforehand. The colloidal crystal grain used in this study was imaged with a light microscope (see inset in Figure 1 and Appendix I) and determined to have dimensions of about .
The full dataset consisted of rotation series of diffraction patterns with angular increment covering the entire reciprocal space. To avoid oversaturation of the detector a series of images with of exposure time were collected and summed up for each azimuthal position. In Figure 1(a,b) two examples of obtained scattering patterns are shown. They contain several Bragg peaks surrounded by the interference speckles and diffuse scattering in between. The detector size allowed to record reflections up to the forth order measured simultaneously. The visibility , which is a commonly used parameter to describe the contrast in the coherent interference pattern Goodman (2005), was estimated to be from . It is worth to mention, that although the intensities between Bragg peaks are rather weak in comparison with the ones in the vicinity of Bragg peaks, this part of the recorded signal is highly important for the reconstruction. It encodes information about the relative phases of different reflections and allows to resolve positions of individual scatterers in the unit cell. The concentric rings observed in diffraction patterns represent the form factor of a single colloidal sphere and the number of these rings in the diffraction pattern gives us an estimate of four pixels resolution per colloidal particle diameter in direct space.
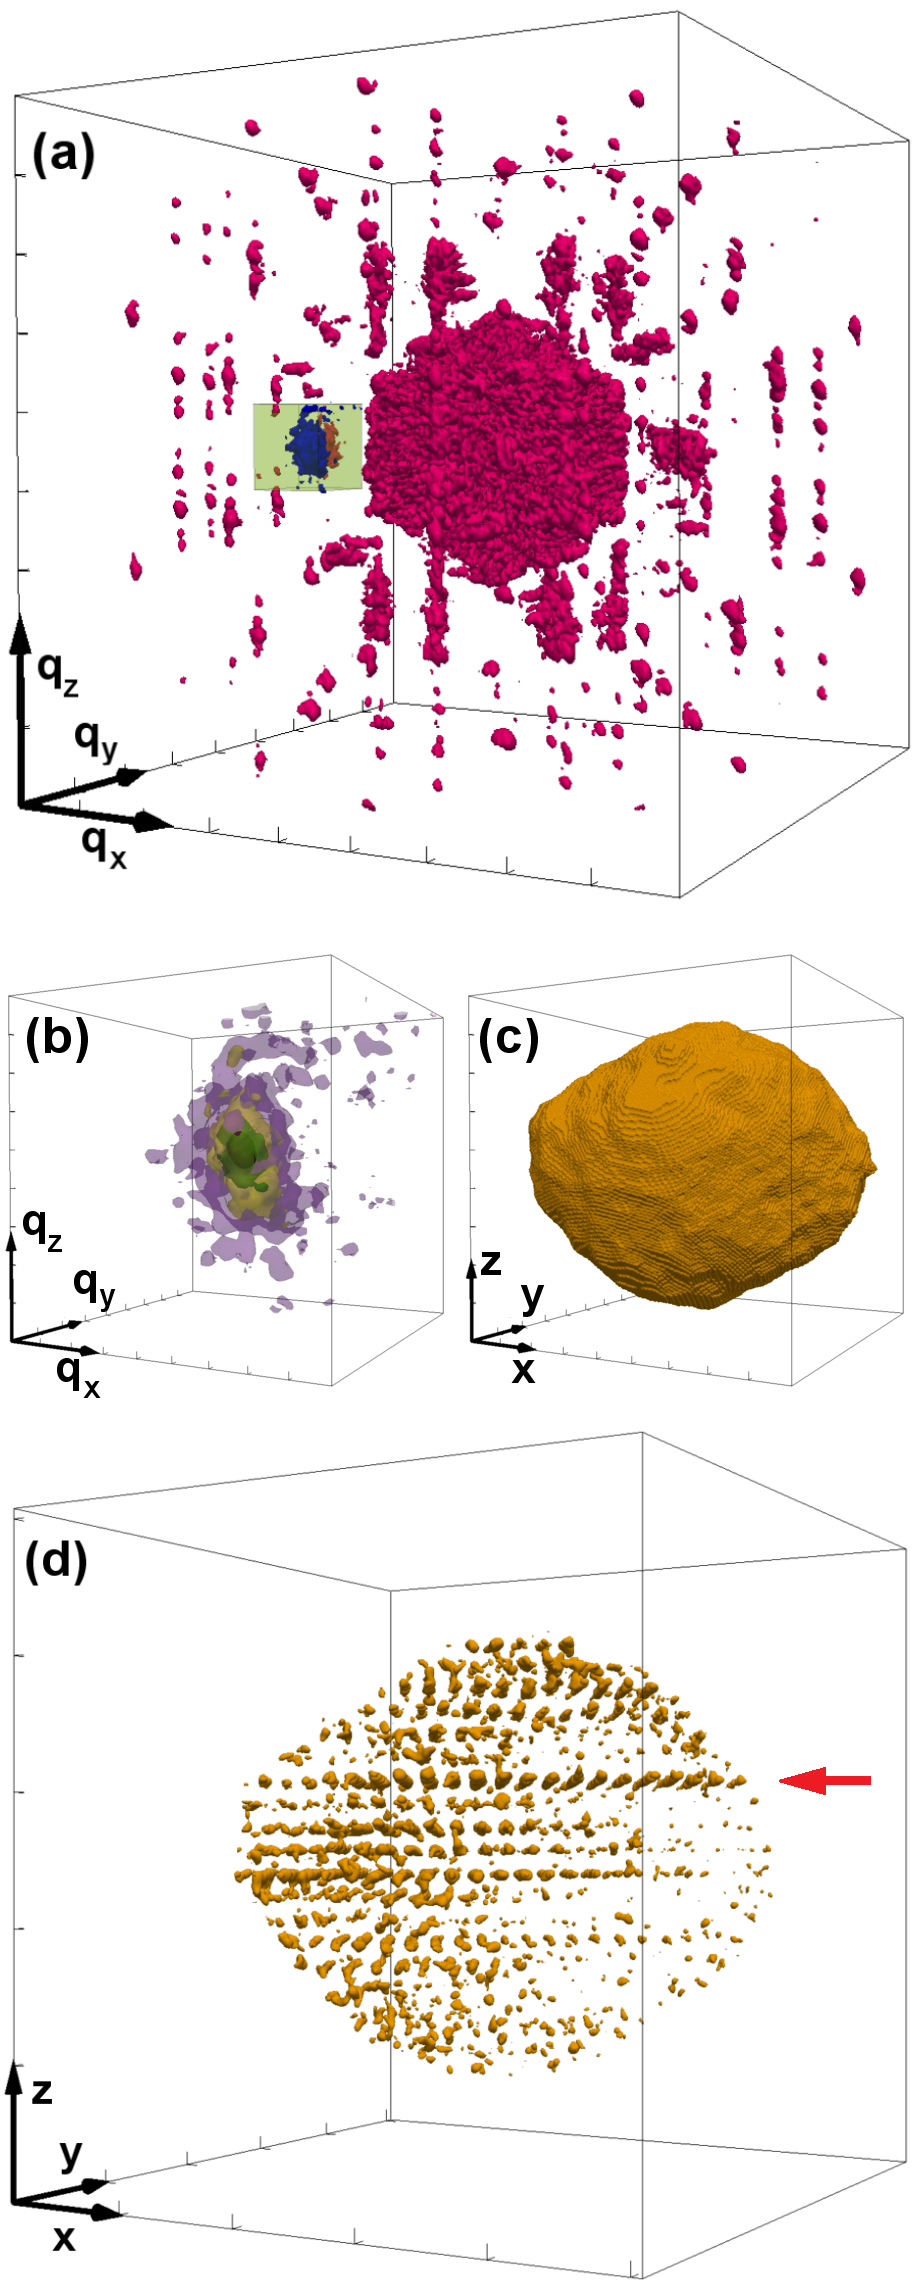
The full 3D reciprocal space map, represented by volume rendering, is shown in Figure 2(a). All diffraction patterns collected during the rotational scan were used in the merging procedure. A remarkable features observed in this map are a number of streaks which connect some of the Bragg peaks (see Figure 2(a) and diffraction pattern shown in Figure 1(b)). These streaks (Bragg rods) indicate the presence of plane defects in the crystalline lattice and the intensity modulations along them are directly related to the exact stacking sequence Gulden et al. (2012); Meijer et al. (2014). In the full 3D reciprocal space dataset (see Figure 2(a)), that gives rise to well-pronounced Bragg rods which connect some of the reciprocal lattice nodes. Such rods are oriented perpendicular to the plane of the defect and therefore a specific sample orientation is required for the observation of the whole streak in a single diffraction pattern.
The 3D reciprocal space maps were inverted to real space images by using a phase retrieval algorithm Fienup (1982); Marchesini (2007). In order to obtain a good estimate for a tight support, which is crucial to enforce convergence of the reconstruction procedure, we analyzed the scattered intensity distribution in the vicinity of several Bragg reflections that were not affected by Bragg rods. From each of them we selected a cubic volume of surrounding the Bragg peak (see Figure 2(b)), and performed reconstruction for this cropped dataset. The results were averaged over reconstructions of six different Bragg reflections, and the obtained shape function (see Figure 2(c)) was used as a tight support in the reconstruction of the full 3D reciprocal space dataset. That allowed to avoid appearance of twin images and substantially facilitated the reconstruction procedure. In the phase retrieval process, consisted of about iterations of Hybrid Input-Output (HIO) combined with Error Reduction (ER) algorithms, the support was several times updated by applying the Shrinkwrap method Fienup (1982); Marchesini et al. (2003). The missing regions in the diffraction data were allowed to freely evolve with an additional constraint of applying an upper boundary for amplitudes. This suppresses them down to values obtained from the Fourier transform of the support with normalization to the measured amplitudes.
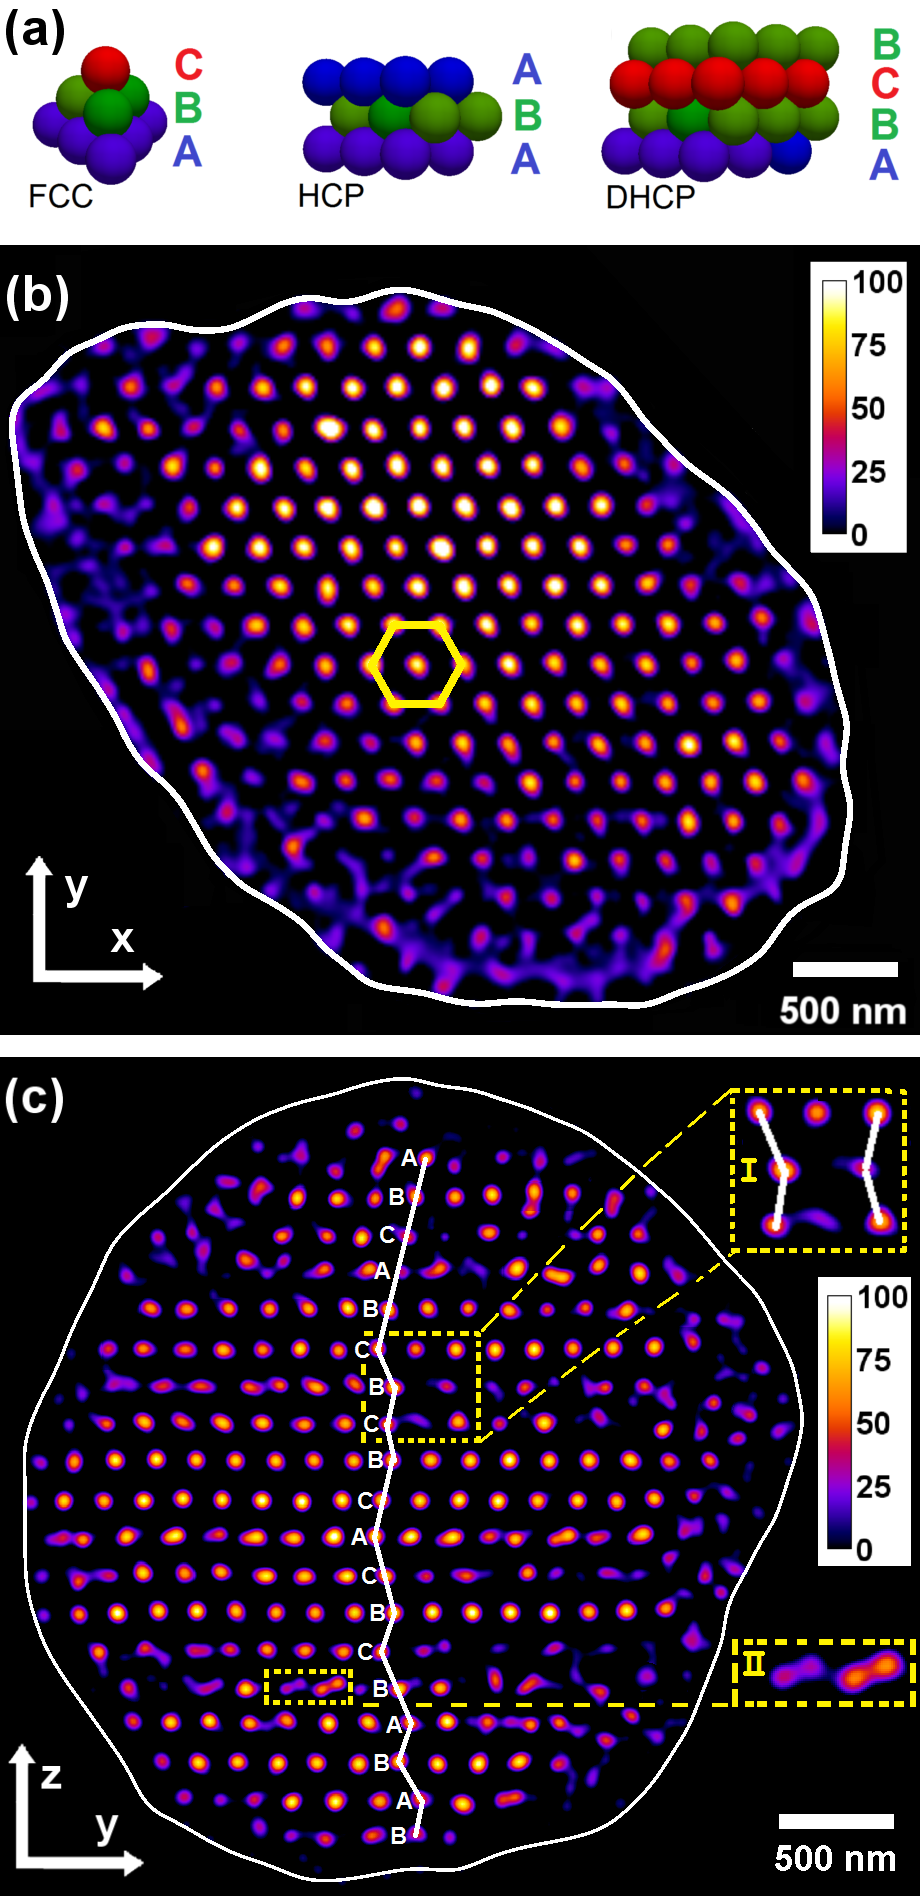
Reconstructed 3D electron density after applying a high band pass Gaussian filter is shown in Figure 2(d). It reveals periodic behavior which corresponds to positions of colloidal particles in the crystal grain. In Figure 3(b) a slice through one of the packing planes marked by a red arrow in Figure 2(d) is presented. Remarkably, positions of individual colloidal spheres are clearly resolved and show perfect hexagonal symmetry. We used the same slice to estimate an obtained resolution in real space for localization of individual particles in the crystal. An average intensity peaks width in this image was estimated to be (FWHM). Applying Rayleigh criterion for the minimum separation between two distinguished Gaussian peaks we determined the resolution to be on the order of .
Furthermore, our results allow to identify the stacking sequence of the colloidal crystal layers. The two most common close-packed structures which occur in nature are the hexagonal close-packed (HCP) structure with a stacking period AB, and the face-centered cubic (FCC) with a layer stacking of ABC (see Fig. 3(a)). In a colloidal crystal the free-energy difference between HCP and FCC is rather small Woodcock (1997). Therefore a random mixture of these two stacking types, the so-called random hexagonal close-packed (RHCP) structure, is often observed in colloidal crystals spontaneously self-assembled under gravity Petukhov et al. (2003); Dolbnya et al. (2005).
To determine the stacking sequence (see also Appendix II) we analyzed the projection of the 3D density map along the [100] crystallographic direction of the hexagonal lattice defined in Ref. Meijer et al. (2014) i.e. along the x-axis in Figure 2(d) . To avoid error accumulation in the projection, each position of the intensity maxima in the 3D density profile was substituted by identical 3D Gaussian functions with the FWHM of and no density in between them. Next, for the sake of convenient visual representation, the resulting density map was divided by a 2D profile of the averaged intensity distribution, as a flat field correction to the image. In Figure 3(c) each maximum represents a column of spherical particles in a crystalline arrangement. In the case of an ideal close packed structure, projection of a column would correspond to projection of a single sphere. Non-uniform intensity distribution presented in Figure 3(c) can be attributed to imperfections in positioning of individual particles (see Sup ). Since the vector of lateral displacement belongs to the projection plane, the lateral position of each layer can be directly identified. The first well pronounced layer at the top of the crystal was denoted as an A layer and the next layer below as a B layer. Then, according to its lateral shift, the third layer appears to be a C layer. Following this procedure layers in the colloidal crystal were identified (see Figure 3(c)). One of the possible sequences of elementary stacking order may be (from top to bottom) that reveals three packing structures: FCC, HCP, and double hexagonal close-packed (DHCP) structure. The last one is usually described by layer period (see Figure 3(a)). Here we proposed one of the possible sequences of the elementary stacking order, however alternative decompositions are also possible. Still, all of them will contain FCC, HCP, and DHCP blocks in different combinations.
In addition to regular structure revealed by our analysis, we have observed a number of linear defects in the projection of 3D colloidal crystal grain (see insets in Figure 3(c)). In the inset I it is clearly seen that at this specific location the left part of the crystal sequence can be clearly identified as position, while the right part is rather position. In the inset II different type of defect is shown, when several double maxima appear in the projection. Our inspection showed that it can be attributed to boundary between two perfect hexagonal regions which are shifted by half period perpendicular to the projection direction. We would like to point out that our reconstruction visualizes exact stacking sequence of layers and in-plane defects in colloidal crystal grain. This is an important achievement which opens a way to further applications of CXDI method for non-destructive characterization of photonic crystals.
In a summary, non-destructive CXDI experiment on a single colloidal crystal grain was performed. Full crystallographic data which included several Bragg reflections together with surrounding speckles and intensities between them was measured by a rotation series of 2D far-field diffraction patterns. By applying the phase retrieval approach the obtained 3D dataset in reciprocal space was inverted into the electron density distribution in real space. Finally, the grain shape and positions of individual colloidal particles, resolved in three dimensions, were reconstructed. The crystalline structure of the sample was characterized in terms of close packing of hexagonal layers. The determined stacking sequence revealed layers with FCC, HCP, and DHCP structure blocks. Our results allowed us to visualize with high resolution a number of in-plane defects present in the colloidal crystal grain including all the details up to its core.
Our results open up a breakthrough in applications of coherent x-ray diffraction for visualization the inner three-dimensional structure of different mesoscopic materials, such as photonic crystals. The outcome of this work is of significant importance for further progress and developments of CXDI methods with an aim to resolve the three-dimensional structure of nanocrystals with atomic resolution Gulden et al. (2011). Our achievements pave the way to atomic resolution imaging of nanocrystals at the next generation diffraction limited synchrotron light sources Hettel (2014) that are expected to provide two orders of magnitude higher coherent flux.
Acknowledgements.
This research was supported by BMBF Proposal 05K10CHG ”Coherent Diffraction Imaging and Scattering of Ultrashort Coherent Pulses with Matter” in the framework of the German-Russian collaboration Development and Use of Accelerator-Based Photon Sources and the Virtual Institute VH-VI-403 of the Helmholtz Association. The use of GINIX setup operated by the University of Gttingen is greatly acknowledged. We acknowledge fruitful discussions and support of the project by E. Weckert, important comments and suggestions on the final stages of the manuscript preparation by S. Lazarev and careful reading of the manuscript by D. Novikov.Appendix A Appendix I. Experimental details
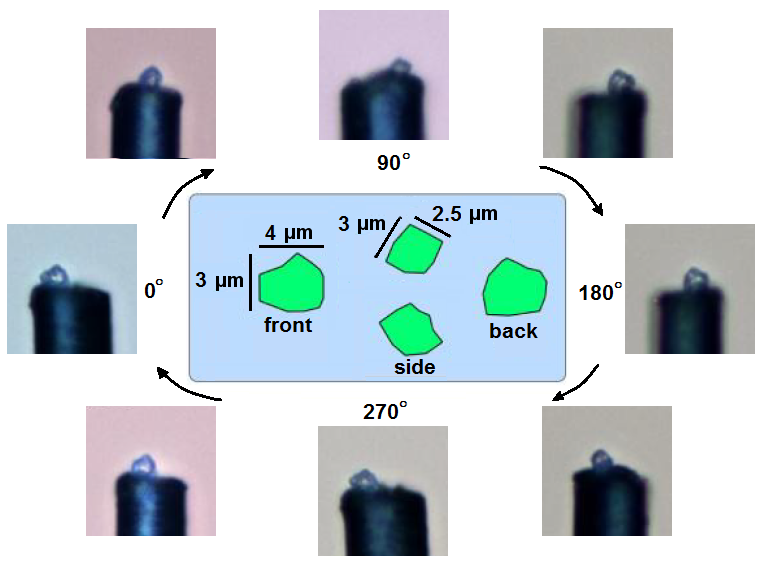
After the CXDI measurements the colloidal crystal grain was imaged with a light microscope. A series of images taken from different perspectives covering degrees in angular range is presented in Figure 4). Estimates of the shape function in projection on different directions are shown in the central subset. According to them the grain is determined to have dimensions of about .
To access the scattering signal close to the directly transmitted beam the semitransparent beamstop mm in size made of thick Si foil, was installed in front of the detector. In addition, a Ta disk of in diameter was glued on the top of the foil to absorb the direct beam completely. The semitransparent beamstop can be recognized as the shadowed area in the center of the diffraction images presented in Figure 1(a,b). Afterwards, the recorded signal in this region was multiplied by a mask, which was calculated according to the absorption length for the selected photon energy and the film thickness. Such a simple rescaling, however, cannot be used near the beamstop edge (about - pixels in width) along the perimeter of the shadowed area. On one hand the borders of the foil could have variations of thickness in the consequence of cutting procedure, on the other hand the detector pixels under this area could be shadowed partially. To handle this the mask coefficient for each pixel in this region was determined by normalization of the detected signal to the averaged value of intensity in the surrounding. To improve accuracy the results of this normalization were averaged over all diffraction patterns collected during the measurements.
In addition to the rotation series several images were recorded with the empty-beam, i.e. when the sample was completely moved out. The average of these images was normalized to the expose time and subtracted as a background from each of the diffraction patterns in the dataset.
In Figure 2(a) of the main text the full 3D reciprocal space map, represented by volume rendering, is shown. The volume of is sampled by a regular grid of voxels, so the transversal size of the voxel corresponds to the pixel size of the diffraction pattern in reciprocal space.
Appendix B Appendix II. Stacking sequence determination
From theory Krishna et al. (1981) it is known, that highest averaged density in close-packed arrangements of equal spheres is achieved when they form plain hexagonal layers, which can occupy only three specific positions relative to each other, as shown in Figure 3(a) of the main text. Let the layer at the bottom be called A layer (colored with blue in schematic). The layer above it can be placed in two types of triangular voids, one with the apex upwards and labeled B (green color), and the other with the apex downwards and labeled C (red color). Only one of these sites can be occupied, but not both. If the second layer is B, then, similarly, the third hexagonal close-packed layer can occupy either A or C positions and so on. Any sequence of letters, A, B and C with no two successive letters alike represents a possible manner of close-packing. In such a 3D structure, each sphere is surrounded by and touches other spheres.
The determined periodicity in the stacking sequence is a remarkable result because the DHCP structure has not been observed before in colloidal crystals of spheres. A recent study Meijer et al. (2007) has indicated that during the sedimentary formation process of a colloidal crystal the layers nucleate sequentially. The interactions between the layers are limited to the neighboring layers and results in the RHCP structure. The formation of a DHCP structure could just be one of the many random coincidental realizations of the RHCP structure. However, one cannot exclude the influence of the drying procedure as capillary forces of significant strength will act on the colloids during solvent evaporation Denkov et al. (1992) and might induce a structural reorganization.
Results of our reconstruction were also confirmed by an independent analysis of the reciprocal space data (see Ref. Meijer et al. (2014)), based on a simplified structure model consisting of a finite number of equally-sized hexagonal close-packed layers. In this model DHCP structure was also identified, however, results of the phase retrieval presented here provide much more detailed information about the structure of a colloidal grain.
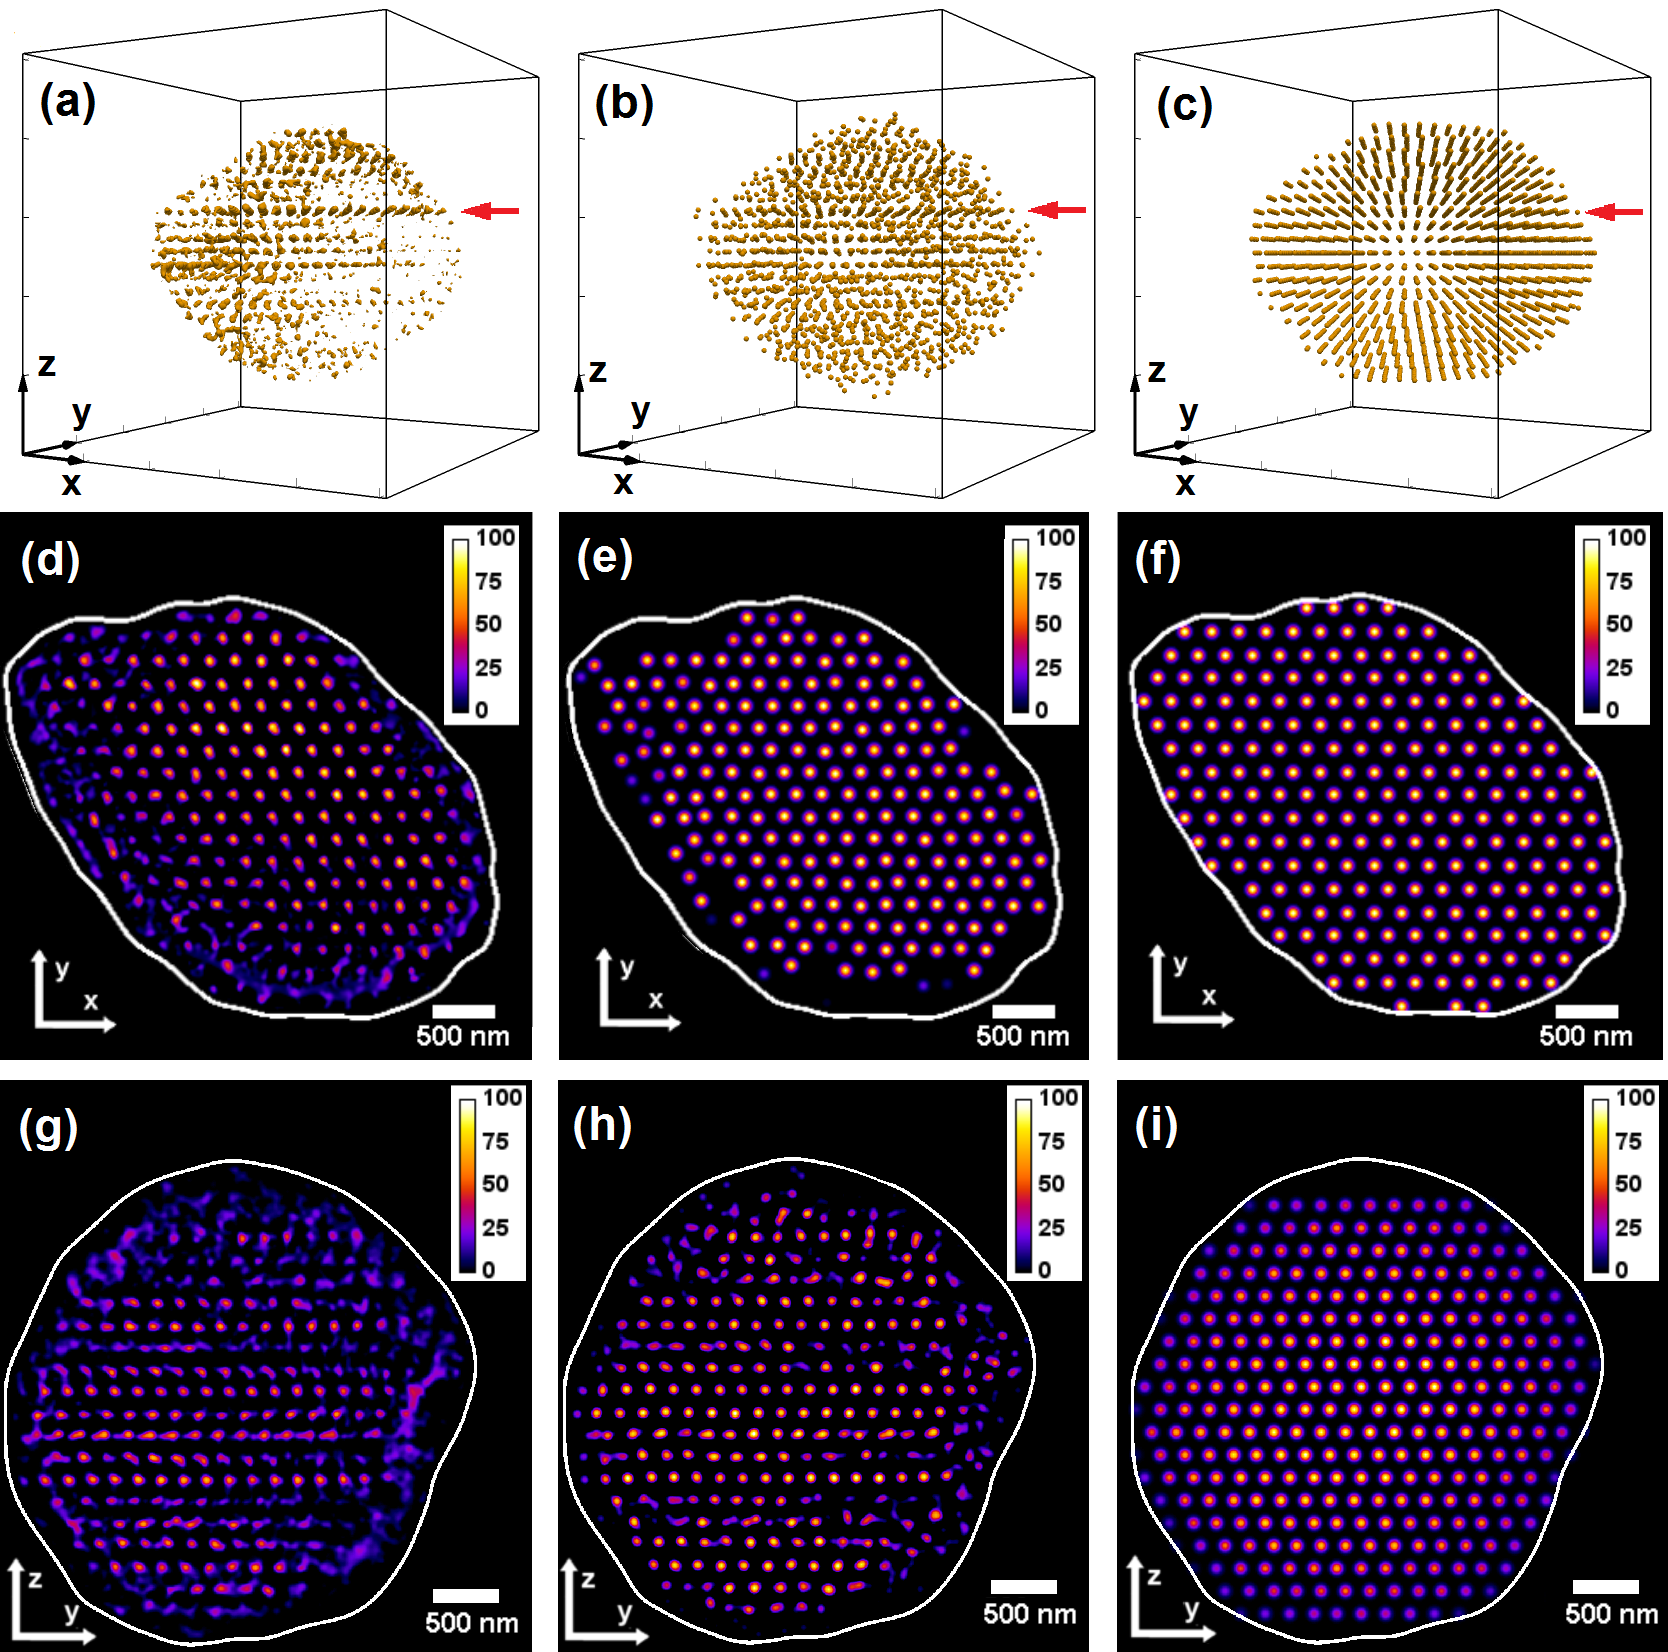
To verify our reconstruction results we compared them with the model of a perfect crystal grain with the same shape composed of perfect hexagonal layers with the same stacking sequence. In Figure 5(a) originally reconstructed 3D electron density function is presented. Next, in Figure 5(b) it is compared with the results of replacement of the positions of local maxima by identical 3D Gaussian functions with nm (FWHM). In the last Figure 5(c) we show a model crystal of the same shape composed of perfect hexagonal layers with the same stacking sequence as determined in our experiment. In Figures 5(d-f) slices through the corresponding 3D density maps are shown and in Figures 5(g-i) the projections on the [100] crystallographic direction are presented.
Such a comparison proves high quality of the reconstruction. All the geometrical characteristics of the colloidal particles arrangement revealed by reconstruction, such as distances between individual particles, hexagonal symmetry within each layer and interlayer spacing are in excellent agreement with the model. A comparison of the reconstructed and modeled structures in the projection demonstrates correctness of our approach for the stacking sequence determination based on relative lateral displacements between neighboring layers.
References
- Qi et al. (2015) W. Qi, Y. Peng, Y. Han, R. K. Bowles, and M. Dijkstra, Phys. Rev. Lett. 115, 185701 (2015).
- Wang et al. (2015) Z. Wang, F. Wang, Y. Peng, and Y. Han, Nat. Commun. 6 (2015).
- Statt et al. (2015) A. Statt, P. Virnau, and K. Binder, Phys. Rev. Lett. 114, 026101 (2015).
- Peng et al. (2015) Y. Peng, F. Wang, Z. Wang, A. M. Alsayed, Z. Zhang, A. G. Yodh, and Y. Han, Nat. Mater. 14, 101 (2015).
- DeGiuli et al. (2014) E. DeGiuli, E. Lerner, C. Brito, and M. Wyart, Proc. Natl. Acad. Sci. USA 111, 17054 (2014).
- Jacob et al. (2015) A. R. Jacob, A. S. Poulos, S. Kim, J. Vermant, and G. Petekidis, Phys. Rev. Lett. 115, 218301 (2015).
- Kim et al. (2011) S.-H. Kim, S. Y. Lee, S.-M. Yang, and G.-R. Yi, NPG Asia Mater. 3, 25 (2011).
- Kuzyk et al. (2012) A. Kuzyk, R. Schreiber, Z. Fan, G. Pardatscher, E.-M. Roller, A. Högele, F. C. Simmel, A. O. Govorov, and T. Liedl, Nature 483, 311 (2012).
- Henry et al. (2011) E. Henry, A. Dif, M. Schmutz, L. Legoff, F. Amblard, V. Marchi-Artzner, and F. Artzner, Nano Lett. 11, 5443 (2011).
- Zhang et al. (2013a) Y. Zhang, F. Lu, K. G. Yager, D. van der Lelie, and O. Gang, Nat. Nanotechnol. 8, 865 (2013a).
- Painter et al. (1999) O. Painter, R. K. Lee, A. Scherer, A. Yariv, J. D. O’brien, P. D. Dapkus, and I. Kim, Science 284, 1819 (1999).
- Zhang et al. (2013b) C. Zhang, R. J. Macfarlane, K. L. Young, C. H. J. Choi, L. Hao, E. Auyeung, G. Liu, X. Zhou, and C. A. Mirkin, Nat. Mater. 12, 741 (2013b).
- Yethiraj and van Blaaderen (2003) A. Yethiraj and A. van Blaaderen, Nature 421, 513 (2003).
- Pal et al. (2015) A. Pal, V. Malik, L. He, B. H. Erné, Y. Yin, W. K. Kegel, and A. V. Petukhov, Angew. Chem. Int. Ed. 127, 1823 (2015).
- Glotzer and Solomon (2007) S. C. Glotzer and M. J. Solomon, Nat. Mater. 6, 557 (2007).
- Petukhov et al. (2015) A. V. Petukhov, J.-M. Meijer, and G. J. Vroege, Curr. Opin. Colloid Interface Sci. 20, 272 (2015).
- Smallenburg et al. (2012) F. Smallenburg, L. Filion, M. Marechal, and M. Dijkstra, Proc. Natl. Acad. Sci. USA 109, 17886 (2012).
- Mahynski et al. (2014) N. A. Mahynski, A. Z. Panagiotopoulos, D. Meng, and S. K. Kumar, Nat. Commun. 5 (2014).
- Hilhorst et al. (2010) J. Hilhorst, J. R. Wolters, and A. V. Petukhov, CrystEngComm 12, 3820 (2010).
- Johnson and Joannopoulos (2002) S. G. Johnson and J. D. Joannopoulos, Photonic crystals: the road from theory to practice (Springer US, 2002).
- Hilhorst et al. (2009) J. Hilhorst, V. V. Abramova, A. Sinitskii, N. A. Sapoletova, K. S. Napolskii, A. A. Eliseev, D. V. Byelov, N. A. Grigoryeva, A. V. Vasilieva, W. G. Bouwman, K. Kvashnina, A. Snigirev, S. V. Grigoriev, and A. V. Petukhov, Langmuir 25, 10408 (2009).
- Vlasov et al. (2001) Y. A. Vlasov, X.-Z. Bo, J. C. Sturm, and D. J. Norris, Nature 414, 289 (2001).
- Soljačić et al. (2003) M. Soljačić, C. Luo, J. D. Joannopoulos, and S. Fan, Opt. Lett. 28, 637 (2003).
- Sulyanova et al. (2015) E. A. Sulyanova, A. Shabalin, A. V. Zozulya, J.-M. Meijer, D. Dzhigaev, O. Gorobtsov, R. P. Kurta, S. Lazarev, U. Lorenz, A. Singer, et al., Langmuir 31, 5274 (2015).
- Dinsmore et al. (2001) A. D. Dinsmore, E. R. Weeks, V. Prasad, A. C. Levitt, and D. A. Weitz, Appl. Opt. 40, 4152 (2001).
- Schall et al. (2004) P. Schall, I. Cohen, D. A. Weitz, and F. Spaepen, Science 305, 1944 (2004).
- Schall (2009) P. Schall, Rep. Prog. Phys. 72, 076601 (2009).
- Jiang et al. (1999) P. Jiang, J. F. Bertone, K. S. Hwang, and V. L. Colvin, Chem. Mater. 11, 2132 (1999).
- Ye et al. (2002) Y.-H. Ye, T. S. Mayer, I.-C. Khoo, I. B. Divliansky, N. Abrams, and T. E. Mallouk, J. Mater. Chem. 12, 3637 (2002).
- Bosak et al. (2010) A. Bosak, I. Snigireva, K. S. Napolskii, and A. Snigirev, Adv. Mater. 22, 3256 (2010).
- Hilhorst et al. (2012) J. Hilhorst, M. M. van Schooneveld, J. Wang, E. de Smit, T. Tyliszczak, J. Raabe, A. P. Hitchcock, M. Obst, F. M. F. de Groot, and A. V. Petukhov, Langmuir 28, 3614 (2012).
- Byelov et al. (2013) D. V. Byelov, J.-M. Meijer, I. Snigireva, A. Snigirev, L. Rossi, E. van den Pol, A. Kuijk, A. Philipse, A. Imhof, A. van Blaaderen, G. J. Vroege, and A. V. Petukhov, RSC Adv. 3, 15670 (2013).
- van Schooneveld et al. (2011) M. M. van Schooneveld, J. Hilhorst, A. V. Petukhov, T. Tyliszczak, J. Wang, B. M. Weckhuysen, F. M. F. de Groot, and E. de Smit, Small 7, 804 (2011).
- Sirota et al. (1989) E. B. Sirota, H. D. Ou-Yang, S. K. Sinha, P. M. Chaikin, J. D. Axe, and Y. Fujii, Phys. Rev. Lett. 62, 1524 (1989).
- Chen et al. (1994) L. B. Chen, M. K. Chow, B. J. Ackerson, and C. F. Zukoski, Langmuir 10, 2817 (1994).
- Miao et al. (1999) J. Miao, P. Charalambous, J. Kirz, and D. Sayre, Nature 400, 342 (1999).
- Robinson et al. (2001) I. K. Robinson, I. A. Vartanyants, G. J. Williams, M. A. Pfeifer, and J. A. Pitney, Phys. Rev. Lett. 87, 195505 (2001).
- Vartanyants and Yefanov (2015) I. A. Vartanyants and O. M. Yefanov (Pan Stanford Publishing, Singapore, 2015) pp. 341–384.
- Sayre (1952) D. Sayre, Acta Cryst. 5, 60 (1952).
- Note (1) Demonstration of this approach to reveal the structure of a single protein was given in a recent work performed at x-ray free-electron lasers Ayyer et al. (2016).
- Gulden et al. (2011) J. Gulden, O. M. Yefanov, E. Weckert, and I. A. Vartanyants, in The 10th international conference on X-ray microscopy, Vol. 1365 (AIP Publishing, 2011) pp. 42–45.
- Zuo et al. (2003) J. M. Zuo, I. A. Vartanyants, M. Gao, R. Zhang, and L. A. Nagahara, Science 300, 1419 (2003).
- Dronyak et al. (2010) R. Dronyak, K. S. Liang, J.-S. Tsai, Y. P. Stetsko, T.-K. Lee, and F.-R. Chen, Appl. Phys. Lett. 96, 221907 (2010).
- Chen et al. (2013) C.-C. Chen, C. Zhu, E. R. White, C.-Y. Chiu, M. C. Scott, B. C. Regan, L. D. Marks, Y. Huang, and J. Miao, Nature 496, 74 (2013).
- Gulden et al. (2010) J. Gulden, O. M. Yefanov, A. P. Mancuso, V. V. Abramova, J. Hilhorst, D. Byelov, I. Snigireva, A. Snigirev, A. V. Petukhov, and I. A. Vartanyants, Phys. Rev. B 81, 224105 (2010).
- Gulden et al. (2012) J. Gulden, O. M. Yefanov, A. P. Mancuso, R. Dronyak, A. Singer, V. Bernátová, A. Burkhardt, O. Polozhentsev, A. Soldatov, M. Sprung, and I. A. Vartanyants, Opt. Express 20, 4039 (2012).
- Zozulya et al. (2012) A. V. Zozulya, S. Bondarenko, A. Schavkan, F. Westermeier, G. Grübel, and M. Sprung, Opt. Express 20, 18967 (2012).
- Goodman (2005) J. W. Goodman, Introduction to Fourier Optics (Roberts and Company Publishers, 2005).
- Meijer et al. (2014) J.-M. Meijer, A. Shabalin, R. Dronyak, O. M. Yefanov, A. Singer, R. P. Kurta, U. Lorenz, O. Gorobstov, D. Dzhigaev, J. Gulden, D. V. Byelov, A. V. Zozulya, M. Sprung, I. A. Vartanyants, and A. V. Petukhov, J. Appl. Crystallogr. 47, 1199 (2014).
- Fienup (1982) J. R. Fienup, Appl. Opt. 21, 2758 (1982).
- Marchesini (2007) S. Marchesini, Rev. Sci. Instrum. 78, 011301 (2007).
- Marchesini et al. (2003) S. Marchesini, H. He, H. N. Chapman, S. P. Hau-Riege, A. Noy, M. R. Howells, U. Weierstall, and J. C. H. Spence, Phys. Rev. B 68, 140101 (2003).
- Woodcock (1997) L. V. Woodcock, Nature 385, 141 (1997).
- Petukhov et al. (2003) A. V. Petukhov, I. P. Dolbnya, D. G. A. L. Aarts, G. J. Vroege, and H. N. W. Lekkerkerker, Phys. Rev. Lett. 90, 028304 (2003).
- Dolbnya et al. (2005) I. P. Dolbnya, A. V. Petukhov, D. G. A. L. Aarts, G. J. Vroege, and H. N. W. Lekkerkerker, EPL 72, 962 (2005).
- (56) “See appendix for the experimental detailes and stacking sequence determination.” .
- Hettel (2014) R. Hettel, J. Synchrotron Radiat. 21, 843 (2014).
- Krishna et al. (1981) P. Krishna, D. Pandey, and C. A. Taylor, Close-packed structures (IUCr, 1981).
- Meijer et al. (2007) J.-M. Meijer, V. W. A. de Villeneuve, and A. V. Petukhov, Langmuir 23, 3554 (2007).
- Denkov et al. (1992) N. Denkov, O. Velev, P. Kralchevski, I. Ivanov, H. Yoshimura, and K. Nagayama, Langmuir 8, 3183 (1992).
- Ayyer et al. (2016) K. Ayyer, O. M. Yefanov, D. Oberthür, S. Roy-Chowdhury, L. Galli, V. Mariani, S. Basu, J. Coe, C. E. Conrad, R. Fromme, et al., Nature 530, 202 (2016).