Energy and time resolution for a LYSO matrix prototype of the Mu2e experiment
Abstract
We have measured the performances of a LYSO crystal matrix prototype tested with electron and photon beams in the energy range 60450 MeV. This study has been carried out to determine the achievable energy and time resolutions for the calorimeter of the Mu2e experiment.
keywords:
Calorimetry , scintillating crystals , avalanche photodiodesPACS:
29.40.Mc , 29.40.Vj1 Introduction
A matrix prototype, built with () mm3 LYSO scintillating crystals from SICCAS, was assembled in Frascati to study the performances of such a calorimeter for the Mu2e experiment [1]. Global transverse and longitudinal dimensions provide a coverage of and , respectively. Although the baseline crystal is now BaF2 [2], tests with electron and photon beams have been carried out to measure the calorimeter performances. Before the assembly, the crystals have been extensively tested using a 22Na source and a spectrophotometer. All of them showed good light yield, longitudinal response uniformity and transmittance. Each crystal has been wrapped with 60 m thick Enhanced Specular Reflector (ESR) from 3M and then optically connected to a Hamamatsu S8664 large area avalanche photodiode (APD) using Saint-Gobain BC-630 grease. Amplification and bias voltage regulation was provided by custom made front end electronic boards.
The LYSO matrix has been tested with tagged photon beams in the energy range 60190 MeV at MAMI [3] (Mainz, Germany) and with 80450 MeV electron beams at BTF [4] (Frascati, Italy). Here, the trigger was provided by two orthogonal () mm3 plastic scintillation counters read out by () mm2 silicon photomultipliers. Data were acquired with CAEN V1720 waveform digitizer, 250 Msps, 12 bit resolution and 02 V dynamic range. APDs were illuminated, through 250 m diameter fused silica optical fibers, by a green laser ( nm), whose pulse was synchronized with an external trigger at a frequency of Hz. Equalization of matrix channels at 10% level was obtained using minimum ionizing particles (MIPs) crossing vertically the detector. Calibration of cell response was done directly with beams (450 MeV electrons at BTF, 92.5 MeV photons at MAMI) firing on each cell center.
2 Test beam results
Beam events have been selected with a cut on the waveform time distribution, which retains the range corresponding to beam particles hitting the matrix. The total charge for each crystal is defined as the sum of the waveform spectrum in a selected time range, 400 ns wide, around the peak. Baseline is evaluated in a same width region, far from the peak. Multiple scattering events has been reduced by cutting on the distance between the energy weighted centroid and the impact point in the calorimeter, which is kept below 0.5 cm. For BTF beams, the particle multiplicity, , is greater than one and it can be tuned by adjusting beam intensity and collimators. In our test it was set to . Peaks due to one, two and three particle events are clearly visible and well separated in the energy spectra. In this analysis, single and double particle events have been selected with a cut in the total charge of both scintillator counters and matrix.
The energy scale has been set, after the offline equalization, by comparing the total reconstructed charge in the matrix with the expected energy deposited in the entire matrix, , as estimated by a GEANT4 simulation. Besides the beam spatial spread, an additional constant 2.6% Gaussian smearing is needed in the simulation to reproduce real data, accounting for miscalibration, non uniformity and non linearity (Fig. 1).
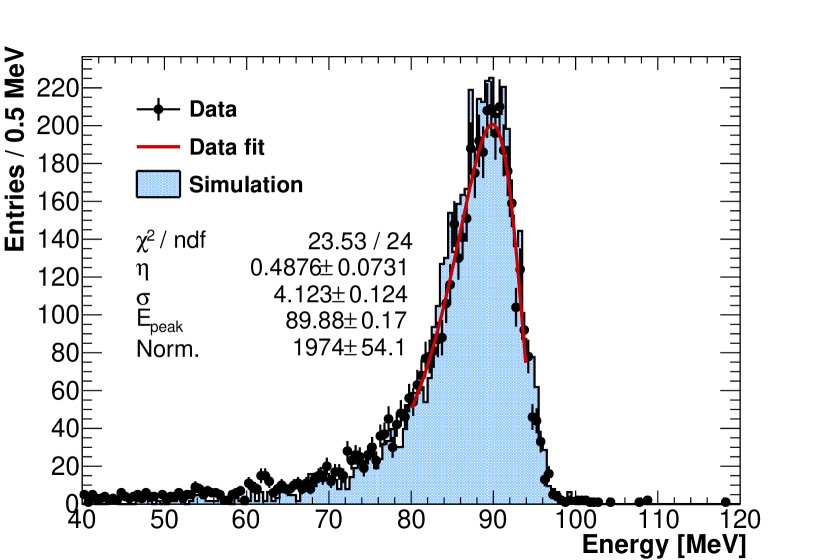
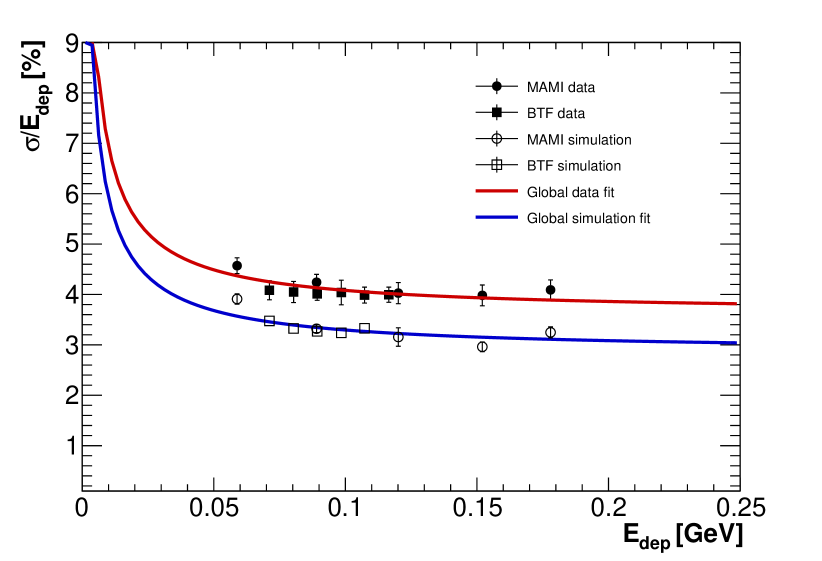
The energy resolution has been obtained from a fit with a Lognormal distribution to the energy spectra. While at MAMI the beam energy spread is negligible, at BTF it is of the order of 5% in our energy range. Therefore, for each energy, the intrinsic energy spread of the beam, , has been obtained by comparing the energy resolution of one-particle and two-particle events. After subtracting , the energy resolution is reported as a function of the deposited energy in Fig. 2 both for electron and photon beams. In the same figure, the corresponding simulated events without including the Gaussian smearing are also reported. A fit is then performed with the formula:
| (1) |
The extracted parameters are: , . The same parametrization on Monte Carlo (MC) events provides , .
The time of the event has been extracted from a fit to the waveform shape of the digitizer, performed with a Landau function. A residual time walk is observed, so that slewing corrections are applied. Time resolution has been measured with electrons using both the central crystal and the energy-weighted time of the whole matrix. In both cases, the time of the external trigger, defined as the semi-sum of the time for scintillation counters, has been subtracted event by event. The time jitter of the trigger has been measured from a Gaussian fit to the time difference of the two scintillation counters: ps. After subtracting the trigger jitter, the calorimeter time resolution as a function of the deposited energy is reported in Fig. 3. To exploit the low energy region, the time resolution has been also evaluated with minimum ionizing particles and with special runs where the beam hits in the middle of two crystals, using their time difference. Data have been fit taking into account the stochastic contribution only, and are well parametrized by the scaling law:
| (2) |
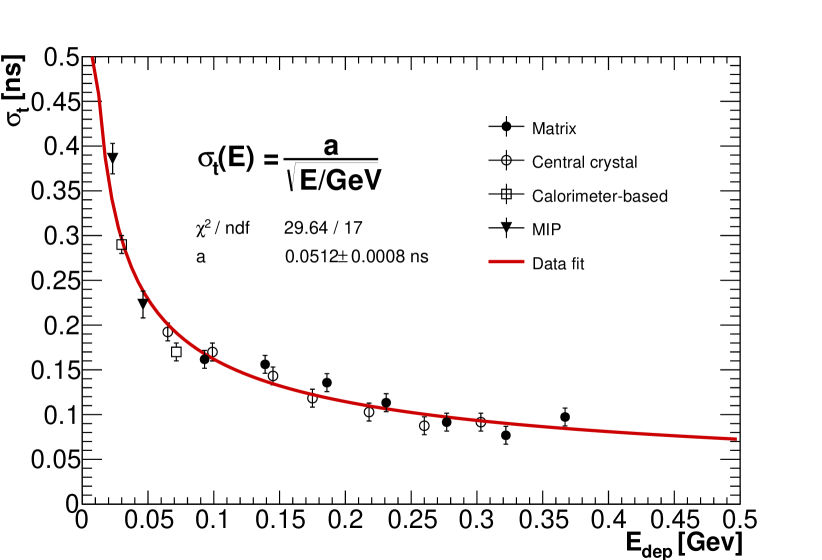
The measured performances well satisfy the requirements of the Mu2e calorimeter, that are set to and ps for 100 MeV electrons.
References
- [1] J. Budagov et al., “The calorimeter project for the Mu2e experiment”, Nucl. Instrum. Meth. A 718 (2013) 56.
- [2] L. Bartoszek et al. (Mu2e Experiment), “Mu2e Technical Design Report”, arXiv:1501.05241 (2015).
- [3] K. H. Kaiser et al., “The 1.5 GeV Harmonic Double-Sided Microtron at Mainz University”, Nucl. Instr. Meth. A 593 (2008) 159.
- [4] A. Ghigo, G. Mazzitelli, F. Sannibale, P. Valente, and G. Vignola, “Commissioning of the DAFNE beam test facility”, Nucl. Instrum. Meth. A 515 (2003) 524.