Models and Algorithms for Graph Watermarking
Abstract
We introduce models and algorithmic foundations for graph watermarking. Our frameworks include security definitions and proofs, as well as characterizations when graph watermarking is algorithmically feasible, in spite of the fact that the general problem is NP-complete by simple reductions from the subgraph isomorphism or graph edit distance problems. In the digital watermarking of many types of files, an implicit step in the recovery of a watermark is the mapping of individual pieces of data, such as image pixels or movie frames, from one object to another. In graphs, this step corresponds to approximately matching vertices of one graph to another based on graph invariants such as vertex degree. Our approach is based on characterizing the feasibility of graph watermarking in terms of keygen, marking, and identification functions defined over graph families with known distributions. We demonstrate the strength of this approach with exemplary watermarking schemes for two random graph models, the classic Erdős-Rényi model and a random power-law graph model, both of which are used to model real-world networks.
1 Introduction
In the classic media watermarking problem, we are given a digital representation, , for some media object, , such as a piece of music, a video, or an image, such that there is a rich space, , of possible representations for besides that are all more-or-less equivalent. Informally, a digital watermarking scheme for is a function that maps and a reasonably short random message, , to an alternative representation, , for in . The verification of such a marking scheme takes and a presumably-marked representation, (which was possibly altered by an adversary), along with the set of messages previously used for marking, and it either identifies the message from this set that was assigned to or it indicates a failure. Ideally, it should difficult for an adversary to transform a representation, (which he was given), into another representation in , that causes the identification function to fail. Some example applications of such digital watermarking schemes include steganographic communication and marking digital works for copyright protection (e.g., see [16, 25, 50]).
With respect to digital representations of media objects that are intended to be rendered for human performances, such as music, videos, and images, there is a well-established literature on digital watermarking schemes and even well-developed models for such schemes (e.g., see Hopper et al. [24]). Typically, such watermarking schemes take advantage of the fact that rendered works have many possible representations with almost imperceptibly different renderings from the perspective of a human viewer or listener.
In this paper, we are inspired by recent systems work on graph watermarking by Zhao et al. [56, 55], who propose a digital watermarking scheme for graphs, such as social networks, protein-interaction graphs, etc., which are to be used for commercial, entertainment, or scientific purposes. This work by Zhao et al. presents a system and experimental results for their particular method for performing graph watermarking, but it is lacking in formal security and algorithmic foundations. For example, Zhao et al. do not provide formal proofs for circumstances under which graph watermarking is undetectable or when it is computationally feasible. Thus, as complementary work to the systems results of Zhao et al., we are interested in the present paper in providing models and algorithms for graph watermarking, in the spirit of the watermarking model provided by Hopper et al. [24] for media files. In particular, we are interested in providing a framework for identifying when graph watermarking is secure and computationally feasible.
1.1 Additional Related Work
Under the term “graph watermarking,” there is some additional work, although it is not actually for the problem of graph watermarking as we are defining it. For instance, there is a line of research involving software watermarking using graph-theoretic concepts and encodings. In this case, the object being marked is a piece of software and the goal of a “graph watermarking” scheme is to create a graph, , from a message, , and then embed into the control flow of a piece of software, , to mark . Examples of such work include pioneering work by Collberg and Thomborson [15], as well as subsequent work by Venkatesan, Vazirani, and Sinha [52] and Collberg et al. [14]. (See also Chen et al. [7] and Bento et al. [4], as well as a survey by Hamilton and Danicic [22].) This work on software watermarking differs from the graph watermarking problem we study in the present paper, however, because in the graph watermarking problem we study an input graph is provided and we want to alter it to add a mark. In the graph-based software watermarking problem, a graph is instead created from a message to have a specific, known structure, such as being a permutation graph, and then that graph is embedded into the control flow of the piece of software.
A line of research that is more related to the graph watermarking problem we study is anonymization and de-anonymization for social networks (e.g., see [3, 57, 23, 26, 37, 43, 53]). One of the closest examples of such prior work is by Backstrom, Dwork, and Kleinberg [3], who show how to introduce a small set of “rogue” vertices into a social network and connect them to each other and to other vertices so that if that same network is approximately replicated in another setting it is easy to match the two copies. Such work differs from graph watermarking, however, because the set of rogue vertices are designed to “stand out” from the rest of the graph rather than “blend in,” and it may in some cases be relatively easy for an adversary to identify and remove such rogue vertices. Also, we would ideally prefer graph watermarking schemes that make small changes to the adjacencies of existing vertices rather than mark a graph by introducing new vertices, since in some applications it may not be possible to introduce new vertices into a graph that we wish to watermark. In addition to this work, also of note is work by Narayanan and Shmatikov [43], who study the problem of approximately matching two social networks without marking, as well as the work on Khanna and Zane [28] for watermarking road networks by perterbing vertex positions (which is a marking method outside the scope of our approach).
Our approach to graph watermarking is also necessarily related to the problem of graph isomorphism and its approximation (e.g., see [1, 2, 17, 27, 30, 46]). In the graph isomorphism problem, we are given two -vertex graphs, and , and asked if there is a mapping, , of vertices in to vertices in such that is an edge in if and only if is an edge in . While the graph isomorphism problem is “famous” for having an uncertain, but unlikely [1], with respect to being NP-complete, extensions to subgraph isomorphism and graph edit distance are known to be NP-complete (e.g., see [20]).
1.2 Our Results
In this paper, we introduce a general graph watermarking framework that is based on the use of key generation, marking, and identification functions, as well as a hypothetical watermarking security experiment (which would be performed by an adversary). We define these functions in terms of graphs taken over random families of graphs, which allows us to quantify situations in which graph watermarking is provably feasible.
We also provide some graph watermarking schemes as examples of our framework, defined in terms of the classic Erdős-Rényi random-graph model and a random power-law graph model. Our schemes extend and build upon previous results on graph isomorphism for these graph families, which may be of independent interest. In particular, we design simple marking schemes for these random graph families based on simple edge-flipping strategies involving high- and medium-degree vertices. Analyzing the correctness of our schemes is quite nontrivial, however, and our analysis and proofs involve intricate probabilistic arguments. We provide an analysis of our scheme against adversaries that can themselves flip edges in order to defeat our mark identification algorithms. In addition, we provide experimental validation of our algorithms, showing that our edge-flipping scheme can succeed for a graph without specific knowledge of the parameters of its deriving graph family. We also conducted experiments to fit real-world networks to the random power-law graph model, which gave results that showed that the model was generally a good fit for the networks tested but the learned values did not fall into the range needed for our scheme.
2 Our Watermarking Framework
We begin by presenting a general framework for graph watermarking, which differs from the general model of Hopper et al. [24], but is similar in spirit.
Suppose we are given an undirected graph, , that we wish to mark. To define the security of a watermarking scheme for , must come from a family of graphs with some degree of entropy [56]. We formalize this by assuming a probability distribution over the family of graphs from which is taken.
Definition 1.
A graph watermarking scheme is a tuple over a set, , of graphs where
-
•
is a private key generation function, such that is a list of (pseudo-)random graph elements, such as vertices and/or vertex pairs, defined over a graph of vertices. These candidate locations for marking are defined independent of a specific graph; that is, vertices in are identified simply by the numbering from to . For example, could be a small random graph, , and some random edges to connect to a larger input graph [56], or could be a set of vertex pairs in an input graph that form candidate locations for marking.
-
•
takes a private key generated by , and a specific graph from , and returns a pair, , such that is a unique identifier for and is the graph obtained by adding the mark determined by to in the location determined determined by the private key . is called every time a different marked copy needs to be produced, with the -th copy being denoted by . Therefore, the unique identifiers should be thought of as being generated randomly. To associate a marked graph with the user who receives it, the watermarking scheme can be augmented with a table storing user name and unique identifiers. Alternatively, the identifiers can be generated pseudo-randomly as a hash of a private key provided by the user.
-
•
takes a private key from , the original graph, , identifiers of previously-marked copies of , and a test graph, , and it returns the identifier, , of the watermarked graph that it is identifying as a match for . It may also return , as an indication of failure, if it does not identify any of the graphs as a match for .
In addition, in order for a watermarking scheme to be effective, we require that with high probability111Or “whp,” that is, with probability at least , for some . over the graphs from and output pairs, of , for any , we have .
Algorithm 1 shows a hypothetical security experiment for a watermarking scheme with respect to an adversary, , who is trying to defeat the scheme. Intuitively, in the hypothetical experiment, we generate a key , choose a graph , from family according to distribution (as discussed above), and then generate marked graphs according to our scheme (for some set of messages). Next, we randomly choose one of the marked graphs, , and communicate it to an adversary. The adversary then outputs a graph that is similar to where his goal is to cause our identification algorithm to fail on .
-
1.
-
2.
-
3.
, for
-
4.
randomly choose from
-
5.
In order to characterize differences between graphs, we assume a similarity measure , defining the distance between graphs in family . We also include a similarity threshold , that defines the advantage of an adversary performing the experiment in Algorithm 1. Specifically, the advantage of an adversary, who is trying to defeat our watermarking scheme is
The watermarking scheme is -secure against adversary if the similarity threshold is and ’s advantage is polynomially negligible (i.e., is for some ).
Examples of adversaries could include the following:
-
•
Arbitrary edge-flipping adversary: a malicious adversary who can arbitrarily flip edges in the graph. That is, the adversary adds an edge if it is not already there, and removes it otherwise.
-
•
Random edge-flipping adversary: an adversary who independently flips each edge with a given probability.
-
•
Arbitrary adversary: a malicious adversary who can arbitrarily add and/or remove vertices and flip edges in the graph.
-
•
Random adversary: an adversary who independently adds and/or removes vertices with a given probability and independently flips each edge with a given probability.
One could also imagine other types of adversaries, as well, such as a random adversary who is limited in terms of the numbers or types of edges or vertices that he can change.
2.1 Random graph models
As defined above, a graph watermarking scheme requires that graphs to be marked come from some distribution. In this paper, we consider two families of random graphs—the classic Erdős-Rényi model and a random power-law graph model—which should capture large classes of applications where graph watermarking would be of interest.
Definition 2 (The Erdős-Rényi model).
A random graph is a graph with vertices, where each of the possible edges appears in the graph independently with probability .
Definition 3 (The random power-law graph model, §5.3 of [9]).
Given a sequence , such that , the general random graph is defined by labeling the vertices through and choosing each edge independently from the others with probability , where .
We define a random power-law graph parameterized by the maximum degree and average degree . Let for values of in the range between and , where
| (1) |
This definition implies that each edge appears with probability
| (2) |
As we show in the following proposition, this model does indeed have a power-law degree distribution.
Proposition 4.
In the random power-law graph , the expected number of vertices with degree is between and where .
Proof.
The function relating the index of a vertex to its expected degree is convex and decreasing. By the mean value theorem, the number of indices such that satisfies
Now the derivative of is . Noting that is the expected number of vertices of degree , the result is proven. ∎
2.2 Graph watermarking algorithms
We discuss some instantiations of the graph watermarking framework defined above. Unlike previous watermarking or de-anonymization schemes that add vertices [3, 56], we describe an effective and efficient scheme based solely on edge flipping. Such an approach would be especially useful for applications where it could be infeasible to add vertices as part of a watermark.
Our scheme does not require adding labels to the vertices or additional objects stored in the graph for identification purposes. Instead, we simply rely on the structural properties of graphs for the purposes of marking. In particular, we focus on the use of vertex degrees, that is, the number of edges incident on each vertex. We identify high and medium degree vertices as candidates for finding edges that can be flipped in the course of marking. The specific degree thresholds for what we mean by “high-degree” and “medium-degree” depend on the graph family, however, so we postpone defining these notions precisely until our analysis sections.
Algorithms providing an example implementation of our graph watermarking scheme are shown in Algorithm 2. The algorithm randomly selects a set of candidate vertex pairs for flipping, from among the high- and medium-degree vertices, with no vertex being incident to more than a parameter of candidate pairs. We introduce a procedure, , which labels high-degree vertices by their degree ranks and each medium-degree vertex, , by a bit vector identifying its high-degree adjacencies. This bit vector has a bit for each high-degree vertex, which is for neighbors of and for non-neighbors. The algorithm , takes a random set of candidate edges and a graph, , and it flips the corresponding edges in according to a resampling of the edges using the distribution . The algorithm, approximate-isomorphism, returns a mapping of the high- and medium-degree vertices in to matching high- and medium-degree vertices in , if possible. The algorithm, , uses the approximate isomorphism algorithm to match up high- and medium-degree vertices in and , and then it extracts the bit-vector from this matching using .
-
1.
Let denote the total number of high- and medium-degree vertices
-
2.
-
3.
Let be a list of pairs randomly sampled (without replacement) from such that no end vertex appears more than times
-
4.
return
-
1.
sort the vertices in decreasing order by degree and identify the high- and medium-degree vertices
-
2.
if the degrees of high-degree vertices are not unique, return failure
-
3.
label each high-degree vertex with its position in the vertex sequence
-
4.
label each medium-degree vertex with a bit vector encoding its high-degree adjacencies
-
5.
if the bit vectors are not unique, return failure
-
6.
otherwise, return the labelings
-
1.
-
2.
is the set of high- and medium-degree vertices of , sorted lexicographically by their labels given by
-
3.
generate an -bit string where each bit is independently set to 1 with probability , where is the probability of the edge in
-
4.
let be a copy of
-
5.
for from 1 to :
-
6.
-
7.
if is 1:
-
8.
insert edge in
-
9.
else:
-
10.
remove edge from
-
11.
return
-
1.
call and , returning failure if either of these fail.
-
2.
match each of ’s high-degree vertices with the vertex in with the same label.
-
3.
match each of ’s medium-degree vertices with the vertex in whose label is closest in Hamming distance.
-
4.
if has a vertex that is matched more than once, return failure.
-
5.
otherwise, return the (partial) vertex assignments between and .
-
1.
find an approximate-isomorphism(), returning if failure occurred at any step.
-
2.
is the set of high- and medium-degree vertices of , sorted lexicographically by their labels given by
-
3.
is the set of vertices of identified as corresponding to those in , in that same order.
-
4.
is an empty bit string
-
5.
for in (from left to right):
-
6.
iff there is an edge between and in .
-
7.
append to
-
8.
return among the ’s the one closest to
As mentioned above, we also need a notion of distance for graphs. We use two different such notions. The first is the graph edit distance, which is the minimum number of edges needed to flip to go from one graph to another. The second is vertex distance, which intuitively is an edge-flipping metric localized to vertices.
Definition 5 (Graph distances).
Let be the set of graphs on vertices. If , define as the set of bijections between the vertex sets and . Define the graph edit distance as
where is the symmetric difference of the two edge sets under correspondence . Define the vertex distance as
where is the set of edges incident to .
3 Identifying High- and Medium-Degree Vertices
We begin analyzing our proposed graph watermarking scheme by showing how high- and medium-degree vertices can be identified under our two random graph distributions. We begin with some technical results related to graph isomorphism that form the basis of our watermarking approach, with the goal of determining the conditions under which a vertex of a random graph can be identified with high probability, either by its degree (if the degree is high) or by its set of high-degree neighbors (if it has medium degree). We ignore low-degree vertices: their information content and distinguishability are low, and they are not used by our example scheme. Because our results on vertex identifiability are used in our graph watermarking scheme, we also determine how robust these identifications are, based on how well-separated the vertices are by their degrees.
We first find a threshold number such that the vertices with highest degree are likely to have distinct and well-separated degree values. We call these vertices the high-degree vertices. Next, we look among the remaining vertices for those that are well-separated in terms of their high-degree neighbors. Specifically, the (high-degree) neighborhood distance between two vertices is the number of high-degree vertices which are connected to exactly one of the two vertices. Note that we will omit the term “high-degree” in “high-degree neighborhood distance” from now on, as it will always be implied.
In the Erdős-Rényi model, we show that all vertices that are not high-degree nevertheless have well-separated high-degree neighborhoods whp. In the random power-law graph model, however, there will be many lower-degree vertices whose high-degree neighborhoods cannot be separated. Those that have well-separated high-degree neighborhoods with high probability form the medium-degree vertices, and the rest are the low-degree vertices.
For completeness, we include the following well-known Chernoff concentration bound, which we will refer to time and again.
Lemma 6 (Chernoff inequality [9]).
Let be independent random variables with
We consider the sum , with expectation . Then
3.1 Vertex separation in the Erdős-Rényi model
Let us next consider vertex separation results for the classic Erdős-Rényi random-graph model. Recall that in this model, each edge is chosen independently with probability .
Definition 7.
Index vertices in non-increasing order by degree. Let represent the -th highest degree in the graph. Given , we say that a vertex is high-degree with respect to if it has degree at least . Otherwise, we say that the vertex is medium-degree. We just say high-degree when the value of is understood from context.
Note that in this random-graph model, there are no low-degree vertices.
Definition 8.
A graph is -separated if all high-degree vertices differ in their degree by at least and all medium-degree vertices are neighborhood distance apart.
Note: this definition depends on how high-degree or medium-degree vertices are defined and will therefore be different for the random power-law graph model.
Lemma 9 (Extension of Theorem 3.15 in [5]).
Suppose , , and . Then with probability
is such that
where .
Proof.
We quantify and extend the probability analysis of a proof from [5]. Let
The event of the result fails if or if there is such that .
The statement of theorem 3.12 of [5] still holds when the words “a.e. satisfies” are replaced by “ satisfies with probability greater than ”. This can be seen directly from the part of the proof where Chebychev’s inequality is applied.
By this result, the probability that is . The probability that for a given is . ∎
Lemma 10 (Vertex separation in the Erdős-Rényi model).
Let , , , . Suppose is such that . Then is -separated with probability .
Proof.
We prove the theorem with probability at least . Let and . By Lemma 9, the probability that for some is at most .
Let be the expected neighborhood distance between two vertices . We have
so that, if ,
Since the high-degree vertices are separated by more than two degrees, the fact that they are high-degree vertices is independent of whether they are neighbors of and . Consequently, we can apply a Chernoff bound (Lemma 6.) Then, by the union bound, the probability that for some medium-degree is less than . ∎
Thus, high-degree vertices are well-separated with high probability in the Erdős-Rényi model, and the medium-degree vertices are distinguished with high probability by their high-degree neighborhoods.
3.2 Vertex separation in the random power-law graph model
We next study vertex separation for a random power-law graph model, which can match the degree distributions of many graphs that naturally occur in social networking and science. For more information about power-law graphs and their applications, see e.g. [6, 40, 44].
In the random power-law graph model, vertex indices are used to define edge weights and therefore do not necessarily start at 1. The lowest index that corresponds to an actual vertex is denoted . So vertex indices range from to . Additionally, there are two other special indices and , which we define in this section, that separate the three classes of vertices.
Definition 11.
The vertices ranging from to are the high-degree vertices, those that range from to are the medium-degree vertices, and those beyond are the low-degree vertices.
In this model, the value of is constrained by the requirement that . When , this constraint is not actually restrictive. However, when , must be asymptotically greater than . The constraints on also constrain the value of the maximal and average degree of the graph.
We define and to be independent of , but dependent on parameters that control the amount and probability of separation at each level. The constraints that and translate into corresponding restrictions on the valid values of , namely that and . We define in the following lemma.
Lemma 12 (Separation of high-degree vertices).
In the model, let . Then,
| (3) |
Moreover, for all satisfying and , the probability that
is at least .
Proof.
The first statement follows from the fact that is a convex function of and from taking its derivative at and .
For the second statement, let and let . We will show that if , then
| (4) |
Now we choose such that . The inequality implies that and (4) holds for all . By the union bound applied to Eq. 4
Since , the right hand side is bounded above by . This proves the result.
Now, we prove Eq. 4. Clearly, since , we have that . So if and , then . This implies that
where the second inequality follows from Eq. 3 and the definition of given in Definition 3. If , the right hand side is lower-bounded by . The result follows by applying a Chernoff bound (Lemma 6). ∎
For simplicity, we often use the following observation.
Observation 13.
Rewriting to show its dependence on , we have
| (5) |
For the graph model to make sense, the high-degree threshold must be asymptotically greater than the lowest index. In other words, we must have that . Since , this implies that .
We next define , the degree threshold for medium-degree vertices, in the following lemma.
Lemma 14 (Separation of medium-degree vertices).
Let be defined as in Definition 3, be defined as in Eq. 5, and
| (6) |
Let denote the neighborhood distance between two vertices and in . If , for every and , the probability that
where
| (7) |
is at least for sufficiently large .
Proof.
Let and let
We claim that if , then
| (8) |
If we choose , we have that , so that Eq. 8 applies to all such that . Moreover, since
our choice of implies that . By applying the union bound to Eq. 8, we have
which establishes the lemma.
Let us now prove the claim. Observe that is the sum over the high-degree vertices , of indicator variables for the event that vertex is connected to exactly one of the vertices and . It i For fixed and , these are independent random variables. Therefore, we can apply a Chernoff bound. The probability that is
Since , for sufficiently large , this expression is bounded below by , and
by Eq. 2, Eq. 5 and Eq. 7, as can be shown by a straightforward but lengthy computation. Let . This implies that
Therefore, applying the Chernoff bound (Lemma 6) to the for fixed and and all high-degree vertices proves the claim. ∎
Observation 15.
We would have the undesirable situation that whenever , or equivalently when . In fact, in order for , we must have .
We illustrate the breakpoints for high-, medium-, and low-degree vertices in Fig. 1.

The next lemma summarizes the above discussion and provides the forms of and that we use in our analysis.
Lemma 16 (Vertex separation in the power-law model).
Let . Fix . Let and where and . Let
For sufficiently large , the probability that a graph is not -separated is at most .
Proof.
Let be defined as in Lemma 12. A straightforward computation using Eq. 1, Eq. 3, and Eq. 5 shows that
So for sufficiently large , we have . For all , the average degrees of consecutive vertices are at least apart. So for two high-degree vertices to be within of each other, at least one of the two must have degree at least away from its expected degree. By Lemma 12, the probability that some high-degree vertex satisfies is at most .
By Lemma 14, the probability that there are two medium-degree vertices with neighborhood distance less than is at most . ∎
Thus, our marking scheme for the random power-law graph model is effective.
4 Adversary Tolerance
In this section, we study the degree to which our exemplary graph watermarking scheme can tolerate an arbitrary edge-flipping adversary. To measure success, we use the notion of security and adversary advantage which are formally defined in 2. We quantify the number of edge flips that can be tolerated under the Erdős-Rényi model and the random power-law graph model.
Theorem 17 (Security against an arbitrary edge-flipping adversary in the Erdős-Rényi model).
Let , , and such that . Let be sufficiently large so that
| (9) |
Suppose the similarity measure is the vertex distance , the similarity threshold is , we have a number of watermarked copies, and their identifiers are generated using bits. Suppose also that the identifiers map to sets of edges of a graph constrained by the fact that no more than edges can be incident to any vertex. The watermarking scheme defined in Algorithm 2 is -secure against any deterministic adversary.
The proof of this theorem relies on two lemmas. Lemma 18 identifies conditions under which a set of bit vectors with bits independently set to 1 is unlikely to have two close bit vectors. Lemma 19 states that a deterministic adversary’s ability to guess the location of the watermark is limited. Informally, this is because the watermarked graph was obtained through a random process, so that there are many likely original graphs that could have produced it.
Lemma 18 (Separation of IDs).
Consider random bit strings of length , where each bit is independently set to 1, and the i-th bit is 1 with probability satisfying for a fixed value . The probability that at least two of these strings are within Hamming distance of each other is at most if .
Proof.
The expected distance between two such strings is at least Applying Lemma 6 with , we have that the probability that their Hamming distance is less than is at most . Therefore, the probability that at least two out of strings are within Hamming distance of each other is at most . ∎
Lemma 19 (Guessing power of adversary).
Consider a complete graph on vertices, and let of its edges be red. Let be a sample of edges chosen uniformly at random among those that satisfy the constraint that no more than edges of the sample can be incident to any one vertex. Suppose also that and are non-decreasing functions of such that
| (10) |
For sufficiently large , the probability that contains at least red edges is bounded by . Moreover, if , then the probability that contains at least red edge is bounded by , for some and for sufficiently large .
Proof.
In the process of selecting edges without replacement, let be the event that the sample contain at least red edges, and let be the event that the sample satisfies the degree constraint. The event whose probability we want to bound is equal to
Let us first show that can be lower bounded by a constant. To prove this, we select vertices with replacement uniformly at random, and pair consecutive vertices to obtain edges. Choosing vertices uniformly in this way will simplify showing that the degree constraint is satisfied. Of course we want to avoid “self-loops”, or edges where both end vertices are the same. Let denote the event that there is a vertex that is incident to more than edges of the sample. Also, let denote the event that the sample contains no self-loops and no duplicate edges. Then
Now, the probability of encountering a self-loop is and the probability of an edge being a duplicate of another is at most . Therefore,
By Eq. 10, . So is bounded away from 0. Moreover, since the edges now consist of pairs of independently chosen vertices, we can approximate the number of edges incident to each vertex by independent Poisson random variables with parameter thusly:
where the middle factor is a bound on the probability that one Poisson variable is at least (Theorem 5.4 of [41]), and the last factor is an adjustment factor for this approximation (Corollary 5.9 of [41]). This expression is bounded by a constant factor times the expression on the left-hand side of Eq. 10. Consequently, converges to 0, and for sufficiently large , , as was to be shown.
Now we find an upper bound for . To do this, we select edges with replacement uniformly at random. Because is relatively small when compared to , it is unlikely that the sample will contain any duplicates. Formally, let be the event that the sample contains at least red edges, and be the event that the sample consists of distinct edges. We have
The probability that two selected edges are the same edge is . So
So for large enough , is bounded below by .
Finally, we bound . The expected number of red edges in this sample is which is bounded below by and bounded above by . So using these bounds and a Chernoff bound (Lemma 6), where we set equal to , we have that
If as , set equal to :
for some constant . Putting it all together, we have that for large enough , and is bounded above by times one of the two bounds for . This proves the result. ∎
Theorem 17.
An upper bound on the advantage of any deterministic adversary on graphs on vertices is given by the conditional probability
where the parameters passed to are defined according to the experiment in Algorithm 1. We show that this quantity is polynomially negligible.
For to be successfully identified, it is sufficient for the following three conditions to hold:
-
1.
the original graph is -separated;
-
2.
the Hamming distance between any two and involved in a pair in is at least ;
-
3.
changes no edges of the watermark.
These are sufficient conditions because we only test graphs whose vertices had at most incident edges modified by the adversary, and another incident edges modified by the watermarking. So for original graphs that are -separated, the labeling of the vertices can be successfully recovered. Finally, if the adversary does not modify any potential edge that is part of the watermark, the of the graph is intact and can be recovered from the labeling.
Now, by Lemma 10, the probability that is not -separated is less than . Moreover, since , by Lemma 18, the probability that there are two identifiers in that are within of each other is at most .
Finally, for graphs in which an adversary makes fewer than modifications per vertex, the total number of edges the adversary can modify is . Since all vertices are high- and medium-degree vertices in this model, . Therefore, . Equation 9 guarantees that the hypothesis given by Eq. 10 of Lemma 19 is satisfied. Consequently, the probability that changes one or more adversary edges is for some constant .
This proves that each of the three conditions listed above fails with polynomially negligible probability, which implies that the conditional probability is also polynomially negligible. ∎
Theorem 20 (Security against an arbitrary edge-flipping adversary in the random power-law graph model).
Let , , and where , and .
Let . Suppose the similarity measure is a vector of distances , that the corresponding similarity threshold is the vector where is the maximum number of edges the adversary can flip in total, and the maximum number number of edges it can flip per vertex. Suppose that we have watermarked copies of the graph, that we use to watermark a graph.
Suppose also that the identifiers map to sets of edges of a graph constrained by the fact that no more than edges can be incident to any vertex. Then the watermarking scheme defined in Algorithm 2 is -secure against any deterministic adversary.
Proof.
The proof is similar to the proof of Theorem 17. An upper bound on the advantage of any deterministic adversary on graphs on vertices is given by the conditional probability
where the parameters passed to are defined according to the experiment in Algorithm 1. We show that this quantity is polynomially negligible.
For to be successfully identified, it is sufficient for the following three conditions to hold:
-
1.
the original graph is -separated;
-
2.
the Hamming distance between any two and involved in a pair in is at least ;
-
3.
changes fewer than edges of the watermark.
The proof is similar to the proof of Theorem 17. To be able to apply Lemma 19, we need to show that Eq. 10 holds with . Recall that
where
By the definition of s given in the statement of this theorem, we have
for a constant . Therefore
| (11) |
where and are constants and and are linear functions of that are parameterized by . In particular,
For the range of values of we are concerned with (i.e., ), the first factor is negative. Since is positive, this shows that Eq. 11 converges to 0 as .
Now we prove that each of the three listed conditions fails with polynomially negligible probability. We invoke Lemma 16 to show that this is the case for the first condition. For the second condition, we use the fact that each bit is independently set to 1 with some probability where and . Thus is a lower bound on these probabilities. This, together with the definition of given in this theorem, allow for the hypotheses of Lemma 18 to be met. Thus, we can apply this lemma and show that condition 2 fails with polynomially negligible probability.
Finally, we have shown in our earlier discussion leading up to theEq. 10 that the conditions of Lemma 19 are met. Let us identify the edges chosen by the adversary as the red edges, and let the -sampled edges be the ones that the watermarking algorithm selected in procedure . By Lemma 19, the number of edges that are common to both selections is at least
where we used the fact that , is at most
So we have our result. ∎
4.1 Discussion
It is interesting to note how the differences in the two random graph models translate into differences in their watermarking schemes. The Erdős-Rényi model, with its uniform edge probability, allows for constant separation of high-degree vertices, at best. But all the vertices tend to be well-separated. On the other hand, the skewed edge distribution that is characteristic of the random power-law model allows high-degree vertices to be very well-separated, but a significant number of vertices—the low-degree ones, will not be easily distinguished.
These differences lead to the intuition that virtually all edges in the Erdős-Rényi model are candidates for use in a watermark, as long as only a constant number of selected edges are incident to any single vertex. Therefore, both our watermarking function and the adversary are allowed an approximately linear number of changes to the graph. Theorem 17 confirms this intuition with a scheme that proposes bits for the watermark, and a nearly linear number bits that the adversary may modify.
In contrast, the number of edges that can be used as part of a watermark in the random power-law graph model is limited by the number of distinguishable vertices, which is on the order of or , where .
5 Experiments
Although our paper is a foundational complement to the systems work of Zhao et al. [56, 55], we nevertheless provide in this section the results of a small set of empirical tests of our methods, so as to experimentally reproduce the hypothetical watermarking security experiment from Algorithm 1. Our experiments are performed on two large social network graphs, Youtube [54] from the SNAP library [36], and Flickr [39], as well as a randomly generated graph drawn from the random power-law graph model distribution. Table 1 illustrates the basic properties of the networks. To generate the random power-law graph, we set the number of nodes to , the maximum degree to , the average degree to , and .
| Network | # nodes | # edges | Max. degree | Avg. degree | Unique degree | Estimated |
|---|---|---|---|---|---|---|
| Power-law | 10,000 | 94,431 | 960 | 18.89 | 14 | — |
| Youtube | 1,134,890 | 2,987,624 | 28,754 | 5.27 | 29 | 1.48 |
| Flickr | 1,715,256 | 15,554,181 | 27,203 | 18.14 | 130 | 1.62 |
| Network | # high-degree | # medium-degree | Key size | Marking dK-2 deviation |
|---|---|---|---|---|
| Power law | 64 | 374 | 219 | 0.065 |
| Youtube | 256 | 113 | 184 | 0.033 |
| Flickr | 300 | 5901 | 3250 | 0.002 |
5.1 Adaptations from the theoretical scheme
To adapt our theoretical framework to the rough-and-tumble world of empirical realities, we made three modifications to our framework for the sake of our empirical tests.
First, instead of using the high-degree and medium-degree thresholds derived from Lemmas 12 and 14, for the power-law distribution, to define the cutoffs for high-degree and medium-degree vertices, we used these and the other lemmas given above as justifications for the existence of such distinguishing sets of vertices and we then optimized the number of high- and medium-degree vertices to be values that work best in practice. The column, “Unique degree,” from Table 1 shows, for each network, the number of consecutive nodes with unique degree when considering the nodes in descending order of degree. This is, in theory, the maximum number of high-degree nodes that could be distinguished. Since this value is too small in most cases, we applied the principles of Lemmas 10 and 12 again, in a second-order fashion, to distinguish and order the high-degree nodes. In particular, in addition to the degree of each high-degree vertex, we also label each vertex with the list of degrees of its neighbors, sorted in decreasing order. With this change, we are not restricted in our choice of number of high-degree nodes as required by applying these lemmas only in a first-order fashion. Table 2 shows the values used in our experiments based on this second-order application. As medium-degree vertices, we picked the maximum number such that there are no collisions among their bit vectors of high-degree node adjacencies.
Second, instead of returning failure if (a) two high-degree nodes have the same degree and list of degrees of their neighbors, (b) two medium-degree nodes have the same bit vector, or (c) the approximate isomorphism is not injective, we instead proceed with the algorithm. Despite the existence of collisions, the remaining nodes often provide enough information to conclude successfully.
Finally, we simplified how we resampled (and flipped) edges in order to create a graph watermark, using our approach for the Erdős-Rényi model even for power-law graphs, since resampling uniformly among our small set of marked edges is likely not to cause major deviations in the graph’s distribution and, in any case, it is empirically difficult to determine the value of for real-world social networks. Therefore, we set the resampling probability to so that it is consistent with the Erdős-Rényi model and so that each bit in the message is represented uniformly and independently.
5.2 Fitting real-world networks to the random power-law graph model
Note that during the marking step, resampling the edges of the key requires knowledge of the distribution from which the network is drawn. For this reason, we tried to fit the real-world networks to the random power-law graph model distribution. The main task was to find the exponent of a power law function that would best fit the degree distribution.
First, we give definitions to help introduce the problem. The degree distribution of an undirected graph with vertices is a probability distribution such that the probability mass function is given by for where is the number of vertices with degree . A random variable is said to follow a power-law distribution if the probability density function is given by for some and . As stated before, it has been found empirically that the degree distributions of many naturally-occurring graphs in social networking and science follow a power-law distribution. Note that for observed data that is believed to follow a power-law distribution, the power-law behavior of the data often only holds for values larger than some (see [12]).
In finding , there are three primary focuses: obtaining itself, finding the value for for which the power-law behavior holds after, and finding the associated p-value indicating how good of a fit the power-law distribution is to the degree distribution of . The methods to obtain all three values are taken from Clauset et al. [12] and some of the code used to find all three values can be found at [10, 11].
To obtain , we use the method of maximum likelihood. The maximum-likelihood estimator for is given by
| (12) |
where for are the values of the degree distribution of such that (see [12, 42]).
Next, we discuss finding . is the lower bound for which the data above it follow a power-law distribution. The idea used to find is to choose the value in the observed data (some such that ) such that the empirical cumulative distribution function (CDF) of the observed data above is most similar to the estimated CDF of the power-law distribution of the observed data obtained by using Equation 12 (see [13]). We measure similarity between distributions using the Kolmogorov-Smirnov (KS) statistic. So in order to find , for each we set and compute the KS statistic for the empirical CDF of the observed data larger than and the CDF of the power-law distribution obtained by using Equation 12. The that minimizes the KS statistic will be used as the value for [12].
Last, we discuss finding the p-value based off of the methods in [12]. To find the p-value indicating how well the power-law distribution fits the degree distribution of , we use the methods described above to find and . After doing so, we compute the KS statistic for the empirical CDF of the data and the CDF of the power-law distribution with exponent and . We then generate new data sets from our observed data. Let be the number of observed data larger than . Then with probability , we randomly sample a point from the power-law distribution with exponent and then add it to the new data set. With probability , we randomly sample an observed data point in the interval and add it to the new data set. This process is continued until we have added total data points. Then we compute the KS statistic for the empirical CDF of the newly generated data set and the CDF of the estimated power-law distribution using this newly generated data set. We generate 10,000 data sets and compute the KS statistic for each, where 10,000 is a good rule of thumb in order to have high precision in the p-value. The p-value is then determined by the fraction of the number of generated KS statistic values that are larger than the KS statistic obtained from the original data. A p-value larger than 0.1 implies that the power-law with exponent and is a good fit to our data [12].
We gathered graphs from many different domains to test if the power-law distribution is a good fit to the degree distribution. We tested social networks from Google+ [38], LiveJournal [39], Slashdot [35], Epinions [47], Pokec [51], and Twitter [38]. We also tested citation networks of U.S. patents [33] and ArXiv [33, 21], collaboration networks of ArXiv [34] and the DBLP computer science bibliography [54], email communication networks from the Enron corpus [35, 29] and a European research institution [34], a communication network from Wikipedia’s talk pages [32], location-based online social networks (OSN) [8], Internet autonomous systems (AS) networks [33, 45, 18, 19], snapshots of the graph of the peer-to-peer file sharing service Gnutella [34, 48], road networks from Pennsylvania, Texas, and California [35], and product co-purchasing networks from Amazon [54, 31]. Additionally, we tested web graphs where the nodes represent web pages and the edges are hyperlinks connecting the pages for part of Stanford’s website [35], Notre Dame’s website [35], Stanford and Berkeley’s websites [35], and Google [35]. Our results, shown in Table LABEL:tab:gamma-values, display that the power-law distribution is a good fit for the degree distribution for 29 of the 40 graphs tested. Moreover, 23 of the 29 cases where it is a good fit, the estimated is less than . This prevented us from using Equation 2 for the resampling probabilities, which requires .
5.3 Experiment parameters
For the experiment parameters other than the original network and the number of high- and medium-degree nodes, we set the following values.
- Maximum flips adjacent to any given node during marking:
-
1.
- Key size:
-
We set this to the maximum possible value (i.e., the number of high- and medium-degree vertices divided by two, as shown in Table 2), because the numbers of high- and medium- degree nodes are not large. This effectively means that every high- and medium-degree node has exactly one edge added or removed.
- Number of marked graphs:
-
10.
- Adversary:
-
We used a time-efficient variation of the arbitrary edge-flipping adversary. This adversary selects a set of pairs of nodes randomly, and flips the potential edge among each pair.
5.4 Results
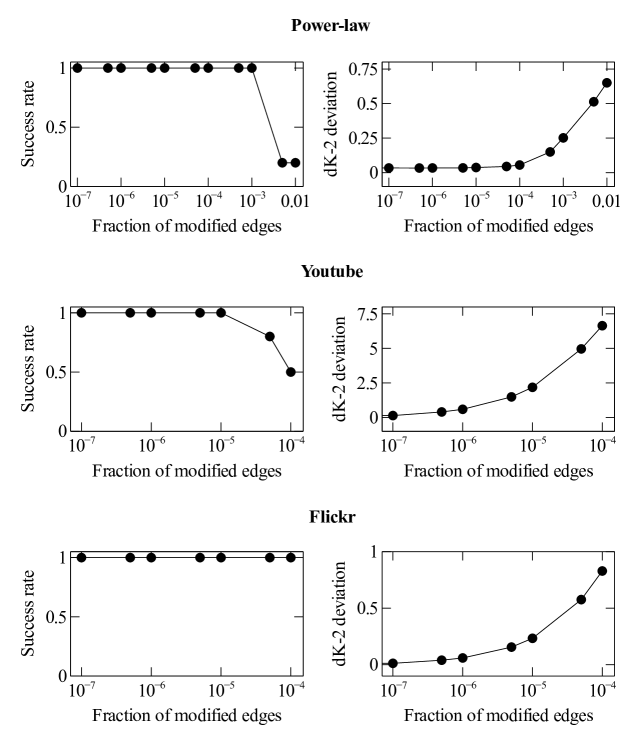
We evaluated how much distortion the adversary can introduce before our method fails to identify the leaked network correctly. For this purpose, we compared the identification success rate to the amount of distortion under different fractions of modified edges by the adversary. To estimate the success rate, we ran the experiment 10 times and reported the fraction of times that the leaked network was identified correctly. As a measure of distortion, we used the dK-2 deviation [55] between the original network and the version modified by the adversary. The dK-2 deviation is the euclidean distance between the dK-2 series [49] of the two graphs, normalized by the number of tuples in the dK-2 series. The dK-2 deviation captures the differences between the joint degree distributions of the networks, that is, the probability that a randomly selected edge has as endpoints nodes with certain degrees. We average the dK-2 deviation among the 10 runs. Figure 2 shows the outcome of our experiments. Moreover, Table 2 shows the dK-2 deviation introduced by the marking alone.
5.5 Discussion
Based on our experiments, the success rate of our scheme is high but it drops after a certain threshold. This demonstrates that there is a distinct range of adversarial edge flips that can be tolerated by our scheme. Specifically, our scheme worked well when the fraction of potential edges flipped by the adversary is up to and for the random power-law and Youtube networks, respectively. For these graphs, this number of flipped potential edges corresponds to and of the number of edges in the original graphs, respectively. For the Flickr network, the runtime of the adversary modification became excessive before the success rate could decrease, at a fraction of of potential edges flipped.
The distortion introduced by the watermark is negligible compared to the distortion caused by the number of flips that the scheme can tolerate. On average, the marking modifies half of the edges on the key, which corresponds to of the number of edges in the original random power-law, Youtube, and Flickr networks, respectively.
For the same number of flips, the dK-2 deviation in the Youtube network was much larger than in the Flickr network, which in turn was larger than that of the random power-law network. A possible explanation for this is that any set of uniform edge flips has a bigger effect on the dk2-deviation of a skewed graph than on the dK-2 deviation of a less skewed graph. Note that the Youtube network has the largest skew, as the maximum degree is on the same order as the Flickr network, but the average degree is less.
6 Conclusion
We defined a watermarking framework and a notion of security meant to capture the difficulty in removing a watermark from a graph. We studied two random graph models and showed that watermarking in these models could be achieved in such a way that no adversary could remove the watermark whp and still have a graph that is “close” to his original graph. A vital feature of our approach is that we watermark graphs to look like typical graphs from the distribution the original graph was issued from, while also making them look similar to the original. In addition, we provided an exemplary implementation that works effectively for marks consisting only of edge flips.
For future work, it would be interesting to consider solutions that can tolerate some degree of collusion. In the exemplary schemes we presented, an adversary is likely to detect many edges of the watermark, if he has access to multiple watermarked graphs produced from the same original graph.
Acknowledgments
This research was supported in part by the National Science Foundation under grants 1011840 and 1228639. This article also reports on work supported by the Defense Advanced Research Projects Agency (DARPA) under agreement no. AFRL FA8750-15-2-0092. The views expressed are those of the authors and do not reflect the official policy or position of the Department of Defense or the U.S. Government.
References
- [1] L. Babai. Graph isomorphism in quasipolynomial time. ArXiv ePrint, abs/1512.03547, 2015.
- [2] L. Babai, P. Erdös, and S. M. Selkow. Random graph isomorphism. SIAM Journal on Computing, 9(3):628–635, 1980.
- [3] L. Backstrom, C. Dwork, and J. Kleinberg. Wherefore art thou r3579x?: Anonymized social networks, hidden patterns, and structural steganography. Commun. ACM, 54(12):133–141, Dec. 2011.
- [4] L. M. S. Bento, D. Boccardo, R. C. S. Machado, V. Pereira de Sá, and J. Szwarcfiter. Towards a provably resilient scheme for graph-based watermarking. In A. Brandstädt, K. Jansen, and R. Reischuk, editors, Graph-Theoretic Concepts in Computer Science, volume 8165 of LNCS, pages 50–63. Springer, 2013.
- [5] B. Bollobás. Random graphs, volume 73 of Cambridge Studies in Advanced Mathematics. Cambridge University Press, Cambridge, second edition, 2001.
- [6] G. Caldarelli. Scale-Free Networks: Complex Webs in Nature and Technology. Oxford University Press, 2013.
- [7] X. Chen, D. Fang, J. Shen, F. Chen, W. Wang, and L. He. A dynamic graph watermark scheme of tamper resistance. In 5th Int. Conf. on Information Assurance and Security (IAS), volume 1, pages 3–6, 2009.
- [8] E. Cho, S. A. Myers, and J. Leskovec. Friendship and mobility: user movement in location-based social networks. In Proceedings of the 17th ACM SIGKDD international conference on Knowledge discovery and data mining, pages 1082–1090. ACM, 2011.
- [9] F. Chung and L. Lu. Complex graphs and networks, volume 107 of CBMS Regional Conf. Series in Math. American Math. Society, 2006.
- [10] A. Clauset and J. Ornstein. Calculating p-value for fitted power-law model. http://tuvalu.santafe.edu/~aaronc/powerlaws/plpva.py, July 2011.
- [11] A. Clauset and J. Ornstein. Fitting a power-law distribution. http://tuvalu.santafe.edu/~aaronc/powerlaws/plfit.py, July 2011.
- [12] A. Clauset, C. R. Shalizi, and M. E. J. Newman. Power-law distributions in empirical data. SIAM Review, 51(4):661–703, 2009.
- [13] A. Clauset, M. Young, and K. S. Gleditsch. On the frequency of severe terrorist events. Journal of Conflict Resolution, 51(1):58–87, 2007.
- [14] C. Collberg, S. Kobourov, E. Carter, and C. Thomborson. Graph-based approaches to software watermarking. In H. Bodlaender, editor, Graph-Theoretic Concepts in Computer Science, volume 2880 of LNCS, pages 156–167. Springer, 2003.
- [15] C. Collberg and C. Thomborson. Software watermarking: Models and dynamic embeddings. In ACM Symp. Princ. of Prog. Lang. (POPL), pages 311–324, 1999.
- [16] I. Cox, M. Miller, J. Bloom, J. Fridrich, and T. Kalker. Digital watermarking and steganography. Morgan Kaufmann, 2007.
- [17] T. Czajka and G. Pandurangan. Improved random graph isomorphism. Journal of Discrete Algorithms, 6(1):85–92, 2008.
- [18] C. for Applied Internet Data Analysis. As relationships. http://www.caida.org/data/as-relationships/.
- [19] C. for Applied Internet Data Analysis. Skitter. http://www.caida.org/tools/measurement/skitter/.
- [20] M. R. Garey and D. S. Johnson. Computers and Intractability: A Guide to the Theory of NP-Completeness. W. H. Freeman, 1979.
- [21] J. Gehrke, P. Ginsparg, and J. Kleinberg. Overview of the 2003 kdd cup. ACM SIGKDD Explorations Newsletter, 5(2):149–151, 2003.
- [22] J. Hamilton and S. Danicic. A survey of graph based software watermarking. Technical report, Department of Computing, Goldsmiths, University of London, 2010.
- [23] M. Hay, G. Miklau, D. Jensen, D. Towsley, and P. Weis. Resisting structural re-identification in anonymized social networks. Proc. VLDB Endow., 1(1):102–114, Aug. 2008.
- [24] N. Hopper, D. Molnar, and D. Wagner. From weak to strong watermarking. In Theory of Cryptography, volume 4392 of LNCS, pages 362–382. Springer, 2007.
- [25] S. Katzenbeisser and F. Petitcolas. Information hiding techniques for steganography and digital watermarking. Artech house, 2000.
- [26] A. Kayem, A. Deshai, and S. Hammer. On anonymizing social network graphs. In Information Security for South Africa (ISSA), pages 1–8, Aug 2012.
- [27] E. Kazemi, S. H. Hassani, and M. Grossglauser. Growing a Graph Matching from a Handful of Seeds. Proceedings of the VLDB Endowment International Conference on Very Large Data Bases, 8(10):1010–1021, 2015.
- [28] S. Khanna and F. Zane. Watermarking maps: Hiding information in structured data. In 11th ACM-SIAM Symposium on Discrete Algorithms (SODA), pages 596–605, 2000.
- [29] B. Klimt and Y. Yang. Introducing the enron corpus. In CEAS, 2004.
- [30] J. Kobler, U. Schöning, and J. Torán. The graph isomorphism problem: its structural complexity. Springer, 2012.
- [31] J. Leskovec, L. A. Adamic, and B. A. Huberman. The dynamics of viral marketing. ACM Transactions on the Web (TWEB), 1(1):5, 2007.
- [32] J. Leskovec, D. Huttenlocher, and J. Kleinberg. Signed networks in social media. In Proceedings of the SIGCHI conference on human factors in computing systems, pages 1361–1370. ACM, 2010.
- [33] J. Leskovec, J. Kleinberg, and C. Faloutsos. Graphs over time: densification laws, shrinking diameters and possible explanations. In Proceedings of the eleventh ACM SIGKDD international conference on Knowledge discovery in data mining, pages 177–187. ACM, 2005.
- [34] J. Leskovec, J. Kleinberg, and C. Faloutsos. Graph evolution: Densification and shrinking diameters. ACM Transactions on Knowledge Discovery from Data (TKDD), 1(1):2, 2007.
- [35] J. Leskovec, K. J. Lang, A. Dasgupta, and M. W. Mahoney. Community structure in large networks: Natural cluster sizes and the absence of large well-defined clusters. Internet Mathematics, 6(1):29–123, 2009.
- [36] J. Leskovec and R. Sosič. SNAP: A general purpose network analysis and graph mining library in C++. http://snap.stanford.edu/snap, June 2014.
- [37] K. Liu and E. Terzi. Towards identity anonymization on graphs. In ACM SIGMOD Int. Conf. on Management of Data, pages 93–106, 2008.
- [38] J. J. McAuley and J. Leskovec. Learning to discover social circles in ego networks. In NIPS, volume 2012, pages 548–56, 2012.
- [39] A. Mislove, M. Marcon, K. P. Gummadi, P. Druschel, and B. Bhattacharjee. Measurement and analysis of online social networks. In 5th ACM/Usenix Internet Measurement Conference (IMC), 2007.
- [40] M. Mitzenmacher. A brief history of generative models for power law and lognormal distributions. Internet Mathematics, 1(2):226–251, 2004.
- [41] M. Mitzenmacher and E. Upfal. Probability and Computing: Randomized Algorithms and Probabilistic Analysis. Cambridge Univ. Press, New York, NY, 2005.
- [42] A. Muniruzzaman. On measures of location and dispersion and tests of hypotheses on a pareto population. Bulletin of the Calcuta Statistical Association, 7:115–123, 1957.
- [43] A. Narayanan and V. Shmatikov. De-anonymizing social networks. In IEEE Symp. on Security and Privacy (SP), pages 173–187, 2009.
- [44] M. Newman, A.-L. Barabasi, and D. J. Watts. The Structure and Dynamics of Networks. Princeton Studies in Complexity. Princeton Univ. Press, 2006.
- [45] U. of Oregon. University of Oregon route views project. http://www.routeviews.org/.
- [46] R. C. Read and D. G. Corneil. The graph isomorphism disease. Journal of Graph Theory, 1(4):339–363, 1977.
- [47] M. Richardson, R. Agrawal, and P. Domingos. Trust management for the semantic web. In The Semantic Web-ISWC 2003, pages 351–368. Springer, 2003.
- [48] M. Ripeanu, I. Foster, and A. Iamnitchi. Mapping the gnutella network: Properties of large-scale peer-to-peer systems and implications for system design. ArXiv ePrint cs/0209028, 2002.
- [49] A. Sala, L. Cao, C. Wilson, R. Zablit, H. Zheng, and B. Y. Zhao. Measurement-calibrated graph models for social network experiments. In 19th Int. Conf. on the World Wide Web (WWW), pages 861–870, 2010.
- [50] F. Y. Shih. Digital watermarking and steganography: fundamentals and techniques. CRC Press, 2007.
- [51] L. Takac and M. Zabovsky. Data analysis in public social networks. In International Scientific Conference and International Workshop Present Day Trends of Innovations, pages 1–6, 2012.
- [52] R. Venkatesan, V. Vazirani, and S. Sinha. A graph theoretic approach to software watermarking. In I. Moskowitz, editor, Information Hiding, volume 2137 of LNCS, pages 157–168. Springer, 2001.
- [53] G. Wondracek, T. Holz, E. Kirda, and C. Kruegel. A practical attack to de-anonymize social network users. In IEEE Symp. on Security and Privacy (SP), pages 223–238, 2010.
- [54] J. Yang and J. Leskovec. Defining and evaluating network communities based on ground-truth. CoRR, abs/1205.6233, 2012.
- [55] X. Zhao, Q. Liu, H. Zheng, and B. Y. Zhao. Towards graph watermarks. In 2015 ACM Conf. on Online Social Networks (COSN), pages 101–112, 2015.
- [56] X. Zhao, Q. Liu, L. Zhou, H. Zheng, and B. Y. Zhao. Graph watermarks. ArXiv ePrint, abs/1506.00022, 2015.
- [57] B. Zhou and J. Pei. Preserving privacy in social networks against neighborhood attacks. In IEEE Int. Conf. on Data Engineering (ICDE), pages 506–515, April 2008.